
Sampling
- Page ID
- 156509

\( \newcommand{\vecs}[1]{\overset { \scriptstyle \rightharpoonup} {\mathbf{#1}} } \)
\( \newcommand{\vecd}[1]{\overset{-\!-\!\rightharpoonup}{\vphantom{a}\smash {#1}}} \)
\( \newcommand{\dsum}{\displaystyle\sum\limits} \)
\( \newcommand{\dint}{\displaystyle\int\limits} \)
\( \newcommand{\dlim}{\displaystyle\lim\limits} \)
\( \newcommand{\id}{\mathrm{id}}\) \( \newcommand{\Span}{\mathrm{span}}\)
( \newcommand{\kernel}{\mathrm{null}\,}\) \( \newcommand{\range}{\mathrm{range}\,}\)
\( \newcommand{\RealPart}{\mathrm{Re}}\) \( \newcommand{\ImaginaryPart}{\mathrm{Im}}\)
\( \newcommand{\Argument}{\mathrm{Arg}}\) \( \newcommand{\norm}[1]{\| #1 \|}\)
\( \newcommand{\inner}[2]{\langle #1, #2 \rangle}\)
\( \newcommand{\Span}{\mathrm{span}}\)
\( \newcommand{\id}{\mathrm{id}}\)
\( \newcommand{\Span}{\mathrm{span}}\)
\( \newcommand{\kernel}{\mathrm{null}\,}\)
\( \newcommand{\range}{\mathrm{range}\,}\)
\( \newcommand{\RealPart}{\mathrm{Re}}\)
\( \newcommand{\ImaginaryPart}{\mathrm{Im}}\)
\( \newcommand{\Argument}{\mathrm{Arg}}\)
\( \newcommand{\norm}[1]{\| #1 \|}\)
\( \newcommand{\inner}[2]{\langle #1, #2 \rangle}\)
\( \newcommand{\Span}{\mathrm{span}}\) \( \newcommand{\AA}{\unicode[.8,0]{x212B}}\)
\( \newcommand{\vectorA}[1]{\vec{#1}} % arrow\)
\( \newcommand{\vectorAt}[1]{\vec{\text{#1}}} % arrow\)
\( \newcommand{\vectorB}[1]{\overset { \scriptstyle \rightharpoonup} {\mathbf{#1}} } \)
\( \newcommand{\vectorC}[1]{\textbf{#1}} \)
\( \newcommand{\vectorD}[1]{\overrightarrow{#1}} \)
\( \newcommand{\vectorDt}[1]{\overrightarrow{\text{#1}}} \)
\( \newcommand{\vectE}[1]{\overset{-\!-\!\rightharpoonup}{\vphantom{a}\smash{\mathbf {#1}}}} \)
\( \newcommand{\vecs}[1]{\overset { \scriptstyle \rightharpoonup} {\mathbf{#1}} } \)
\(\newcommand{\longvect}{\overrightarrow}\)
\( \newcommand{\vecd}[1]{\overset{-\!-\!\rightharpoonup}{\vphantom{a}\smash {#1}}} \)
\(\newcommand{\avec}{\mathbf a}\) \(\newcommand{\bvec}{\mathbf b}\) \(\newcommand{\cvec}{\mathbf c}\) \(\newcommand{\dvec}{\mathbf d}\) \(\newcommand{\dtil}{\widetilde{\mathbf d}}\) \(\newcommand{\evec}{\mathbf e}\) \(\newcommand{\fvec}{\mathbf f}\) \(\newcommand{\nvec}{\mathbf n}\) \(\newcommand{\pvec}{\mathbf p}\) \(\newcommand{\qvec}{\mathbf q}\) \(\newcommand{\svec}{\mathbf s}\) \(\newcommand{\tvec}{\mathbf t}\) \(\newcommand{\uvec}{\mathbf u}\) \(\newcommand{\vvec}{\mathbf v}\) \(\newcommand{\wvec}{\mathbf w}\) \(\newcommand{\xvec}{\mathbf x}\) \(\newcommand{\yvec}{\mathbf y}\) \(\newcommand{\zvec}{\mathbf z}\) \(\newcommand{\rvec}{\mathbf r}\) \(\newcommand{\mvec}{\mathbf m}\) \(\newcommand{\zerovec}{\mathbf 0}\) \(\newcommand{\onevec}{\mathbf 1}\) \(\newcommand{\real}{\mathbb R}\) \(\newcommand{\twovec}[2]{\left[\begin{array}{r}#1 \\ #2 \end{array}\right]}\) \(\newcommand{\ctwovec}[2]{\left[\begin{array}{c}#1 \\ #2 \end{array}\right]}\) \(\newcommand{\threevec}[3]{\left[\begin{array}{r}#1 \\ #2 \\ #3 \end{array}\right]}\) \(\newcommand{\cthreevec}[3]{\left[\begin{array}{c}#1 \\ #2 \\ #3 \end{array}\right]}\) \(\newcommand{\fourvec}[4]{\left[\begin{array}{r}#1 \\ #2 \\ #3 \\ #4 \end{array}\right]}\) \(\newcommand{\cfourvec}[4]{\left[\begin{array}{c}#1 \\ #2 \\ #3 \\ #4 \end{array}\right]}\) \(\newcommand{\fivevec}[5]{\left[\begin{array}{r}#1 \\ #2 \\ #3 \\ #4 \\ #5 \\ \end{array}\right]}\) \(\newcommand{\cfivevec}[5]{\left[\begin{array}{c}#1 \\ #2 \\ #3 \\ #4 \\ #5 \\ \end{array}\right]}\) \(\newcommand{\mattwo}[4]{\left[\begin{array}{rr}#1 \amp #2 \\ #3 \amp #4 \\ \end{array}\right]}\) \(\newcommand{\laspan}[1]{\text{Span}\{#1\}}\) \(\newcommand{\bcal}{\cal B}\) \(\newcommand{\ccal}{\cal C}\) \(\newcommand{\scal}{\cal S}\) \(\newcommand{\wcal}{\cal W}\) \(\newcommand{\ecal}{\cal E}\) \(\newcommand{\coords}[2]{\left\{#1\right\}_{#2}}\) \(\newcommand{\gray}[1]{\color{gray}{#1}}\) \(\newcommand{\lgray}[1]{\color{lightgray}{#1}}\) \(\newcommand{\rank}{\operatorname{rank}}\) \(\newcommand{\row}{\text{Row}}\) \(\newcommand{\col}{\text{Col}}\) \(\renewcommand{\row}{\text{Row}}\) \(\newcommand{\nul}{\text{Nul}}\) \(\newcommand{\var}{\text{Var}}\) \(\newcommand{\corr}{\text{corr}}\) \(\newcommand{\len}[1]{\left|#1\right|}\) \(\newcommand{\bbar}{\overline{\bvec}}\) \(\newcommand{\bhat}{\widehat{\bvec}}\) \(\newcommand{\bperp}{\bvec^\perp}\) \(\newcommand{\xhat}{\widehat{\xvec}}\) \(\newcommand{\vhat}{\widehat{\vvec}}\) \(\newcommand{\uhat}{\widehat{\uvec}}\) \(\newcommand{\what}{\widehat{\wvec}}\) \(\newcommand{\Sighat}{\widehat{\Sigma}}\) \(\newcommand{\lt}{<}\) \(\newcommand{\gt}{>}\) \(\newcommand{\amp}{&}\) \(\definecolor{fillinmathshade}{gray}{0.9}\)I. Headspace Sampling for Volatile and Semi-volatile Analytes
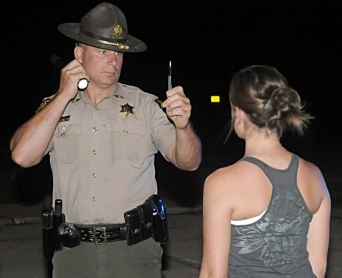
Figure 1. Field Sobriety Test1
Q1. You probably have seen enough crime shows to predict how the laboratory analysis for blood alcohol content will be done. Whether you know or not, you should be able to describe the physical characteristics of both the sample (blood) and the material to be analyzed (ethyl alcohol) that might have to be considered in the analysis. Describe if you can what part of the sample will be used, and what method of analysis might be employed.
Blood is a complex matrix, containing hundreds of substances, including red and white blood cells along with large molecular weight proteins and enzymes. The primary component is water (92%), which we know boils at about 100 oC (depending on pressure), and has a vapor pressure of about 3 kPa near room temperature. Ethanol boils at a lower temperature than water (about 78 oC) and has a higher vapor pressure, about twice that of water (6 kPa at 20 oC).
Recall that vapor pressure is defined as the pressure exerted by a gas in a closed container when at equilibrium with the corresponding liquid phase. This means that at a fixed temperature, the amount of substance in the gas phase relative to the liquid phase increases with vapor pressure.
Substances with high values of vapor pressure are considered to be more volatile than those that do not. Considering that the larger molecular weight components of blood have much smaller vapor pressures than water and ethanol, one might consider the vapor phase above the liquid (blood) sample as a good place to look for ethanol in the absence of the very large number of possible interferents.
The equilibrium is illustrated in Figure 2. A sealed vial contains, in this case, equal volumes of air space and liquid. The substance of interest, say ethanol, is dissolved in the complex matrix, say blood, at some level. Once equilibrium is reached between the gas and liquid phases, ethanol (and other volatile substances) will be found at concentrations described by the partition coefficient (K) for each analyte:
\[\mathrm{K = \dfrac{C_{liquid}}{C_{gas}}} \label{Eq. 1}\]
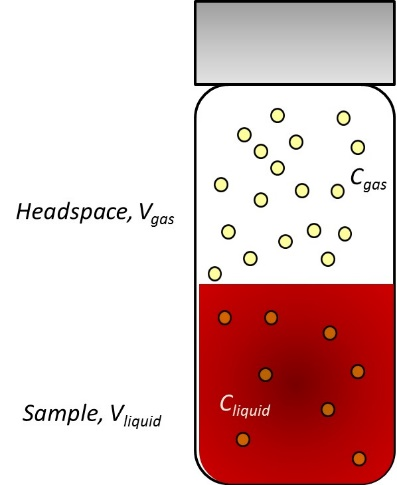
Figure 2. Equilibrium between liquid and gas phases in sealed vial.
In addition, each analyte will have a propensity to enter the gas phase that is dependent upon the relative volumes of the gas and liquid phases. This is described by the phase ratio, β, given by
\[\mathrm{β = \dfrac{V_{gas}}{V_{liquid}}} \label{Eq. 2}\]
Combining the equations for K and for β yields an expression2 that describes the concentration of analyte in the gas phase as
\[\mathrm{C_{gas} = \dfrac{C_{liquid}}{K + β}} \label{Eq. 3}\]
Q2. Knowing that we are interested in analyzing the amount of alcohol in blood, you would rightly assume that the larger the concentration of the analyte in the gas phase, the easier it would be to evaluate. Using Le Chatelier’s principle as a guide, list and explain ways you might increase the concentration of ethanol in the gas phase over the liquid blood sample.
Q3. What analytical method(s) do you know about that are amenable to volatile substances in the gas phase?
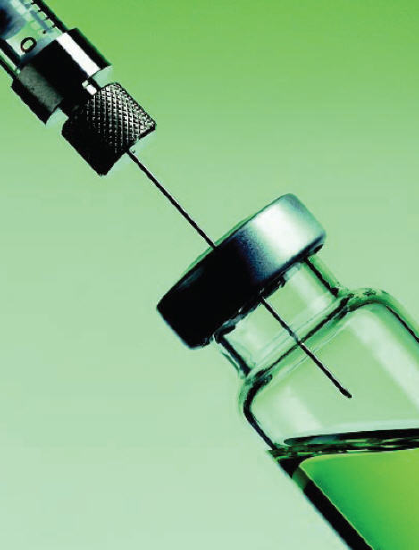
Figure 3. Headspace Sampling.4
Q4. What advantages can you see for chromatographic analysis when sampling only from the volatile gas phase above a complex matrix?
The headspace technique samples only the volatile substances at equilibrium in the gas phase, and eliminates the need for sample cleanup while preventing the injection of non-volatile materials that can often contaminate the chromatographic system. While this introduction has focused on blood as a sample matrix, headspace analysis is possible for solid or liquid samples.
Improving the amount of volatile analyte in the gas phase. The two most important parameters affecting the distribution between two phases are temperature and solubility. The effect of temperature on the distribution coefficient, K, is given by
\[\mathrm{\ln K = \dfrac{A}{RT} – B} \label{Eq. 4}\]
where A and B are thermodynamic constants, R is the ideal gas constant, and T is the temperature in Kelvin.2 Thus, increasing the temperature will decrease the value of K. Recall that K = Cliquid/Cgas, which means that Cgas increases with T. For ethanol in water, the values for K are 1355 at 40 oC and 328 at 80 oC.4
Increasing the temperature to increase Cgas works best for analytes that have a high solubility (high K value) in the sample matrix. For analytes with low solubility in the sample matrix (low K value), an increase in the volume of sample relative to the headspace volume (decreasing β) will be more effective at increasing Cgas.5 The addition of large concentrations of an inorganic salt like sodium chloride can also result in a reduction of matrix solubility (“salting out”) for many analytes, especially polar ones, leading to an enhanced analyte concentration in the headspace.4
Q5. To this point in our discussion of static headspace analysis, we have considered the GC analysis of a gaseous sample taken from above the sample matrix. The concentration of analyte in the gas sample is dependent upon temperature and solubility in the sample matrix. Instead of just sampling the gas directly, can you think of a way to physically enhance the amount of analyte you obtain from the gas sample prior to its introduction into the GC? (Hint: Brita® filter.)
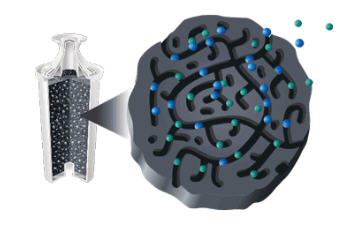
Figure 4. Cutaway View of a Brita® Filter.6
In dynamic headspace sampling, the analyte is allowed to equilibrate into the headspace above the sample matrix as before, but then a flow of inert gas (usually GC carrier) is introduced into the headspace through a needle and allowed to flow out of the vial via a second needle. This gas flow is directed either onto a cold trap, or more commonly onto a trap containing a solid adsorbent. As analyte is removed from the headspace, it is replenished according to its value of K, the partition coefficient. Over time, the concentration in the sample matrix is reduced, allowing for an exhaustive, or near-exhaustive collection of the analyte on the trap. Dynamic headspace can be used for either solid or liquid samples. A schematic of the method is given in Figure 5.
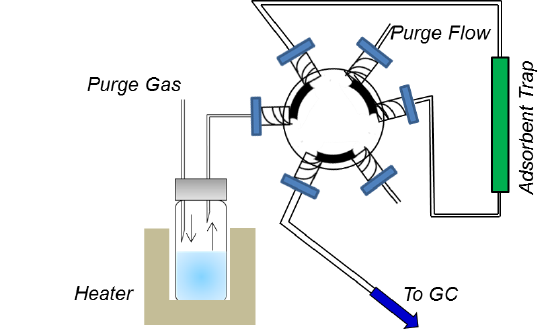
Figure 5. Dynamic Headspace GC.
The concentration of analyte in the headspace is reduced over time according to
\[\mathrm{C_t = C_o e^{-(F\, t\, /\, V)}} \label{Eq. 5}\]
where Ct is the concentration of analyte in the headspace after time t, Co is the initial equilibrium concentration in the headspace, F is the flow rate of purge gas, t is the purge time, and V is the headspace volume.7
Q6. Rearrange Equation \ref{Eq. 5} to solve for the time, t, required to remove 99% of the analyte from a sample if the flow rate of helium is 40 mL/min and the volume of the headspace is 10 mL.
Commonly used sorbent materials for dynamic headspace analysis include silica gel, activated carbon, and Tenax®, a porous polymer prepared from 2,6-dipheny-p-phenylene oxide.8 These can be used alone, or in series as a multi-layer trap, depending upon the complexity of the sample being collected. Tenax® has a low affinity for water, and works well for nonpolar volatiles. Silica gel is highly polar and retains water and other polar analytes well. Activated carbon is hydrophobic and is very good at trapping highly volatile compounds.5
Following extraction, the trap is heated and the sample thermally desorbed onto the column of a gas chromatograph. Reverse inert gas flow is directed through the trap so that the least volatile analytes, which were trapped first, are prevented from contacting the strongest of the adsorbents, which could lead to slow desorption.5
Purge and trap. If instead of directing the inert gas flow through the headspace above the sample, the gas is bubbled through an analyzed liquid sample, the technique is referred to as purge and trap. This is most often applied to volatile analytes in a water matrix, as for example in EPA 524.2, a method for the analysis of purgeable organics in drinking water.9 In general, a fritted sparging tube, either 5 or 25 mL in volume, as shown in Figure 6 (from Restek10), is used for purge and trap. The inert gas is introduced through a needle placed within the solution volume, while the sample rests on a glass frit. As in dynamic headspace analysis, the purge
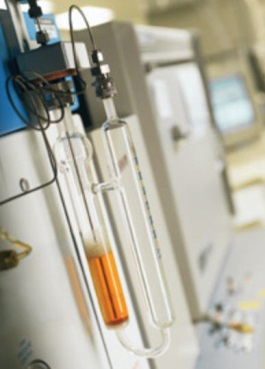
Figure 6. Sparge Tube for Purge and Trap10
II. Solid Phase Microextraction (SPME)
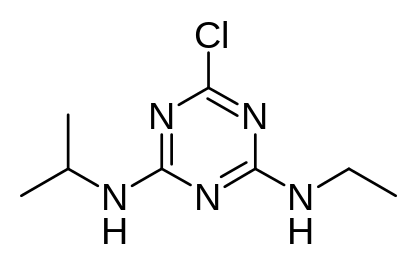
Figure 7. Structure of Atrazine
Q7. Consider the structure of atrazine. Would you expect it be water soluble? Why? What other characteristics of the molecule might be important to consider when performing an analysis?
Historically, the most common method for the analysis of atrazine in natural waters involved a liquid-liquid extraction (LLE), a sample volume of 1 L (adjusted to pH 7.0) and multiple volumes (100 mL minimum) of an organic solvent like dichloromethane. The organic extracts were combined and reduced in volume prior to analysis by GC or HPLC.12
Q8. What would you consider to be the drawbacks to the LLE method detailed above?
Q9. If you were to design an “ideal” method for sampling and preconcentration of an environmental contaminant like atrazine in natural waters, what characteristics would you build in to the method?
Much effort is being expended in the analytical community to develop methods for environmental contaminants that replace techniques like LLE that require large sample volumes, often unfriendly chlorinated solvents, and long prep times. One technique that has proven to be quite capable of addressing most, if not all, of these concerns is solid phase microextraction (SPME).
Solid phase microextraction (SPME) utilizes a small length (1-2 cm) of fused silica fiber that is coated with a sorbent material allowing to selectively preconcentrate analyte from either the gas or liquid phase. The technique allows for easy, one-step sample collection without the need of solvents or long sample preparation time. It can be used for direct sample collection from air or water in the field, and has even been applied to in vivo analysis.13 After sample exposure, the fiber is introduced into the heated injector of a gas chromatograph where the analyte is desorbed. With an appropriate interface allowing for removal of the analyte into a solvent, the technique can also be applied to HPLC analysis.14
The SPME fiber, which is fragile, is housed inside of a syringe needle to protect it before and after sampling. In headspace or direct immersion sampling, the fiber is exposed to the sample only after the vial septum has been punctured. Following extraction, the fiber is retracted before insertion into the GC, and once inside the injection liner, the fiber is extended for desorption. The fiber apparatus is shown in Figure 8.
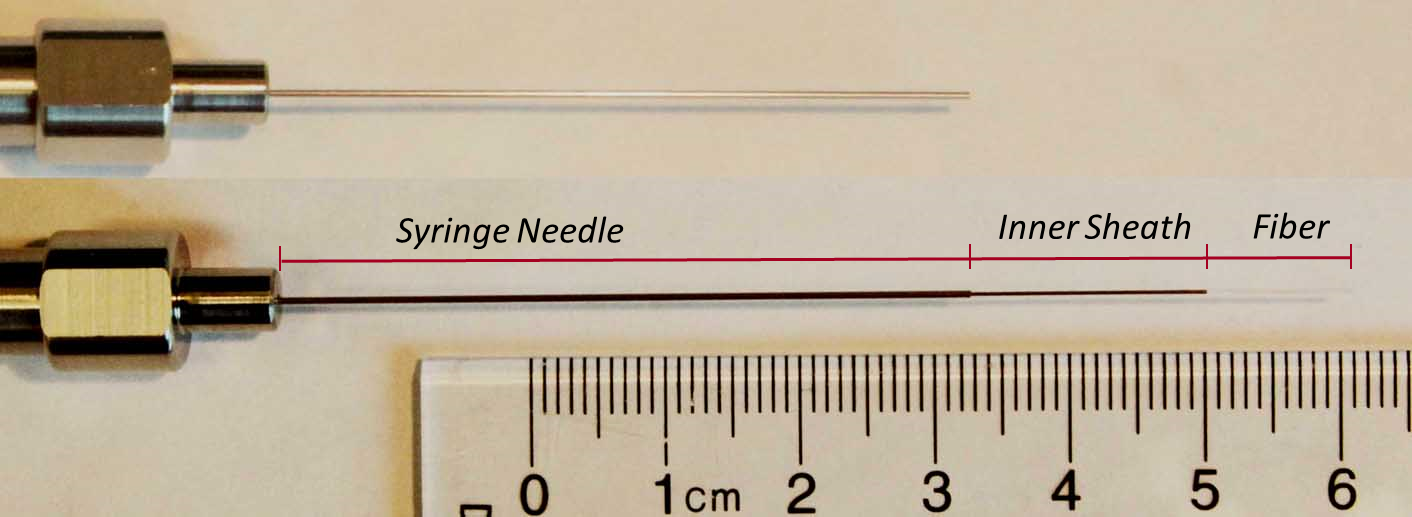
Figure 8. SPME Fiber Assembly. At top, the fiber is retracted inside the syringe needle. Below, the inner sheath and the fiber have been extended out of the needle for sample extraction or desorption.
Sorbent materials may be either liquid polymers, like polydimethylsiloxane (PDMS), polyacrylate (PA) and polyethyleneglycol (PEG), or solid particles, like CarboxenTM (porous carbon) and divinylbenzene (DVB), that are suspended within a liquid polymer. The mechanism for extraction is different for the two materials. The liquid polymers are referred to as absorbent coatings, into which analyte molecules diffuse, attracted primarily by the polarity of the polymer. Retention within the coating is a result of both these attractive forces and the thickness of the polymer, much like that seen for chromatographic stationary phases. Porous particles extract analyte molecules on the basis of adsorption, the result of \(\pi\)-\(\pi\) or H-bonding, and van der Waals type interaction.12 Porous materials are generally characterized by pore size and extent of porosity, along with total surface area, with the strength of adsorption dependent upon analyte particle size.
SPME fibers are available commercially from Suplelco/Sigma-Aldrich. In general, the choice of fiber is dictated by the properties of the analyte, notably polarity, molecular weight, volatility, and concentration range.14 PDMS coatings are available in a variety of thicknesses, dictated by sample volatility, and exhibit best sensitivities toward non-polar analytes. PA coated fibers are suited primarily for polar analytes in polar media. Mixed phase coatings are the best choice for smaller, volatile, and polar analytes.16 Detailed selection guides are available from the manufacturer, and in references 15 and 16.
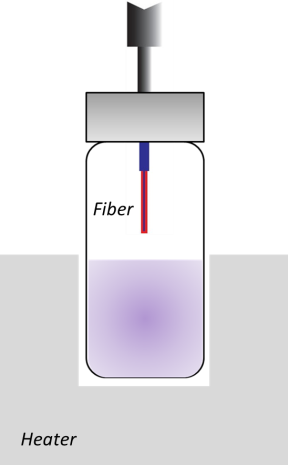
Figure 9. SPME fiber in vial headspace.
Q10. Predict how the process of equilibrium between a SPME fiber in the gas phase above a sample and one immersed in a liquid sample might differ. Which of the two would you predict would occur faster?
Q11. What complications would you expect from direct immersion (DI) SPME that you expect to be absent in HS-SPME?
The distribution coefficient for an analyte in a sample matrix and the SPME fiber within that matrix is given by
\[\mathrm{K_{fs} = \dfrac{C_f}{C_s}} \label{Eq. 6}\]
where Cf is the concentration of analyte within the fiber and Cs is the concentration of analyte in the sample matrix.16 Until an equilibrium condition is reached, the concentration within the fiber will increase over time. If the fiber is in solution, it is important the solution (or the fiber) is agitated during the concentration step as the analyte concentration in the solution layer close to the fiber will be depleted over time. In the gas phase above the sample matrix, the description of the distribution coefficient is more complicated, involving three phases instead of two. Additionally, as the analyte is desorbed from the headspace, more analyte will be pulled into the gas phase from the sample matrix.
The equilibrium concentration of analyte into the fiber will be identical using extractions from either of the phases, as long as the volumes of the two are equivalent.15 Also, the amount of analyte extracted into the fiber is independent of the sample volume if KfsVf << Vs, where Vf is the volume of the fiber coating, and Vs is the volume of the sample.16
Advantages of HS-SPME over DI-SPME are similar to those described for HS-GC in the previous section. Sampling in the gas phase prevents fouling of the fiber with high molecular weight impurities, or those that might irreversibly adsorb to the fiber surface. In the absence of these complex matrix effects, DI extraction works best for analytes with lower volatility and polarity. Conversely, HS extraction is better suited for analytes with higher volatilities and polarity.5 Because of higher analyte diffusion rates in the gas phase relative to the liquid phase, equilibrium occurs faster for HS than for DI. Further, because of the relationship between large sample volume and amount of extracted analyte, SPME is ideal for field sampling, allowing direct analyte extraction in large volumes of air or water with no required sample pretreatment.13
Optimization of Conditions for SPME. In addition to sorbent type and thickness, other factors to consider in the optimization of analyte extraction by SPME include temperature, sample volume, pH and ionic strength, agitation conditions, and desorption parameters.5
Temperature. Increasing the temperature at which extraction is carried out increases the diffusion coefficients for the analyte, thus leading to a more rapid extraction. However, these kinetic effects are countered by a decrease in Kfs and consequently a lower amount of extracted analyte once equilibrium is achieved.15 If the analyte concentration is high in the sample, and sensitivity is not an issue, higher temperatures allow for shorter analysis times. Lower temperatures and longer extraction times may be required if sensitivity is a problem. Extraction efficiencies may also be increased in some instances by the use of a cold fiber technique, in which the fiber is cooled either by introduction of liquid CO2 via an inner capillary, or by Peltier cooling.15
Sample Volume. The equilibrium amount of analyte extracted from a sample is described by
\[\mathrm{n = \dfrac{K_{fs}\, V_f\, V_s\, C_o}{K_{fs}\, V_f + V_s}} \label{Eq. 7}\]
where n is the number of moles extracted, Co is the analyte concentration in the sample, and other variables are as previously defined.16 In general, if KfsVf > Vs, then the amount of analyte extracted will increase with sample volume.15 In most laboratory settings, sample vials for use with SPME have volumes from 1.5 to 20 mL, with extraction amounts normally increasing with Vs over this volume range.15 As described previously, for very large values of Vs (direct air or water sampling, eg), the amount of extracted analyte will depend only upon Co for set values for Kfs and Vf. For low concentrations of volatile analytes (<50 ppb), the amount of extracted analyte may be observed to be independent of sample volume, while exponentially increasing calibration curves are often seen for large samples (>5 mL) containing high concentrations of analyte.13
pH and Ionic Strength. Commercially available SPME fibers employ sorbents that are neutral, and thus basic or acidic analytes must be converted to neutral species prior to extraction. Care must be exercised in pH adjustment of the sample matrix, as some fibers may be degraded at very high or very low pH. The addition of an inert salt, as described for HS-GC, will many times serve to enhance the extraction efficiencies for certain analytes.13
Agitation. Samples for SPME are typically agitated during extraction to decrease the time required to achieve equilibrium with the fiber, and to increase the amount of analyte extracted. There are many ways to achieve proper agitation, including magnetic stirring, sample vial movement, or movement of the fiber within the sample vial. The choice of agitation may be dictated by autosampler make/model, or selected according to specific method requirements for a particular analyte.
Desorption. For GC analysis, samples are normally desorbed from the SPME fiber by insertion into the injection port of the chromatograph. Controllable parameters include inlet temperature, depth of fiber insertion, carrier gas flow at inlet, and desorption time. Typically, a small bore inlet liner (ca. 0.75 mm) is used without split flow during injection to increase the flow rate of carrier gas around the fiber and thereby the efficiency of extraction for adsorbed analytes.13 Inlet temperatures, fiber depth, and desorption times are optimized for rapid, but complete extraction of analyte. The Supelco website (among others) provides a large number of SPME applications that provide a convenient starting point for methods development.17
Q12. Access the Supelco SPME applications website (reference 17), and obtain suggested experimental conditions for the analysis of atrazine (a triazine environmental pesticide) from water samples.
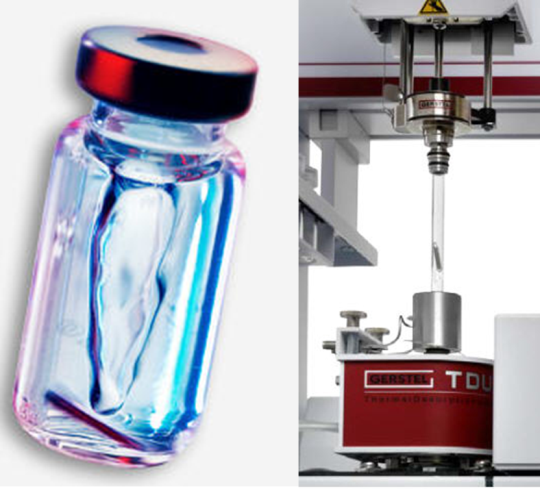
Figure 10. Stir Bar Sorptive Extraction (SBSE).18
References
- Anderson, Scott. News Tribune (La Salle, IL) [Online], July 9, 2014. newstrib.com/main.asp?SectionID=2&SubSectionID=29&ArticleID=37704 (accessed May 22, 2017).
- Penton, Z. E. Headspace Gas Chromatography. In Handbook of Sample Preparation; Pawliszyn, J., Lord, H., Eds.; John Wiley & Sons: Hoboken, NJ, 2010, pp. 25-37.
- Santoro, S. G.M. High-Throughput Blood Alcohol Analysis Determination Using Headspace Gas Chromatography, Forensic Magazine [Online], 02/10/2012. http://www.forensicmag.com/articles/2012/02/high-throughput-blood-alcohol-analysis-determination-using-headspace-gas-chromatography (accessed May 22, 2017).
- Restek Corporation, 2000. A Technical Guide for Headspace Analysis Using GC. www.restek.com/pdfs/59895B.pdf (accessed May 22, 2017).
- Slack, G. C., Snow, N. H., and Kou, D. Extraction of Volatile Organic Compounds From Solids and Liquids. In Sample Preparation Techniques in Analytical Chemistry; Mitra, S., Ed.; John Wiley & Sons: Hoboken, NJ, 2003, pp. 183-225.
- Brita, LP. https://www.brita.com/why-brita/what-we-filter/ (accessed May 22, 2017).
- Tipler, A. An Introduction to Headspace Sampling in Gas Chromatography: Fundamentals and Theory. http://www.perkinelmer.com/PDFs/downloads/GDE_Intro_to_Headspace.pdf (accessed May 22, 2017).
- Sigma-Aldrich Co. http://www.sigmaaldrich.com/analytical-chromatography/analytical-products.html?TablePage=14540726 (accessed May 22, 2017).
- Environmental Protection Agency. Measurement of Purgeable Organic Compounds in Water by Capillary Gas Chromatography/Mass Spectrometry. EPA Method 524.2, 1992, www.epa.gov/homeland-security-research/epa-method-5242-measurement-purgeable-organic-compounds-water-capillary (accessed May 22, 2017).
- Thomas, J. Restek Corporation. A 12-Minute Purge and Trap GC/MS Analysis for Volatiles. http://www.restek.com/Technical-Resources/Technical-Library/Environmental/env_A001 (accessed May 22, 2017).
- Environmental Protection Agency. Atrazine Updates. http://www.epa.gov/pesticides/reregistration/atrazine/atrazine_update.htm (accessed May 22, 2017)
- Rodríguez, J. A.; Aguilar-Arteaga, K.; Díez, C.; Barrado, E. Recent Advances in the Extraction of Triazines from Water Samples, Herbicides. In Advances in Research. Price, A. http://www.intechopen.com/books/herbicides-advances-in-research/recent-advances-in-the-extraction-of-triazines-from-water-samples (accessed May 22, 2017).
- Supleco/Sigma-Aldrich Co. Solid Phase Microextraction: Theory and Optimization of Conditions. Bulletin 923, 1998. https://www.sigmaaldrich.com/content/dam/sigma-aldrich/docs/Supelco/Bulletin/4547.pdf (accessed May 22, 2017).
- Shirey, R. E. SPME Commercial Devices and Fiber Coatings. In Handbook of Solid Phase Microextraction; Pawliszyn, J., Ed.; Chemical Industry Press: Beijing, 2009, pp. 86-115.
- Risticevic, S., Vuckovic, D., and Pawliszyn, J. Solid Phase Microextraction. In Handbook of Sample Preparation; Pawliszyn, J., and Lord, H., Eds.; John Wiley & Sons: Hoboken, NJ, 2010, pp. 81-101.
- Wells, M. J. M. Principles of Extraction and the Extraction of Semivolatile Organics from Liquids. In Sample Preparation Techniques in Analytical Chemistry; Mitra, S., Ed.; John Wiley & Sons: Hoboken, NJ, 2003, pp. 37-138.
- Supelco/Sigma-Aldrich Co. SPME Applications Guide. 3rd Edition, 2001, https://www.sigmaaldrich.com/content/dam/sigma-aldrich/docs/Supelco/Bulletin/8652.pdf (accessed May 22, 2017).
- Gerstel, Inc. Twister / Stir Bar Sorptive Extraction SBSE. http://www.gerstel.com/en/twister-stir-bar-sorptive-extraction.htm (accessed May 22, 2017).
- Gerstel, Inc. Applications by Technology: Twister/Stir Bar Sorptive Extraction. http://www.gerstel.com/en/apps-twister-sbse.htm (accessed May 22, 2017).