
Determining the molar extinction coefficient of gold nanoparticles
- Page ID
- 242488

\( \newcommand{\vecs}[1]{\overset { \scriptstyle \rightharpoonup} {\mathbf{#1}} } \)
\( \newcommand{\vecd}[1]{\overset{-\!-\!\rightharpoonup}{\vphantom{a}\smash {#1}}} \)
\( \newcommand{\dsum}{\displaystyle\sum\limits} \)
\( \newcommand{\dint}{\displaystyle\int\limits} \)
\( \newcommand{\dlim}{\displaystyle\lim\limits} \)
\( \newcommand{\id}{\mathrm{id}}\) \( \newcommand{\Span}{\mathrm{span}}\)
( \newcommand{\kernel}{\mathrm{null}\,}\) \( \newcommand{\range}{\mathrm{range}\,}\)
\( \newcommand{\RealPart}{\mathrm{Re}}\) \( \newcommand{\ImaginaryPart}{\mathrm{Im}}\)
\( \newcommand{\Argument}{\mathrm{Arg}}\) \( \newcommand{\norm}[1]{\| #1 \|}\)
\( \newcommand{\inner}[2]{\langle #1, #2 \rangle}\)
\( \newcommand{\Span}{\mathrm{span}}\)
\( \newcommand{\id}{\mathrm{id}}\)
\( \newcommand{\Span}{\mathrm{span}}\)
\( \newcommand{\kernel}{\mathrm{null}\,}\)
\( \newcommand{\range}{\mathrm{range}\,}\)
\( \newcommand{\RealPart}{\mathrm{Re}}\)
\( \newcommand{\ImaginaryPart}{\mathrm{Im}}\)
\( \newcommand{\Argument}{\mathrm{Arg}}\)
\( \newcommand{\norm}[1]{\| #1 \|}\)
\( \newcommand{\inner}[2]{\langle #1, #2 \rangle}\)
\( \newcommand{\Span}{\mathrm{span}}\) \( \newcommand{\AA}{\unicode[.8,0]{x212B}}\)
\( \newcommand{\vectorA}[1]{\vec{#1}} % arrow\)
\( \newcommand{\vectorAt}[1]{\vec{\text{#1}}} % arrow\)
\( \newcommand{\vectorB}[1]{\overset { \scriptstyle \rightharpoonup} {\mathbf{#1}} } \)
\( \newcommand{\vectorC}[1]{\textbf{#1}} \)
\( \newcommand{\vectorD}[1]{\overrightarrow{#1}} \)
\( \newcommand{\vectorDt}[1]{\overrightarrow{\text{#1}}} \)
\( \newcommand{\vectE}[1]{\overset{-\!-\!\rightharpoonup}{\vphantom{a}\smash{\mathbf {#1}}}} \)
\( \newcommand{\vecs}[1]{\overset { \scriptstyle \rightharpoonup} {\mathbf{#1}} } \)
\(\newcommand{\longvect}{\overrightarrow}\)
\( \newcommand{\vecd}[1]{\overset{-\!-\!\rightharpoonup}{\vphantom{a}\smash {#1}}} \)
\(\newcommand{\avec}{\mathbf a}\) \(\newcommand{\bvec}{\mathbf b}\) \(\newcommand{\cvec}{\mathbf c}\) \(\newcommand{\dvec}{\mathbf d}\) \(\newcommand{\dtil}{\widetilde{\mathbf d}}\) \(\newcommand{\evec}{\mathbf e}\) \(\newcommand{\fvec}{\mathbf f}\) \(\newcommand{\nvec}{\mathbf n}\) \(\newcommand{\pvec}{\mathbf p}\) \(\newcommand{\qvec}{\mathbf q}\) \(\newcommand{\svec}{\mathbf s}\) \(\newcommand{\tvec}{\mathbf t}\) \(\newcommand{\uvec}{\mathbf u}\) \(\newcommand{\vvec}{\mathbf v}\) \(\newcommand{\wvec}{\mathbf w}\) \(\newcommand{\xvec}{\mathbf x}\) \(\newcommand{\yvec}{\mathbf y}\) \(\newcommand{\zvec}{\mathbf z}\) \(\newcommand{\rvec}{\mathbf r}\) \(\newcommand{\mvec}{\mathbf m}\) \(\newcommand{\zerovec}{\mathbf 0}\) \(\newcommand{\onevec}{\mathbf 1}\) \(\newcommand{\real}{\mathbb R}\) \(\newcommand{\twovec}[2]{\left[\begin{array}{r}#1 \\ #2 \end{array}\right]}\) \(\newcommand{\ctwovec}[2]{\left[\begin{array}{c}#1 \\ #2 \end{array}\right]}\) \(\newcommand{\threevec}[3]{\left[\begin{array}{r}#1 \\ #2 \\ #3 \end{array}\right]}\) \(\newcommand{\cthreevec}[3]{\left[\begin{array}{c}#1 \\ #2 \\ #3 \end{array}\right]}\) \(\newcommand{\fourvec}[4]{\left[\begin{array}{r}#1 \\ #2 \\ #3 \\ #4 \end{array}\right]}\) \(\newcommand{\cfourvec}[4]{\left[\begin{array}{c}#1 \\ #2 \\ #3 \\ #4 \end{array}\right]}\) \(\newcommand{\fivevec}[5]{\left[\begin{array}{r}#1 \\ #2 \\ #3 \\ #4 \\ #5 \\ \end{array}\right]}\) \(\newcommand{\cfivevec}[5]{\left[\begin{array}{c}#1 \\ #2 \\ #3 \\ #4 \\ #5 \\ \end{array}\right]}\) \(\newcommand{\mattwo}[4]{\left[\begin{array}{rr}#1 \amp #2 \\ #3 \amp #4 \\ \end{array}\right]}\) \(\newcommand{\laspan}[1]{\text{Span}\{#1\}}\) \(\newcommand{\bcal}{\cal B}\) \(\newcommand{\ccal}{\cal C}\) \(\newcommand{\scal}{\cal S}\) \(\newcommand{\wcal}{\cal W}\) \(\newcommand{\ecal}{\cal E}\) \(\newcommand{\coords}[2]{\left\{#1\right\}_{#2}}\) \(\newcommand{\gray}[1]{\color{gray}{#1}}\) \(\newcommand{\lgray}[1]{\color{lightgray}{#1}}\) \(\newcommand{\rank}{\operatorname{rank}}\) \(\newcommand{\row}{\text{Row}}\) \(\newcommand{\col}{\text{Col}}\) \(\renewcommand{\row}{\text{Row}}\) \(\newcommand{\nul}{\text{Nul}}\) \(\newcommand{\var}{\text{Var}}\) \(\newcommand{\corr}{\text{corr}}\) \(\newcommand{\len}[1]{\left|#1\right|}\) \(\newcommand{\bbar}{\overline{\bvec}}\) \(\newcommand{\bhat}{\widehat{\bvec}}\) \(\newcommand{\bperp}{\bvec^\perp}\) \(\newcommand{\xhat}{\widehat{\xvec}}\) \(\newcommand{\vhat}{\widehat{\vvec}}\) \(\newcommand{\uhat}{\widehat{\uvec}}\) \(\newcommand{\what}{\widehat{\wvec}}\) \(\newcommand{\Sighat}{\widehat{\Sigma}}\) \(\newcommand{\lt}{<}\) \(\newcommand{\gt}{>}\) \(\newcommand{\amp}{&}\) \(\definecolor{fillinmathshade}{gray}{0.9}\)Purpose: The purpose of this exercise is to experimentally estimate the molar extinction coefficient of gold nanoparticles and determine what effect size has on the magnitude of the coefficient.
Learning Outcomes:
At the end of this assignment you will be able to:
- Select the appropriate wavelength to collect spectra of gold nanoparticles.
- Evaluate the molar extinction coefficient of different nanoparticle preparations by applying the Lambert-Beer law.
- Determine experimentally the effect that size plays on the magnitude of the molar extinction coefficient.
Gold nanoparticles display very intense colors in the visible range. As seen in Figure 2, color varies from deep red to blue depending on size and state of aggregation. These unique optical properties are due to a phenomenon called Surface Plasmon Resonance (SPR) (12). At specific wavelengths the collective oscillation of electrons on the surface of the particle results in strong absorption (and scattering) which means that the color generated by the particle can be seen at very small concentrations. For this reason, gold nanoparticles are widely used for the development of colorimetric sensors. In order to ensure maximum sensitivity in colorimetric detection, it is important to use gold nanoparticles with high molar extinction coefficients.
Because nanoparticles appear colorful, this means that they are absorbing specific wavelengths of light while reflecting others. This property makes them excellent candidates for spectrophotometric analysis. As explained earlier in the module, a spectrophotometric analysis is performed by illuminating the sample with radiation in the visible or ultraviolet range and detecting the amount of light that reaches the detector. Depending on the chemical properties of the species in the sample, some light will be absorbed while the remainder will be transmitted to the detector where it is converted to an electrical signal that is proportional to the amount of light absorbed, called the absorbance. By constructing a standard calibration curve using known concentrations of nanoparticles under investigation, a relationship can be developed between the absorbance of the analyte at a specific wavelength and its concentration. If the nanoparticle concentration is expressed in molarity, the slope of that plot is the molar extinction coefficient.
An example of visible spectra recorded on gold nanoparticles synthesized using a citrate to tetrachloroauric acid ratio of 2:1 and pH ranging from 4.2 to 7.0 is shown in Figure 6.
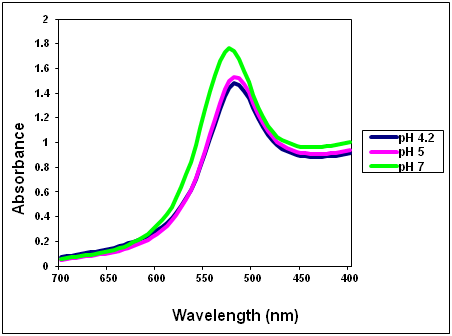
Figure 6. Visible spectra recorded on gold nanoparticles synthesized using a citrate to tetrachloroauric acid ratio of 2:1 and pH ranging from 4.2 to 7.0.
Q26. At what wavelength does each nanoparticle solution exhibit the maximum absorbance? This wavelength is referred to as λmax.
Q27. What wavelength would you choose to quantitatively determine the concentration of the nanoparticles? Why did you choose this wavelength?
Q28. What is the value of the absorbance at λmax for each nanoparticle solution? Complete Table 5 by reporting the nanoparticle concentration from Table 4 and λmax estimated from the spectra found in the link to the experimental data.
Table 5. Summary of experimental results – complete this table by reporting the nanoparticle concentration from Table 4 and the value of λmax
|
Citrate/Au |
pH |
Particle |
Nanoparticle concentration (M) |
λmax (nm) |
|---|---|---|---|---|
|
2.0:1 |
4.2 |
20.00 ± 0.50 |
520 |
|
|
5.4 |
21.73 ± 0.40 |
3.16 x 10⁻⁹ |
520 |
|
|
7.0 |
21.22 ± 1.00 |
525 |
||
|
4.0:1 |
4.2 |
23.30 ± 0.78 |
||
|
5.4 |
26.52 ± 1.57 |
|||
|
7.0 |
26.76 ± 0.99 |
|||
|
7.0:1 |
4.2 |
31.87 ± 2.45 |
||
|
5.4 |
33.91 ± 4.25 |
|||
|
7.0 |
No particles formed |
Q29. How could you use a plot of absorbance vs. concentration at the wavelength chosen above to determine the molar extinction coefficient of a gold nanoparticle solution?