
Error and Statistics
- Page ID
- 279685

\( \newcommand{\vecs}[1]{\overset { \scriptstyle \rightharpoonup} {\mathbf{#1}} } \) \( \newcommand{\vecd}[1]{\overset{-\!-\!\rightharpoonup}{\vphantom{a}\smash {#1}}} \)\(\newcommand{\id}{\mathrm{id}}\) \( \newcommand{\Span}{\mathrm{span}}\) \( \newcommand{\kernel}{\mathrm{null}\,}\) \( \newcommand{\range}{\mathrm{range}\,}\) \( \newcommand{\RealPart}{\mathrm{Re}}\) \( \newcommand{\ImaginaryPart}{\mathrm{Im}}\) \( \newcommand{\Argument}{\mathrm{Arg}}\) \( \newcommand{\norm}[1]{\| #1 \|}\) \( \newcommand{\inner}[2]{\langle #1, #2 \rangle}\) \( \newcommand{\Span}{\mathrm{span}}\) \(\newcommand{\id}{\mathrm{id}}\) \( \newcommand{\Span}{\mathrm{span}}\) \( \newcommand{\kernel}{\mathrm{null}\,}\) \( \newcommand{\range}{\mathrm{range}\,}\) \( \newcommand{\RealPart}{\mathrm{Re}}\) \( \newcommand{\ImaginaryPart}{\mathrm{Im}}\) \( \newcommand{\Argument}{\mathrm{Arg}}\) \( \newcommand{\norm}[1]{\| #1 \|}\) \( \newcommand{\inner}[2]{\langle #1, #2 \rangle}\) \( \newcommand{\Span}{\mathrm{span}}\)\(\newcommand{\AA}{\unicode[.8,0]{x212B}}\)
Weighing Pennies: In Class Questions
- Suppose you are asked to weigh a group of 100 pennies. As a group, list anything you can think of that may contribute to variations in the mass as determined using an analytical balance. Be sure to consider environmental conditions and experimental setup in addition to differences between the samples.
- Look back at your list from question 1 and determine which items listed could be considered “error.”
- Which items listed are systematic errors?
- Which items listed are random errors?
- What is a “human error”? Which items listed could be categorized as human errors?
- Summarize the effect of a systematic error on the data. Draw 2 Gaussian curves to illustrate the data with and without systematic error.
- Summarize the effect of random error on the data. Draw 2 Gaussian curves to illustrate the data with and without random error.
- Is random error always present? Explain why or why not.
- Referring back to your list from question 1, which errors would require you to discard data and start over? Are these systematic or random errors?
Given the data in the table below, answer the following questions:
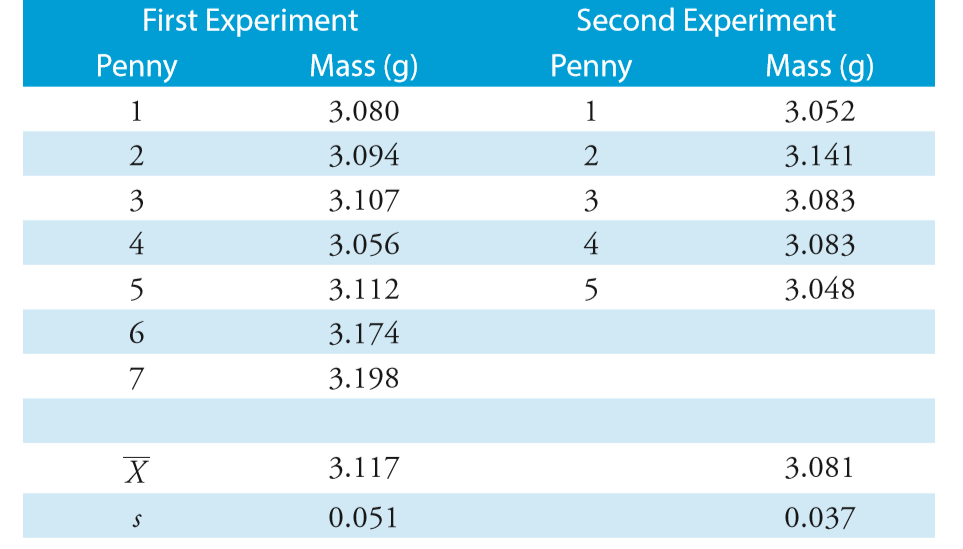
Table 1. Results from two determinations of the mass of a circulating United States Penny. (from Harvey, D. Analytical Chemistry 2.1.)
- Determine whether there is a difference in the means of these analyses at α = 0.05, assuming the standard deviations can be pooled.
- What are the 95% confidence intervals for the two samples of pennies in the table above?
- A sample of 100 pennies has a mean and standard deviation of 3.095 g and 0.0346 g, respectively. What is the 95% confidence interval for the sample of 100 pennies? Compare your result to the confidence intervals for the samples of pennies.
References:
- Harvey, D. Analytical Chemistry 2.1, 2016. (http://dpuadweb.depauw.edu/harvey_we...rsion_2.1.html)
Contributors and Attributions
- Rebecca Hunter, The Citadel (rhunter1@citadel.edu)