
4.4: UV-Visible Spectroscopy
- Page ID
- 55881

Ultraviolet-visible (UV-vis) spectroscopy is used to obtain the absorbance spectra of a compound in solution or as a solid. What is actually being observed spectroscopically is the absorbance of light energy or electromagnetic radiation, which excites electrons from the ground state to the first singlet excited state of the compound or material. The UV-vis region of energy for the electromagnetic spectrum covers 1.5 - 6.2 eV which relates to a wavelength range of 800 - 200 nm. The Beer-Lambert Law, Equation \ref{1} , is the principle behind absorbance spectroscopy. For a single wavelength, A is absorbance (unitless, usually seen as arb. units or arbitrary units), ε is the molar absorptivity of the compound or molecule in solution (M-1cm-1), b is the path length of the cuvette or sample holder (usually 1 cm), and c is the concentration of the solution (M).
\[ A\ =\ \varepsilon b c \label{1} \]
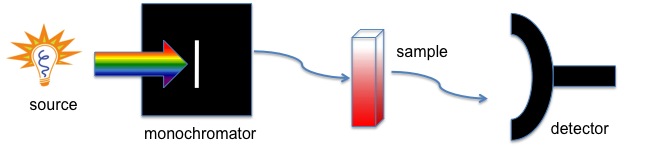
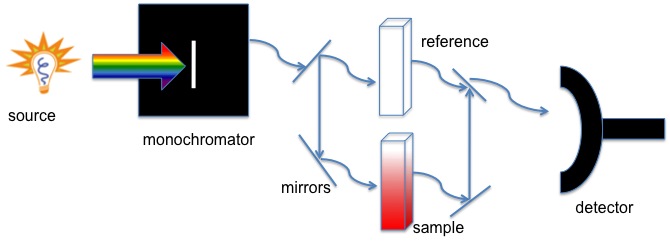
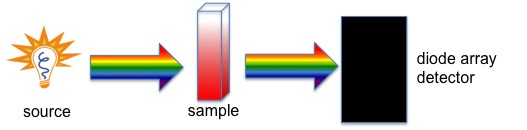
All of these instruments have a light source (usually a deuterium or tungsten lamp), a sample holder and a detector, but some have a filter for selecting one wavelength at a time. The single beam instrument (Figure \(\PageIndex{1}\)) has a filter or a monochromator between the source and the sample to analyze one wavelength at a time. The double beam instrument (Figure \(\PageIndex{2}\)) has a single source and a monochromator and then there is a splitter and a series of mirrors to get the beam to a reference sample and the sample to be analyzed, this allows for more accurate readings. In contrast, the simultaneous instrument (Figure \(\PageIndex{3}\)) does not have a monochromator between the sample and the source; instead, it has a diode array detector that allows the instrument to simultaneously detect the absorbance at all wavelengths. The simultaneous instrument is usually much faster and more efficient, but all of these types of spectrometers work well.
What Information can be Obtained from UV-vis Spectra?
UV-vis spectroscopic data can give qualitative and quantitative information of a given compound or molecule. Irrespective of whether quantitative or qualitative information is required it is important to use a reference cell to zero the instrument for the solvent the compound is in. For quantitative information on the compound, calibrating the instrument using known concentrations of the compound in question in a solution with the same solvent as the unknown sample would be required. If the information needed is just proof that a compound is in the sample being analyzed, a calibration curve will not be necessary; however, if a degradation study or reaction is being performed, and concentration of the compound in solution is required, thus a calibration curve is needed.
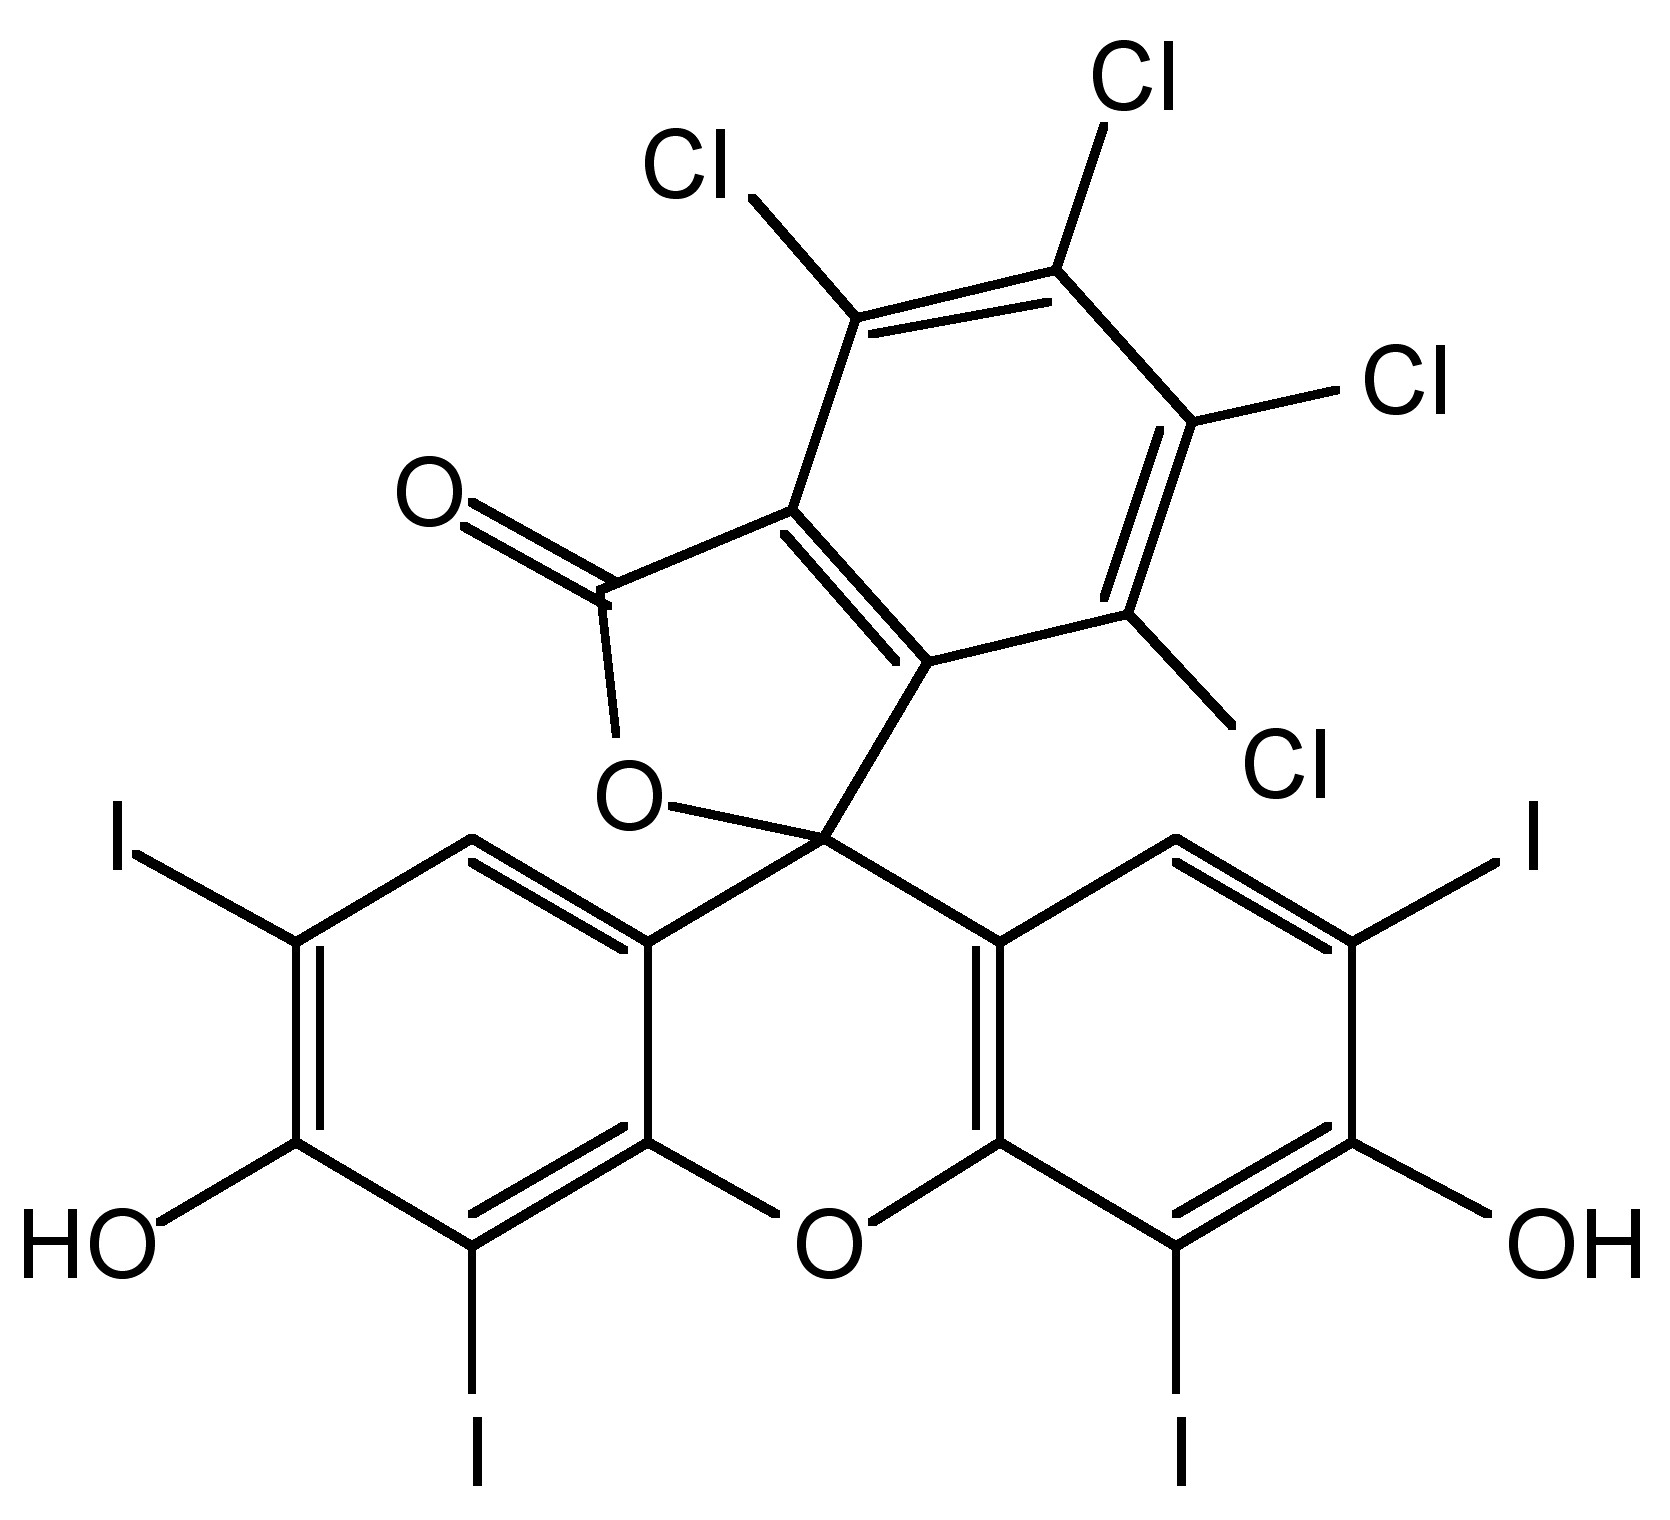
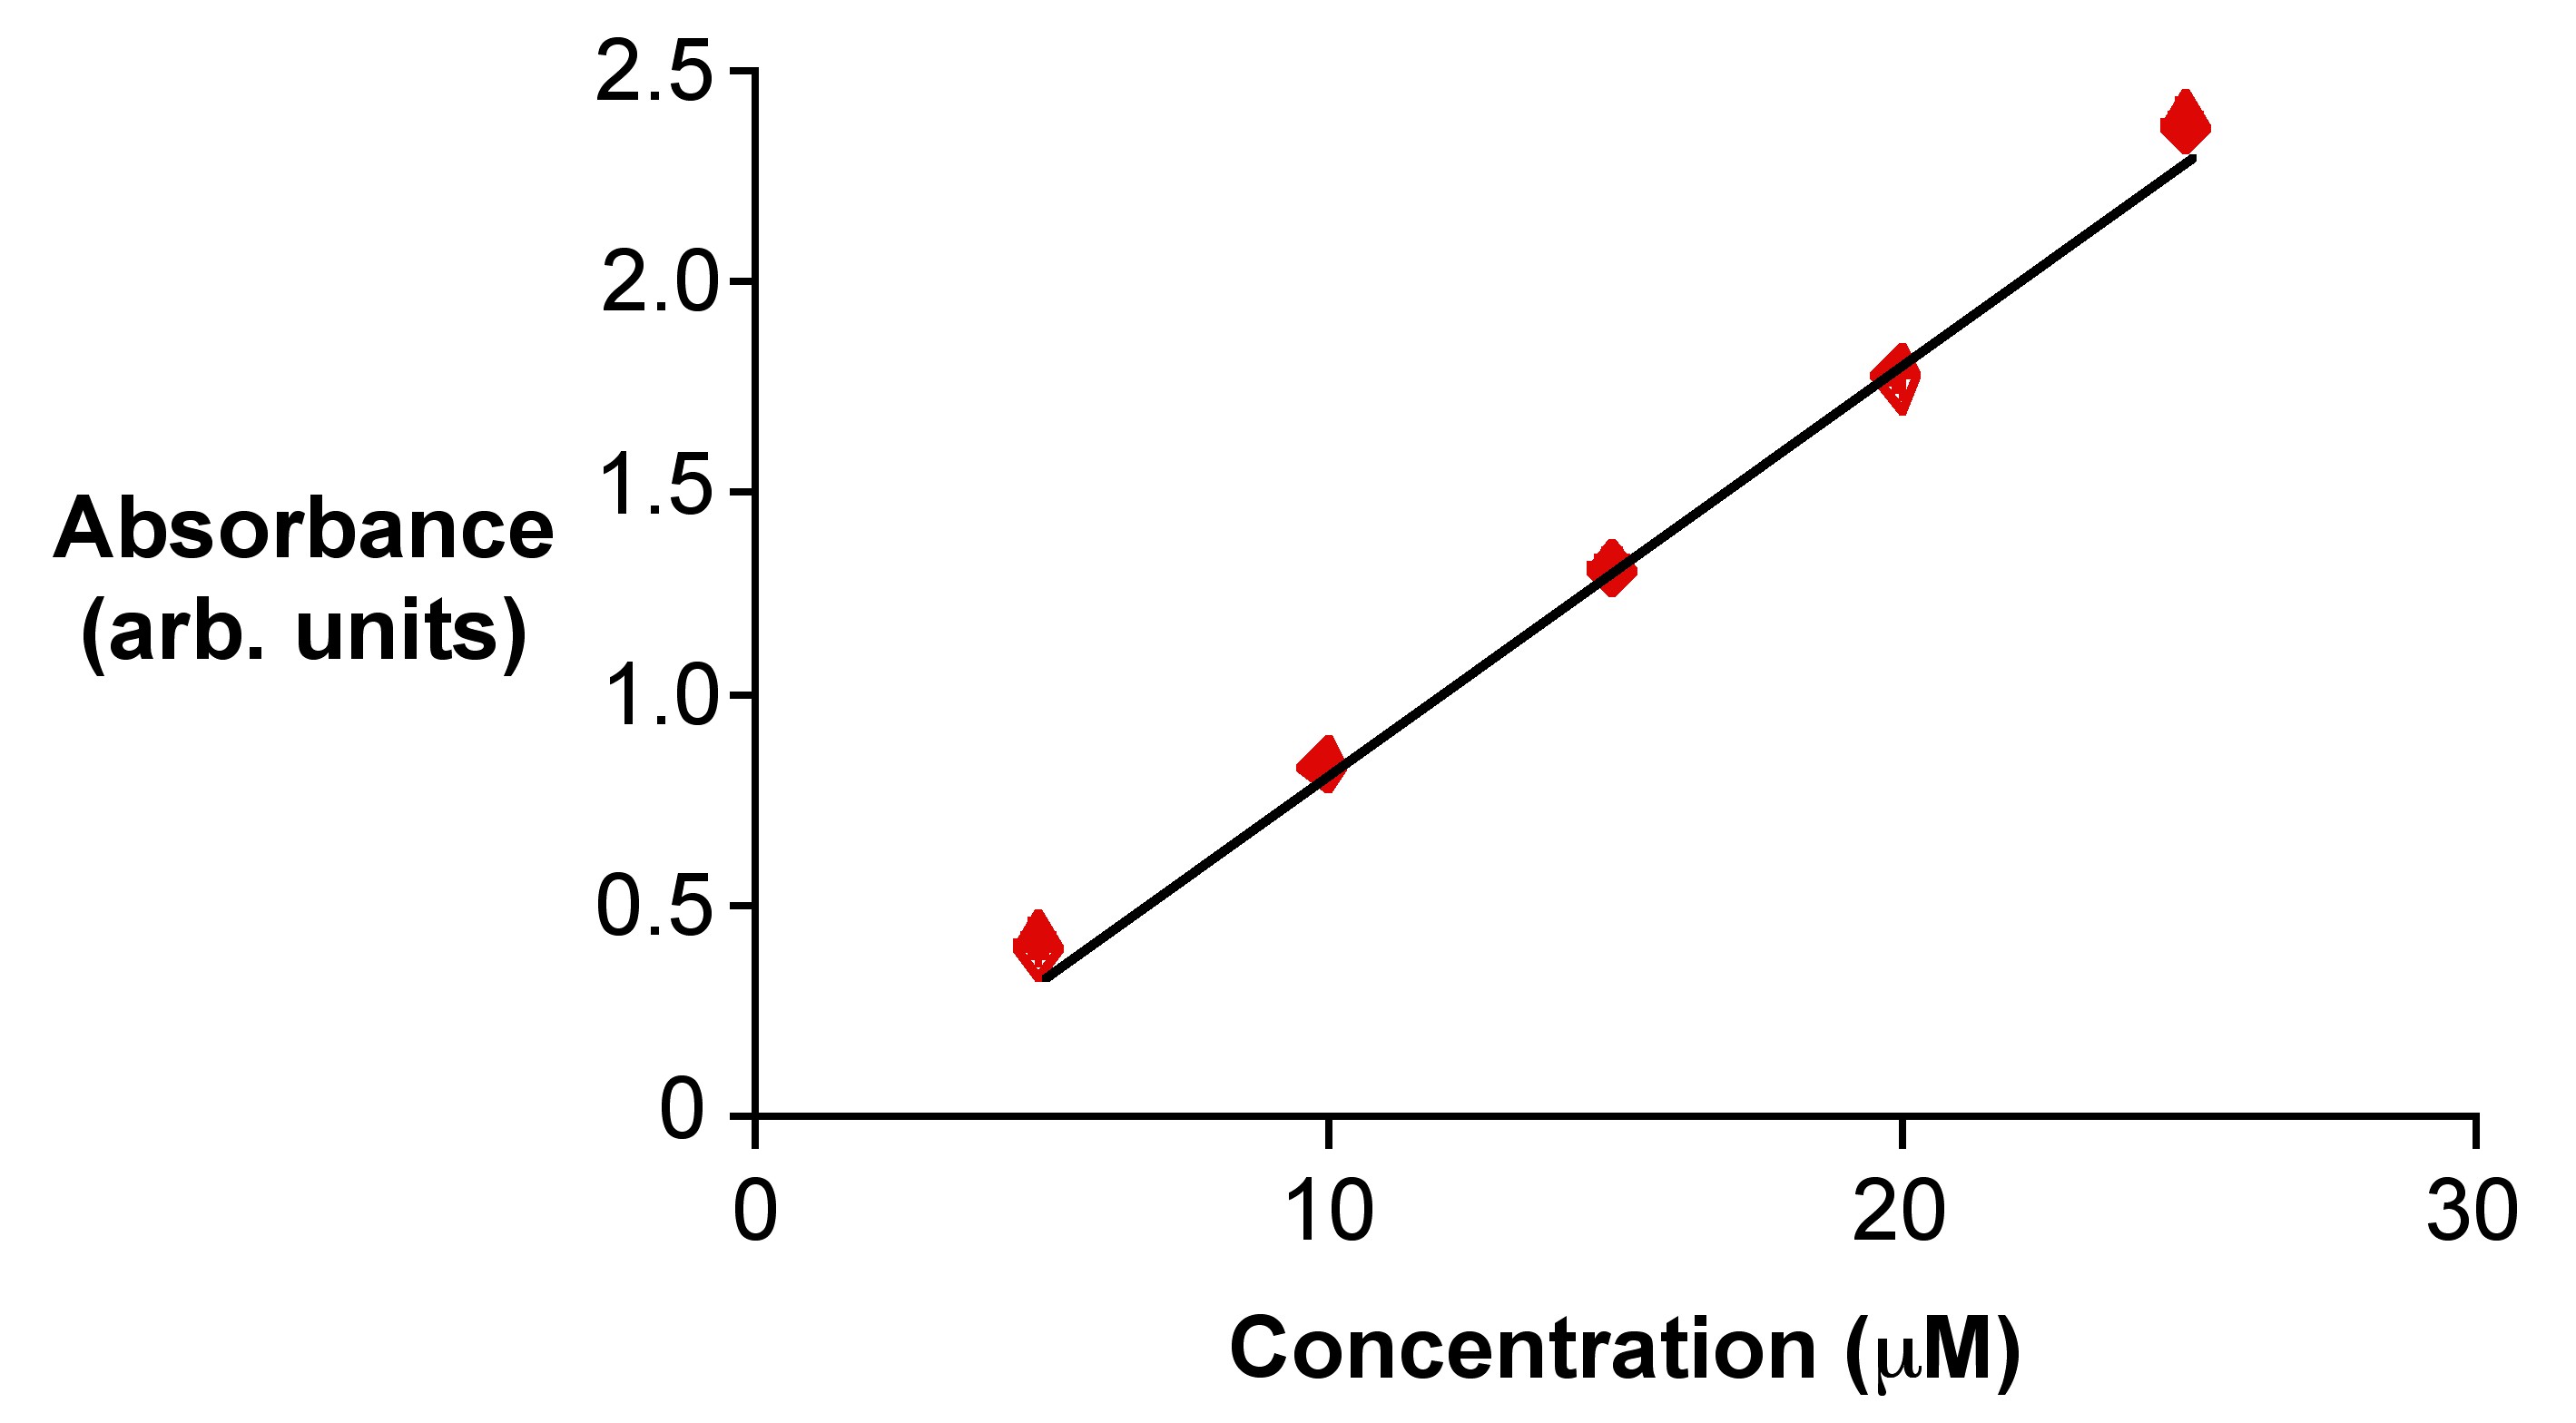
To make a calibration curve, at least three concentrations of the compound will be needed, but five concentrations would be most ideal for a more accurate curve. The concentrations should start at just above the estimated concentration of the unknown sample and should go down to about an order of magnitude lower than the highest concentration. The calibration solutions should be spaced relatively equally apart, and they should be made as accurately as possible using digital pipettes and volumetric flasks instead of graduated cylinders and beakers. An example of absorbance spectra of calibration solutions of Rose Bengal (4,5,6,7-tetrachloro-2',4',5',7'-tetraiodofluorescein, Figure \(\PageIndex{4}\), can be seen in Figure \(\PageIndex{5}\). To make a calibration curve, the value for the absorbances of each of the spectral curves at the highest absorbing wavelength, is plotted in a graph similar to that in Figure \(\PageIndex{6}\) of absorbance versus concentration. The correlation coefficient of an acceptable calibration is 0.9 or better. If the correlation coefficient is lower than that, try making the solutions again as the problem may be human error. However, if after making the solutions a few times the calibration is still poor, something may be wrong with the instrument; for example, the lamps may be going bad.

Limitations of UV-vis Spectroscopy
Sample
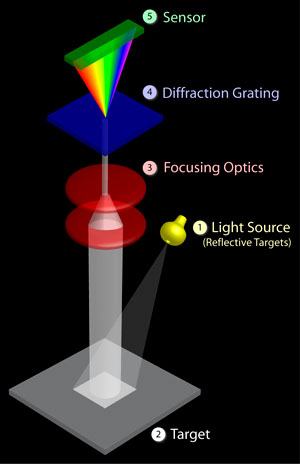
UV-vis spectroscopy works well on liquids and solutions, but if the sample is more of a suspension of solid particles in liquid, the sample will scatter the light more than absorb the light and the data will be very skewed. Most UV-vis instruments can analyze solid samples or suspensions with a diffraction apparatus (Figure \(\PageIndex{7}\)), but this is not common. UV-vis instruments generally analyze liquids and solutions most efficiently.
Calibration and Reference
A blank reference will be needed at the very beginning of the analysis of the solvent to be used (water, hexanes, etc), and if concentration analysis needs to be performed, calibration solutions need to be made accurately. If the solutions are not made accurately enough, the actual concentration of the sample in question will not be accurately determined.
Choice of Solvent or Container
Every solvent has a UV-vis absorbance cutoff wavelength. The solvent cutoff is the wavelength below which the solvent itself absorbs all of the light. So when choosing a solvent be aware of its absorbance cutoff and where the compound under investigation is thought to absorb. If they are close, chose a different solvent. Table \(\PageIndex{1}\) provides an example of solvent cutoffs.
| Solvent | UV Absorbance Cutoff (nm) |
|---|---|
| Acetone | 329 |
| Benzene | 278 |
| Dimethylformamide | 267 |
| Ethanol | 205 |
| Toluene | 285 |
| Water | 180 |
The material the cuvette (the sample holder) is made from will also have a UV-vis absorbance cutoff. Glass will absorb all of the light higher in energy starting at about 300 nm, so if the sample absorbs in the UV, a quartz cuvette will be more practical as the absorbance cutoff is around 160 nm for quartz (Table \(\PageIndex{2}\)).
| Material | Wavelength Range (nm) |
|---|---|
| Glass | 380-780 |
| Plastic | 380-780 |
| Fused Quartz | < 380 |
Concentration of Solution
To obtain reliable data, the peak of absorbance of a given compound needs to be at least three times higher in intensity than the background noise of the instrument. Obviously using higher concentrations of the compound in solution can combat this. Also, if the sample is very small and diluting it would not give an acceptable signal, there are cuvettes that hold smaller sample sizes than the 2.5 mL of a standard cuvettes. Some cuvettes are made to hold only 100 μL, which would allow for a small sample to be analyzed without having to dilute it to a larger volume, lowering the signal to noise ratio.