
3.4: Excitation and Emission Spectra
- Page ID
- 111547

\( \newcommand{\vecs}[1]{\overset { \scriptstyle \rightharpoonup} {\mathbf{#1}} } \)
\( \newcommand{\vecd}[1]{\overset{-\!-\!\rightharpoonup}{\vphantom{a}\smash {#1}}} \)
\( \newcommand{\id}{\mathrm{id}}\) \( \newcommand{\Span}{\mathrm{span}}\)
( \newcommand{\kernel}{\mathrm{null}\,}\) \( \newcommand{\range}{\mathrm{range}\,}\)
\( \newcommand{\RealPart}{\mathrm{Re}}\) \( \newcommand{\ImaginaryPart}{\mathrm{Im}}\)
\( \newcommand{\Argument}{\mathrm{Arg}}\) \( \newcommand{\norm}[1]{\| #1 \|}\)
\( \newcommand{\inner}[2]{\langle #1, #2 \rangle}\)
\( \newcommand{\Span}{\mathrm{span}}\)
\( \newcommand{\id}{\mathrm{id}}\)
\( \newcommand{\Span}{\mathrm{span}}\)
\( \newcommand{\kernel}{\mathrm{null}\,}\)
\( \newcommand{\range}{\mathrm{range}\,}\)
\( \newcommand{\RealPart}{\mathrm{Re}}\)
\( \newcommand{\ImaginaryPart}{\mathrm{Im}}\)
\( \newcommand{\Argument}{\mathrm{Arg}}\)
\( \newcommand{\norm}[1]{\| #1 \|}\)
\( \newcommand{\inner}[2]{\langle #1, #2 \rangle}\)
\( \newcommand{\Span}{\mathrm{span}}\) \( \newcommand{\AA}{\unicode[.8,0]{x212B}}\)
\( \newcommand{\vectorA}[1]{\vec{#1}} % arrow\)
\( \newcommand{\vectorAt}[1]{\vec{\text{#1}}} % arrow\)
\( \newcommand{\vectorB}[1]{\overset { \scriptstyle \rightharpoonup} {\mathbf{#1}} } \)
\( \newcommand{\vectorC}[1]{\textbf{#1}} \)
\( \newcommand{\vectorD}[1]{\overrightarrow{#1}} \)
\( \newcommand{\vectorDt}[1]{\overrightarrow{\text{#1}}} \)
\( \newcommand{\vectE}[1]{\overset{-\!-\!\rightharpoonup}{\vphantom{a}\smash{\mathbf {#1}}}} \)
\( \newcommand{\vecs}[1]{\overset { \scriptstyle \rightharpoonup} {\mathbf{#1}} } \)
\( \newcommand{\vecd}[1]{\overset{-\!-\!\rightharpoonup}{\vphantom{a}\smash {#1}}} \)
\(\newcommand{\avec}{\mathbf a}\) \(\newcommand{\bvec}{\mathbf b}\) \(\newcommand{\cvec}{\mathbf c}\) \(\newcommand{\dvec}{\mathbf d}\) \(\newcommand{\dtil}{\widetilde{\mathbf d}}\) \(\newcommand{\evec}{\mathbf e}\) \(\newcommand{\fvec}{\mathbf f}\) \(\newcommand{\nvec}{\mathbf n}\) \(\newcommand{\pvec}{\mathbf p}\) \(\newcommand{\qvec}{\mathbf q}\) \(\newcommand{\svec}{\mathbf s}\) \(\newcommand{\tvec}{\mathbf t}\) \(\newcommand{\uvec}{\mathbf u}\) \(\newcommand{\vvec}{\mathbf v}\) \(\newcommand{\wvec}{\mathbf w}\) \(\newcommand{\xvec}{\mathbf x}\) \(\newcommand{\yvec}{\mathbf y}\) \(\newcommand{\zvec}{\mathbf z}\) \(\newcommand{\rvec}{\mathbf r}\) \(\newcommand{\mvec}{\mathbf m}\) \(\newcommand{\zerovec}{\mathbf 0}\) \(\newcommand{\onevec}{\mathbf 1}\) \(\newcommand{\real}{\mathbb R}\) \(\newcommand{\twovec}[2]{\left[\begin{array}{r}#1 \\ #2 \end{array}\right]}\) \(\newcommand{\ctwovec}[2]{\left[\begin{array}{c}#1 \\ #2 \end{array}\right]}\) \(\newcommand{\threevec}[3]{\left[\begin{array}{r}#1 \\ #2 \\ #3 \end{array}\right]}\) \(\newcommand{\cthreevec}[3]{\left[\begin{array}{c}#1 \\ #2 \\ #3 \end{array}\right]}\) \(\newcommand{\fourvec}[4]{\left[\begin{array}{r}#1 \\ #2 \\ #3 \\ #4 \end{array}\right]}\) \(\newcommand{\cfourvec}[4]{\left[\begin{array}{c}#1 \\ #2 \\ #3 \\ #4 \end{array}\right]}\) \(\newcommand{\fivevec}[5]{\left[\begin{array}{r}#1 \\ #2 \\ #3 \\ #4 \\ #5 \\ \end{array}\right]}\) \(\newcommand{\cfivevec}[5]{\left[\begin{array}{c}#1 \\ #2 \\ #3 \\ #4 \\ #5 \\ \end{array}\right]}\) \(\newcommand{\mattwo}[4]{\left[\begin{array}{rr}#1 \amp #2 \\ #3 \amp #4 \\ \end{array}\right]}\) \(\newcommand{\laspan}[1]{\text{Span}\{#1\}}\) \(\newcommand{\bcal}{\cal B}\) \(\newcommand{\ccal}{\cal C}\) \(\newcommand{\scal}{\cal S}\) \(\newcommand{\wcal}{\cal W}\) \(\newcommand{\ecal}{\cal E}\) \(\newcommand{\coords}[2]{\left\{#1\right\}_{#2}}\) \(\newcommand{\gray}[1]{\color{gray}{#1}}\) \(\newcommand{\lgray}[1]{\color{lightgray}{#1}}\) \(\newcommand{\rank}{\operatorname{rank}}\) \(\newcommand{\row}{\text{Row}}\) \(\newcommand{\col}{\text{Col}}\) \(\renewcommand{\row}{\text{Row}}\) \(\newcommand{\nul}{\text{Nul}}\) \(\newcommand{\var}{\text{Var}}\) \(\newcommand{\corr}{\text{corr}}\) \(\newcommand{\len}[1]{\left|#1\right|}\) \(\newcommand{\bbar}{\overline{\bvec}}\) \(\newcommand{\bhat}{\widehat{\bvec}}\) \(\newcommand{\bperp}{\bvec^\perp}\) \(\newcommand{\xhat}{\widehat{\xvec}}\) \(\newcommand{\vhat}{\widehat{\vvec}}\) \(\newcommand{\uhat}{\widehat{\uvec}}\) \(\newcommand{\what}{\widehat{\wvec}}\) \(\newcommand{\Sighat}{\widehat{\Sigma}}\) \(\newcommand{\lt}{<}\) \(\newcommand{\gt}{>}\) \(\newcommand{\amp}{&}\) \(\definecolor{fillinmathshade}{gray}{0.9}\)What would be the difference between an excitation and emission spectrum in fluorescence spectroscopy?
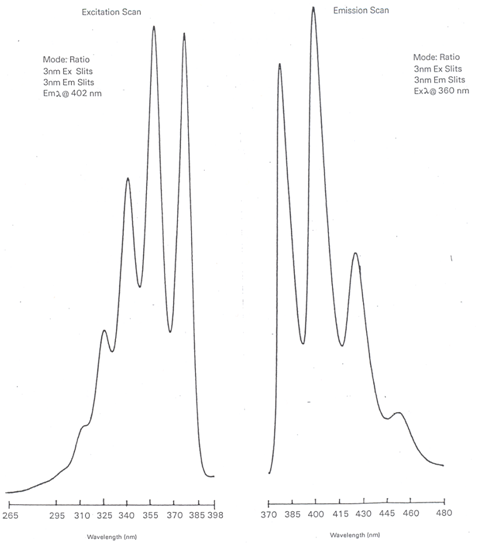
In an excitation spectrum, the emission monochromator is set to some wavelength where the sample is known to emit radiation and the excitation monochromator is scanned through the different wavelengths. The excitation spectrum will look similar if not identical to the absorption spectrum obtained in UV/VIS spectroscopy.
In an emission spectrum, the excitation monochromator is set to some wavelength known to excite the sample and the emission monochromator is scanned through the different wavelengths.
Draw representative examples of the excitation and emission spectrum for a molecule.
The important point to realize is that the only peak that overlaps between the excitation and emission spectrum is the S0-S1 transition. Otherwise, all the excitation peaks occur at higher frequencies or shorter wavelengths and all of the emission peaks occur at lower frequencies or longer wavelengths. The spectra in Figure \(\PageIndex{6}\) show the excitation and emission spectra of anthracene. Note that the only overlap occurs at 380 nm, which corresponds to the S0-S1 transition.
Describe a way to measure the phosphorescence spectrum of a species that is not compromised by the presence of any fluorescence emission.
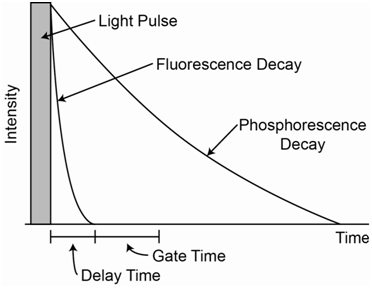
The important thing to consider in addressing this question is that the lifetime of the S1 state from which fluorescence occurs is approximately 10-8 second whereas the lifetime of the T1 state from which phosphorescence occurs is on the order of 10-4 to 100 seconds. Because of these different lifetimes, fluorescence emission will decay away rather quickly while phosphorescence emission will decay away more slowly. The diagram in Figure \(\PageIndex{7}\) shows representations for the decay of fluorescence versus phosphorescence as a function of time if the radiation source was turned off. The two can be distinguished by using a pulsed source. A pulsed source is turned on for a brief instant and then turned off. Many fluorescent spectrophotometers use a pulsed source. The electronics on the detector can be coordinated with the source pulsing. When measuring fluorescence, the detector reads signal when the pulse is on. When measuring phosphorescence, a delay time during which the detector is turned off occurs after the pulse ends. Then the detector is turned on for some period of time, which is referred to as the gate time. Figure \(\PageIndex{7}\) also shows where the delay and gate times might be set for the sample represented in the decay curves. The proper gate time depends in part on how slow the phosphorescence decays. You want a reasonable length of time to measure enough signal, but if the gate time is too long and weak to no phosphorescence occurs at the end, the detector is mostly measuring noise and the signal-to-noise ratio will be reduced.
If performing quantitative analysis in fluorescence spectroscopy, which wavelengths would you select from the spectra you drew in the problem above?
The two best wavelengths would be those that produced the maximum signal on the excitation and emission spectra. That will lead to the most sensitivity and lowest detection limits in the analysis. For the spectra of anthracene drawn in Figure \(\PageIndex{6}\), that would correspond to an excitation wavelength of 360 nm and emission wavelength of 402 nm. The one exception is if the S0-S1 transition is the maximum on both spectra, which would mean having the excitation and emission monochromators set to the same wavelength. The problem that occurs here is that the excitation beam of radiation will always exhibit some scatter as it passes through the sample. Scattered radiation appears in all directions and the detector has no way to distinguish this from fluorescence. Usually the excitation and emission wavelengths must be offset by some suitable value (often 30 nm) to keep the scatter to acceptable levels.