
20.4: Applications of Molecular Mass Spectrometry
- Page ID
- 391123

\( \newcommand{\vecs}[1]{\overset { \scriptstyle \rightharpoonup} {\mathbf{#1}} } \)
\( \newcommand{\vecd}[1]{\overset{-\!-\!\rightharpoonup}{\vphantom{a}\smash {#1}}} \)
\( \newcommand{\id}{\mathrm{id}}\) \( \newcommand{\Span}{\mathrm{span}}\)
( \newcommand{\kernel}{\mathrm{null}\,}\) \( \newcommand{\range}{\mathrm{range}\,}\)
\( \newcommand{\RealPart}{\mathrm{Re}}\) \( \newcommand{\ImaginaryPart}{\mathrm{Im}}\)
\( \newcommand{\Argument}{\mathrm{Arg}}\) \( \newcommand{\norm}[1]{\| #1 \|}\)
\( \newcommand{\inner}[2]{\langle #1, #2 \rangle}\)
\( \newcommand{\Span}{\mathrm{span}}\)
\( \newcommand{\id}{\mathrm{id}}\)
\( \newcommand{\Span}{\mathrm{span}}\)
\( \newcommand{\kernel}{\mathrm{null}\,}\)
\( \newcommand{\range}{\mathrm{range}\,}\)
\( \newcommand{\RealPart}{\mathrm{Re}}\)
\( \newcommand{\ImaginaryPart}{\mathrm{Im}}\)
\( \newcommand{\Argument}{\mathrm{Arg}}\)
\( \newcommand{\norm}[1]{\| #1 \|}\)
\( \newcommand{\inner}[2]{\langle #1, #2 \rangle}\)
\( \newcommand{\Span}{\mathrm{span}}\) \( \newcommand{\AA}{\unicode[.8,0]{x212B}}\)
\( \newcommand{\vectorA}[1]{\vec{#1}} % arrow\)
\( \newcommand{\vectorAt}[1]{\vec{\text{#1}}} % arrow\)
\( \newcommand{\vectorB}[1]{\overset { \scriptstyle \rightharpoonup} {\mathbf{#1}} } \)
\( \newcommand{\vectorC}[1]{\textbf{#1}} \)
\( \newcommand{\vectorD}[1]{\overrightarrow{#1}} \)
\( \newcommand{\vectorDt}[1]{\overrightarrow{\text{#1}}} \)
\( \newcommand{\vectE}[1]{\overset{-\!-\!\rightharpoonup}{\vphantom{a}\smash{\mathbf {#1}}}} \)
\( \newcommand{\vecs}[1]{\overset { \scriptstyle \rightharpoonup} {\mathbf{#1}} } \)
\( \newcommand{\vecd}[1]{\overset{-\!-\!\rightharpoonup}{\vphantom{a}\smash {#1}}} \)
\(\newcommand{\avec}{\mathbf a}\) \(\newcommand{\bvec}{\mathbf b}\) \(\newcommand{\cvec}{\mathbf c}\) \(\newcommand{\dvec}{\mathbf d}\) \(\newcommand{\dtil}{\widetilde{\mathbf d}}\) \(\newcommand{\evec}{\mathbf e}\) \(\newcommand{\fvec}{\mathbf f}\) \(\newcommand{\nvec}{\mathbf n}\) \(\newcommand{\pvec}{\mathbf p}\) \(\newcommand{\qvec}{\mathbf q}\) \(\newcommand{\svec}{\mathbf s}\) \(\newcommand{\tvec}{\mathbf t}\) \(\newcommand{\uvec}{\mathbf u}\) \(\newcommand{\vvec}{\mathbf v}\) \(\newcommand{\wvec}{\mathbf w}\) \(\newcommand{\xvec}{\mathbf x}\) \(\newcommand{\yvec}{\mathbf y}\) \(\newcommand{\zvec}{\mathbf z}\) \(\newcommand{\rvec}{\mathbf r}\) \(\newcommand{\mvec}{\mathbf m}\) \(\newcommand{\zerovec}{\mathbf 0}\) \(\newcommand{\onevec}{\mathbf 1}\) \(\newcommand{\real}{\mathbb R}\) \(\newcommand{\twovec}[2]{\left[\begin{array}{r}#1 \\ #2 \end{array}\right]}\) \(\newcommand{\ctwovec}[2]{\left[\begin{array}{c}#1 \\ #2 \end{array}\right]}\) \(\newcommand{\threevec}[3]{\left[\begin{array}{r}#1 \\ #2 \\ #3 \end{array}\right]}\) \(\newcommand{\cthreevec}[3]{\left[\begin{array}{c}#1 \\ #2 \\ #3 \end{array}\right]}\) \(\newcommand{\fourvec}[4]{\left[\begin{array}{r}#1 \\ #2 \\ #3 \\ #4 \end{array}\right]}\) \(\newcommand{\cfourvec}[4]{\left[\begin{array}{c}#1 \\ #2 \\ #3 \\ #4 \end{array}\right]}\) \(\newcommand{\fivevec}[5]{\left[\begin{array}{r}#1 \\ #2 \\ #3 \\ #4 \\ #5 \\ \end{array}\right]}\) \(\newcommand{\cfivevec}[5]{\left[\begin{array}{c}#1 \\ #2 \\ #3 \\ #4 \\ #5 \\ \end{array}\right]}\) \(\newcommand{\mattwo}[4]{\left[\begin{array}{rr}#1 \amp #2 \\ #3 \amp #4 \\ \end{array}\right]}\) \(\newcommand{\laspan}[1]{\text{Span}\{#1\}}\) \(\newcommand{\bcal}{\cal B}\) \(\newcommand{\ccal}{\cal C}\) \(\newcommand{\scal}{\cal S}\) \(\newcommand{\wcal}{\cal W}\) \(\newcommand{\ecal}{\cal E}\) \(\newcommand{\coords}[2]{\left\{#1\right\}_{#2}}\) \(\newcommand{\gray}[1]{\color{gray}{#1}}\) \(\newcommand{\lgray}[1]{\color{lightgray}{#1}}\) \(\newcommand{\rank}{\operatorname{rank}}\) \(\newcommand{\row}{\text{Row}}\) \(\newcommand{\col}{\text{Col}}\) \(\renewcommand{\row}{\text{Row}}\) \(\newcommand{\nul}{\text{Nul}}\) \(\newcommand{\var}{\text{Var}}\) \(\newcommand{\corr}{\text{corr}}\) \(\newcommand{\len}[1]{\left|#1\right|}\) \(\newcommand{\bbar}{\overline{\bvec}}\) \(\newcommand{\bhat}{\widehat{\bvec}}\) \(\newcommand{\bperp}{\bvec^\perp}\) \(\newcommand{\xhat}{\widehat{\xvec}}\) \(\newcommand{\vhat}{\widehat{\vvec}}\) \(\newcommand{\uhat}{\widehat{\uvec}}\) \(\newcommand{\what}{\widehat{\wvec}}\) \(\newcommand{\Sighat}{\widehat{\Sigma}}\) \(\newcommand{\lt}{<}\) \(\newcommand{\gt}{>}\) \(\newcommand{\amp}{&}\) \(\definecolor{fillinmathshade}{gray}{0.9}\)Qualitative Applications
In a qualitative analysis our interest is in determining the identity of a substance of interest to us. By itself, mass spectrometry is a powerful tool for determining the identity of pure compounds. The analysis of mixtures, however, is possible if we use a mass spectrometer as the detector for a separation technique, such as gas chromatography, or if we string together two or more mass analyzers in sequence.
Identification of Pure Compounds
There are several ways to use a mass spectrum to identify a compound, including identifying its molecular weight, using isotopic ratios, examining fragmentation patterns, and by searching through data bases.
Using Molecular Weight Information. A molecular ion peak, M+•, when it is present, a [M + H]+ peak or a [M – H]+ peak, provides information about the compound's molecular weight. When using a low resolution mass analyzer, this may be sufficient to distinguish between molecular ions with, for example, a nominal mass of 95 amu and a nominal mass of 96 amu, but insufficient to distinguish between molecular ions with a more precise mass of 96.0399 amu and 96.0575 amu. When using a high resolution mass analyzer, the difference between the last pair of molecular ions may be feasible.
Using Isotopic Ratios. The molecule cycloheptene has the formula C7H12 and a nominal mass of 96 amu, and the molecule cyclohexenone has the formula C6H8O and a nominal mass of 96 amu. Although both molecules will produce a molecular ion with the same nominal mass-to-charge ratio, each will also have a peak with a nominal mass of M + 1 due to the presence of isotopes of carbon, hydrogen, and oxygen. Because cycloheptene and cyclohexenone have different chemical formulas, the relative heights of their M + 1 peaks are different. Here is how we can work this out.
For every 100 atoms of 12C there are 1.08 atoms of 13C (that is, 1.08% of the carbon atoms are 13C), for every 100 atoms of 1H there are 0.015 atoms of 2H, and for every 100 atoms of 16O there are 0.04 atoms of 17O. For cycloheptene, this means that the relative height of its M + 1 peak to its M peak is
\[(7 \times 1.08) + (12 \times 0.015) = 7.74 \nonumber \]
and for cyclohexenone we have
\[(6 \times 1.08) + (8 \times 0.015) + (1 \times 0.04) = 6.64 \nonumber \]
Here we see that a careful examination of the relative height of the M + 1 peak provides a way to distinguish between C7H12 and C6H8O even though they have the same nominal masses. On-line calculators are available—this link provides one example—that you can use to calculate the full isotopic abundance patterns, including M + 2, M + 3, and other peaks. Isotopic patterns are particularly useful for identifying the presence of chlorine and bromine in a molecule because each has one isotope with a significant abundance: for chlorine, 37Cl has an abundance of 32.5% relative to 35Cl, and for bromine, 81Br has an abundance of 98.0% of 79Br.
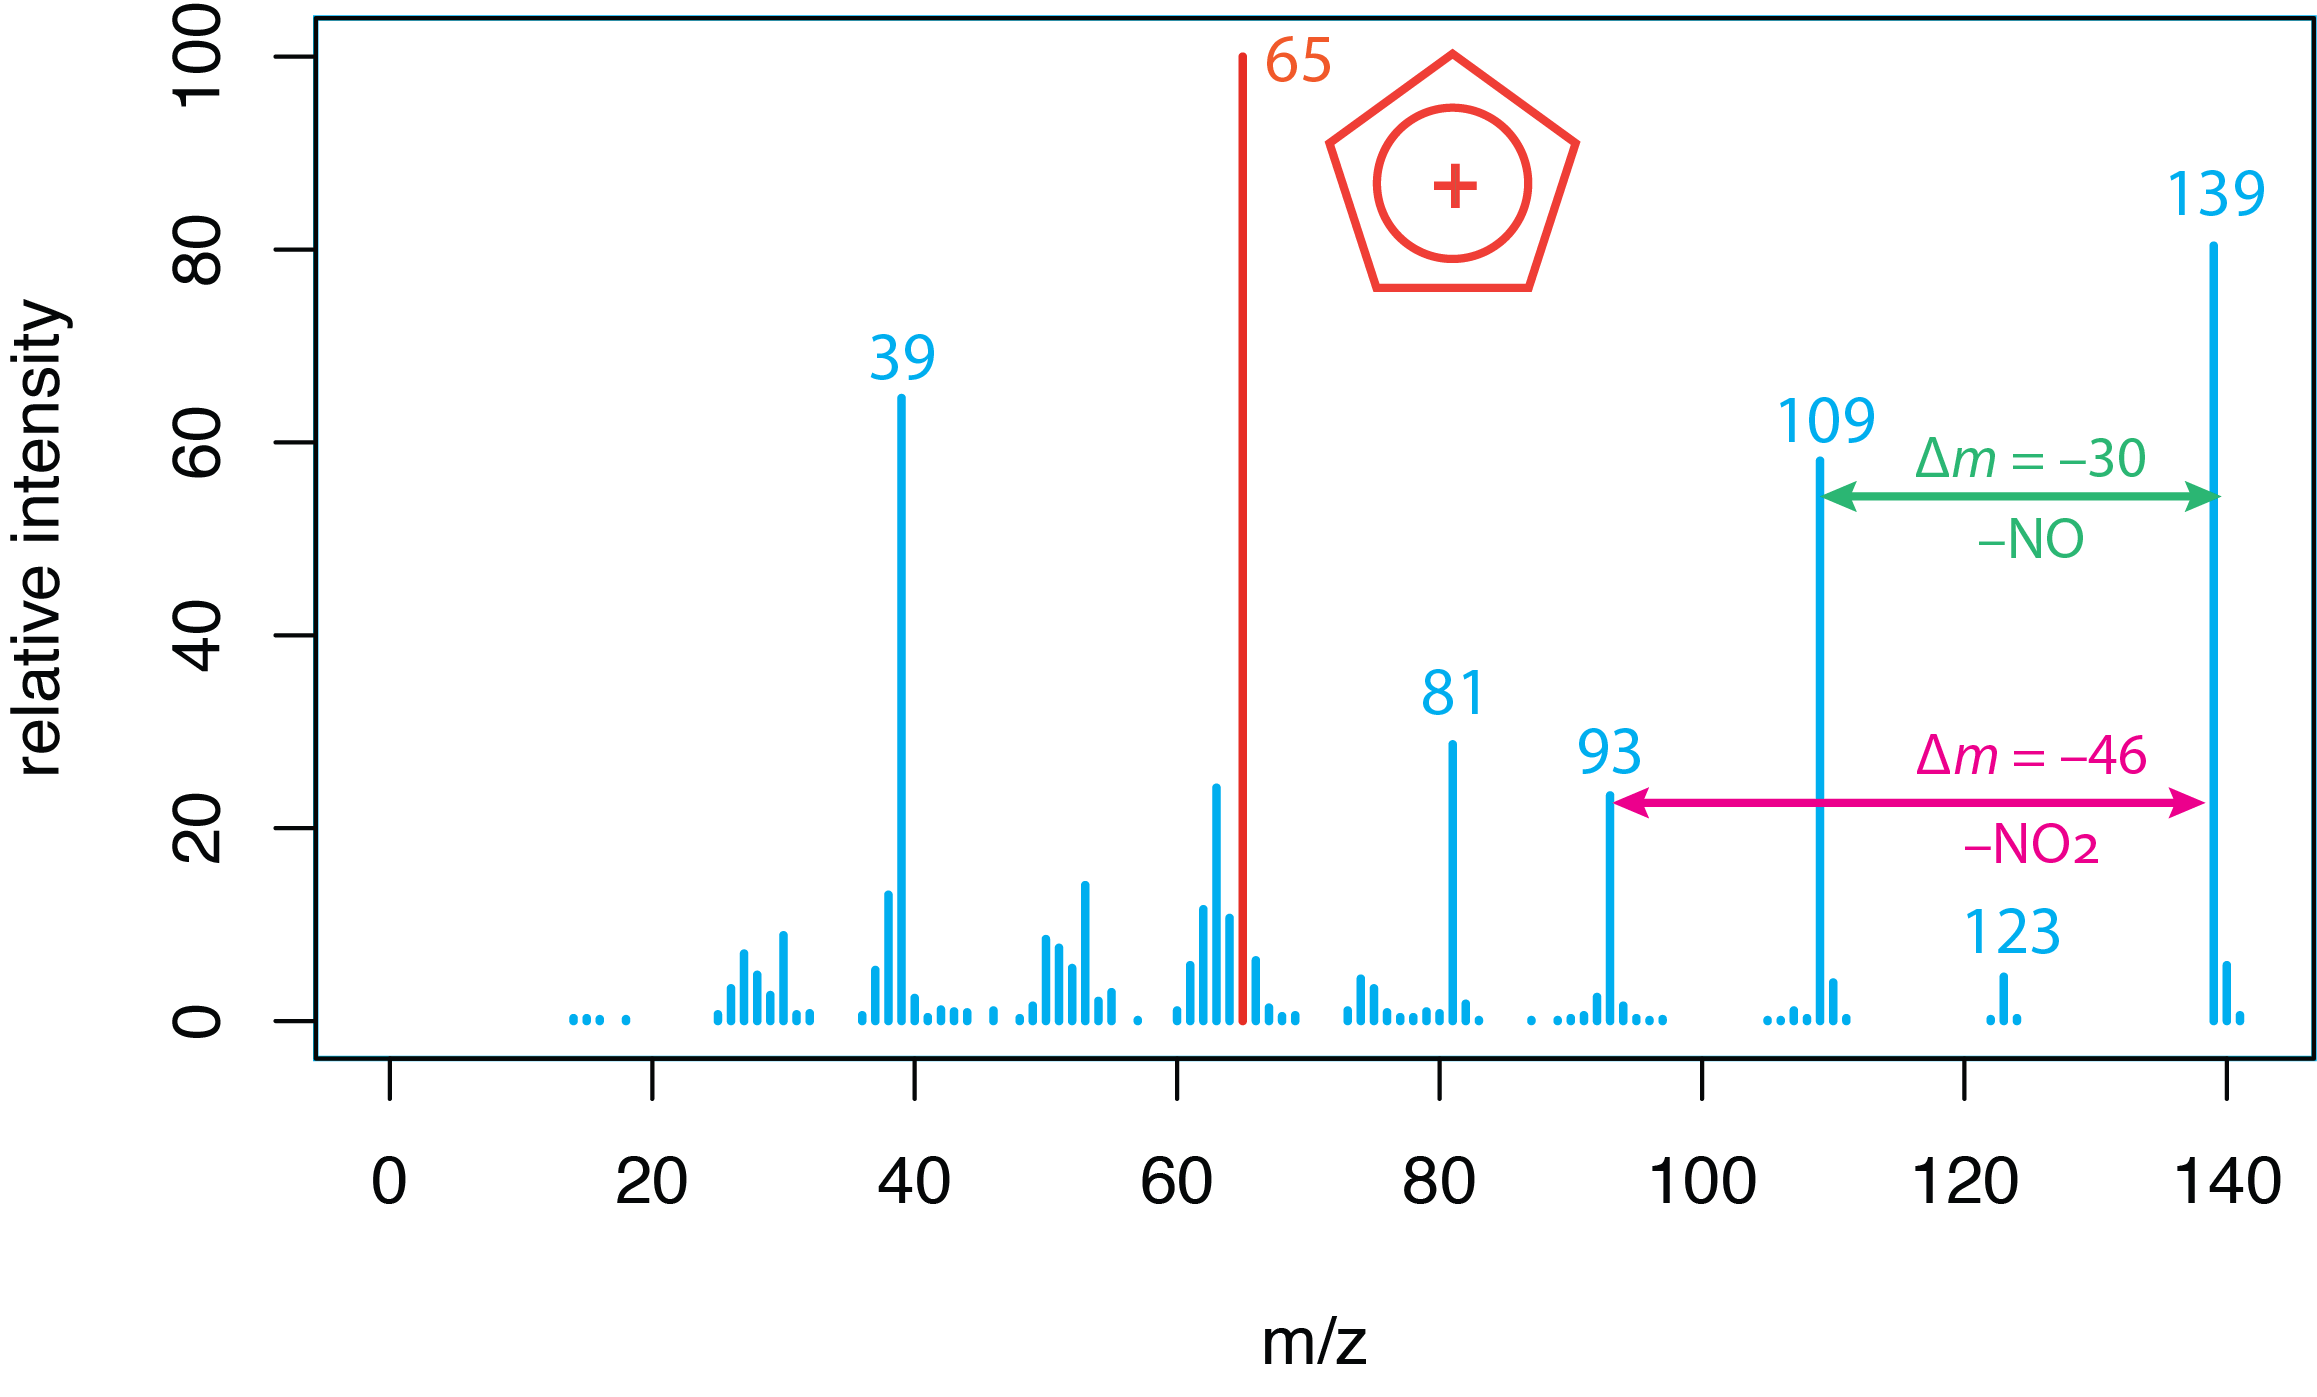
Using Fragmentation Patterns. Figure \(\PageIndex{1}\) shows the mass spectrum of p-nitrophenol, which we first considered in Section 20.1. A molecule's mass spectrum is unique and contains information that we can use to deduce its structure. Interpretation of a mass spectrum relies on identifying possible sources for the loss of mass, such as the a \(\Delta m\) of 30 amu corresponding to the loss of NO, or a \(\Delta m\) of 46 amu corresponding to the loss of NO2. Some mass-to-charge ratios are recognized as evidence for a particular ion, such as C5H5+ at a mass-to-charge ratio of 65. The interpretation of fragmentation patterns is covered elsewhere in the curriculum, particularly in organic chemistry, and is not given more consideration here.
Using Computer Searching. Large databases of mass spectra are available (see here for a source from NIST). A peak table of mass-to-charge ratios and peak intensities for a sample is entered into an algorithm that searches the database and identifies the most likely matches.
Analysis of Mixtures Using MS as a Detector for a GC or LC Separation
Mass spectrometry is a powerful analytical technique when the sample we are analyzing is pure (or if impurities are of sufficiently low concentration that they have little effect on the mass spectrum). For a mixture of two or more analytes, the interpretation of the mass spectrum is difficult, if not impossible. To analyze such a mixture, we need a means of separating the analytes from each other. One approach is to interface a mass spectrometer to a gas chromatograph or a liquid chromatograph. The GC, or LC separates the mixture into its component parts with the mass spectrometer serving as the detector. See Chapter 27 and Chapter 28 for further details about GC-MS and LC-MS.
Analysis of Mixtures Using Tandem Mass Spectrometry
Another approach to working with a complex sample is to use two or more mass analyzers in what is called tandem mass spectrometry. For example, if we place three quadrupole mass analyzers in a sequence, we can use a soft ionization source to generate mostly molecular ions of the form [M + H]+ for each of the sample's analytes, and then let the first quadrupole separate these molecular ions by the differences in their mass-to-charge ratio. The [M + H]+ molecular ions for one of the analytes is then selectively passed into the second quadrupole where it is allowed to undergo fragmentation by collision with a gas, such as He. Finally, these fragment ions are passed along to the third quadrupole where the mass spectrum is obtained. By sequentially passing each of the molecular ions from the first quadrupole through the second and third quadrupoles, we are able to obtain mass spectra for each molecule in the mixture.
Quantitative Applications
As a detector for other instrumental methods, such as gas chromatography and liquid chromatography, mass spectrometry provides for a quantitative analysis by monitoring either the total ion count or by monitoring ions of a single mass-to-charge ratio, which is known as selective ion monitoring. As an Independent method for determining an analyte's concentration, mass spectrometry is less attractive due to the difficulty of controlling the amount of sample or standard introduced into the instrument and the affect of the sample's matrix on fragmentation. The use of an internal standard improves precision and accuracy.