
19.4: Applications of Proton NMR
- Page ID
- 397290

\( \newcommand{\vecs}[1]{\overset { \scriptstyle \rightharpoonup} {\mathbf{#1}} } \)
\( \newcommand{\vecd}[1]{\overset{-\!-\!\rightharpoonup}{\vphantom{a}\smash {#1}}} \)
\( \newcommand{\id}{\mathrm{id}}\) \( \newcommand{\Span}{\mathrm{span}}\)
( \newcommand{\kernel}{\mathrm{null}\,}\) \( \newcommand{\range}{\mathrm{range}\,}\)
\( \newcommand{\RealPart}{\mathrm{Re}}\) \( \newcommand{\ImaginaryPart}{\mathrm{Im}}\)
\( \newcommand{\Argument}{\mathrm{Arg}}\) \( \newcommand{\norm}[1]{\| #1 \|}\)
\( \newcommand{\inner}[2]{\langle #1, #2 \rangle}\)
\( \newcommand{\Span}{\mathrm{span}}\)
\( \newcommand{\id}{\mathrm{id}}\)
\( \newcommand{\Span}{\mathrm{span}}\)
\( \newcommand{\kernel}{\mathrm{null}\,}\)
\( \newcommand{\range}{\mathrm{range}\,}\)
\( \newcommand{\RealPart}{\mathrm{Re}}\)
\( \newcommand{\ImaginaryPart}{\mathrm{Im}}\)
\( \newcommand{\Argument}{\mathrm{Arg}}\)
\( \newcommand{\norm}[1]{\| #1 \|}\)
\( \newcommand{\inner}[2]{\langle #1, #2 \rangle}\)
\( \newcommand{\Span}{\mathrm{span}}\) \( \newcommand{\AA}{\unicode[.8,0]{x212B}}\)
\( \newcommand{\vectorA}[1]{\vec{#1}} % arrow\)
\( \newcommand{\vectorAt}[1]{\vec{\text{#1}}} % arrow\)
\( \newcommand{\vectorB}[1]{\overset { \scriptstyle \rightharpoonup} {\mathbf{#1}} } \)
\( \newcommand{\vectorC}[1]{\textbf{#1}} \)
\( \newcommand{\vectorD}[1]{\overrightarrow{#1}} \)
\( \newcommand{\vectorDt}[1]{\overrightarrow{\text{#1}}} \)
\( \newcommand{\vectE}[1]{\overset{-\!-\!\rightharpoonup}{\vphantom{a}\smash{\mathbf {#1}}}} \)
\( \newcommand{\vecs}[1]{\overset { \scriptstyle \rightharpoonup} {\mathbf{#1}} } \)
\( \newcommand{\vecd}[1]{\overset{-\!-\!\rightharpoonup}{\vphantom{a}\smash {#1}}} \)
\(\newcommand{\avec}{\mathbf a}\) \(\newcommand{\bvec}{\mathbf b}\) \(\newcommand{\cvec}{\mathbf c}\) \(\newcommand{\dvec}{\mathbf d}\) \(\newcommand{\dtil}{\widetilde{\mathbf d}}\) \(\newcommand{\evec}{\mathbf e}\) \(\newcommand{\fvec}{\mathbf f}\) \(\newcommand{\nvec}{\mathbf n}\) \(\newcommand{\pvec}{\mathbf p}\) \(\newcommand{\qvec}{\mathbf q}\) \(\newcommand{\svec}{\mathbf s}\) \(\newcommand{\tvec}{\mathbf t}\) \(\newcommand{\uvec}{\mathbf u}\) \(\newcommand{\vvec}{\mathbf v}\) \(\newcommand{\wvec}{\mathbf w}\) \(\newcommand{\xvec}{\mathbf x}\) \(\newcommand{\yvec}{\mathbf y}\) \(\newcommand{\zvec}{\mathbf z}\) \(\newcommand{\rvec}{\mathbf r}\) \(\newcommand{\mvec}{\mathbf m}\) \(\newcommand{\zerovec}{\mathbf 0}\) \(\newcommand{\onevec}{\mathbf 1}\) \(\newcommand{\real}{\mathbb R}\) \(\newcommand{\twovec}[2]{\left[\begin{array}{r}#1 \\ #2 \end{array}\right]}\) \(\newcommand{\ctwovec}[2]{\left[\begin{array}{c}#1 \\ #2 \end{array}\right]}\) \(\newcommand{\threevec}[3]{\left[\begin{array}{r}#1 \\ #2 \\ #3 \end{array}\right]}\) \(\newcommand{\cthreevec}[3]{\left[\begin{array}{c}#1 \\ #2 \\ #3 \end{array}\right]}\) \(\newcommand{\fourvec}[4]{\left[\begin{array}{r}#1 \\ #2 \\ #3 \\ #4 \end{array}\right]}\) \(\newcommand{\cfourvec}[4]{\left[\begin{array}{c}#1 \\ #2 \\ #3 \\ #4 \end{array}\right]}\) \(\newcommand{\fivevec}[5]{\left[\begin{array}{r}#1 \\ #2 \\ #3 \\ #4 \\ #5 \\ \end{array}\right]}\) \(\newcommand{\cfivevec}[5]{\left[\begin{array}{c}#1 \\ #2 \\ #3 \\ #4 \\ #5 \\ \end{array}\right]}\) \(\newcommand{\mattwo}[4]{\left[\begin{array}{rr}#1 \amp #2 \\ #3 \amp #4 \\ \end{array}\right]}\) \(\newcommand{\laspan}[1]{\text{Span}\{#1\}}\) \(\newcommand{\bcal}{\cal B}\) \(\newcommand{\ccal}{\cal C}\) \(\newcommand{\scal}{\cal S}\) \(\newcommand{\wcal}{\cal W}\) \(\newcommand{\ecal}{\cal E}\) \(\newcommand{\coords}[2]{\left\{#1\right\}_{#2}}\) \(\newcommand{\gray}[1]{\color{gray}{#1}}\) \(\newcommand{\lgray}[1]{\color{lightgray}{#1}}\) \(\newcommand{\rank}{\operatorname{rank}}\) \(\newcommand{\row}{\text{Row}}\) \(\newcommand{\col}{\text{Col}}\) \(\renewcommand{\row}{\text{Row}}\) \(\newcommand{\nul}{\text{Nul}}\) \(\newcommand{\var}{\text{Var}}\) \(\newcommand{\corr}{\text{corr}}\) \(\newcommand{\len}[1]{\left|#1\right|}\) \(\newcommand{\bbar}{\overline{\bvec}}\) \(\newcommand{\bhat}{\widehat{\bvec}}\) \(\newcommand{\bperp}{\bvec^\perp}\) \(\newcommand{\xhat}{\widehat{\xvec}}\) \(\newcommand{\vhat}{\widehat{\vvec}}\) \(\newcommand{\uhat}{\widehat{\uvec}}\) \(\newcommand{\what}{\widehat{\wvec}}\) \(\newcommand{\Sighat}{\widehat{\Sigma}}\) \(\newcommand{\lt}{<}\) \(\newcommand{\gt}{>}\) \(\newcommand{\amp}{&}\) \(\definecolor{fillinmathshade}{gray}{0.9}\)Proton (1H) NMR finds use for both qualitative analyses and quantitative analyses; in this section we briefly consider each of these areas.
Identification of Compounds
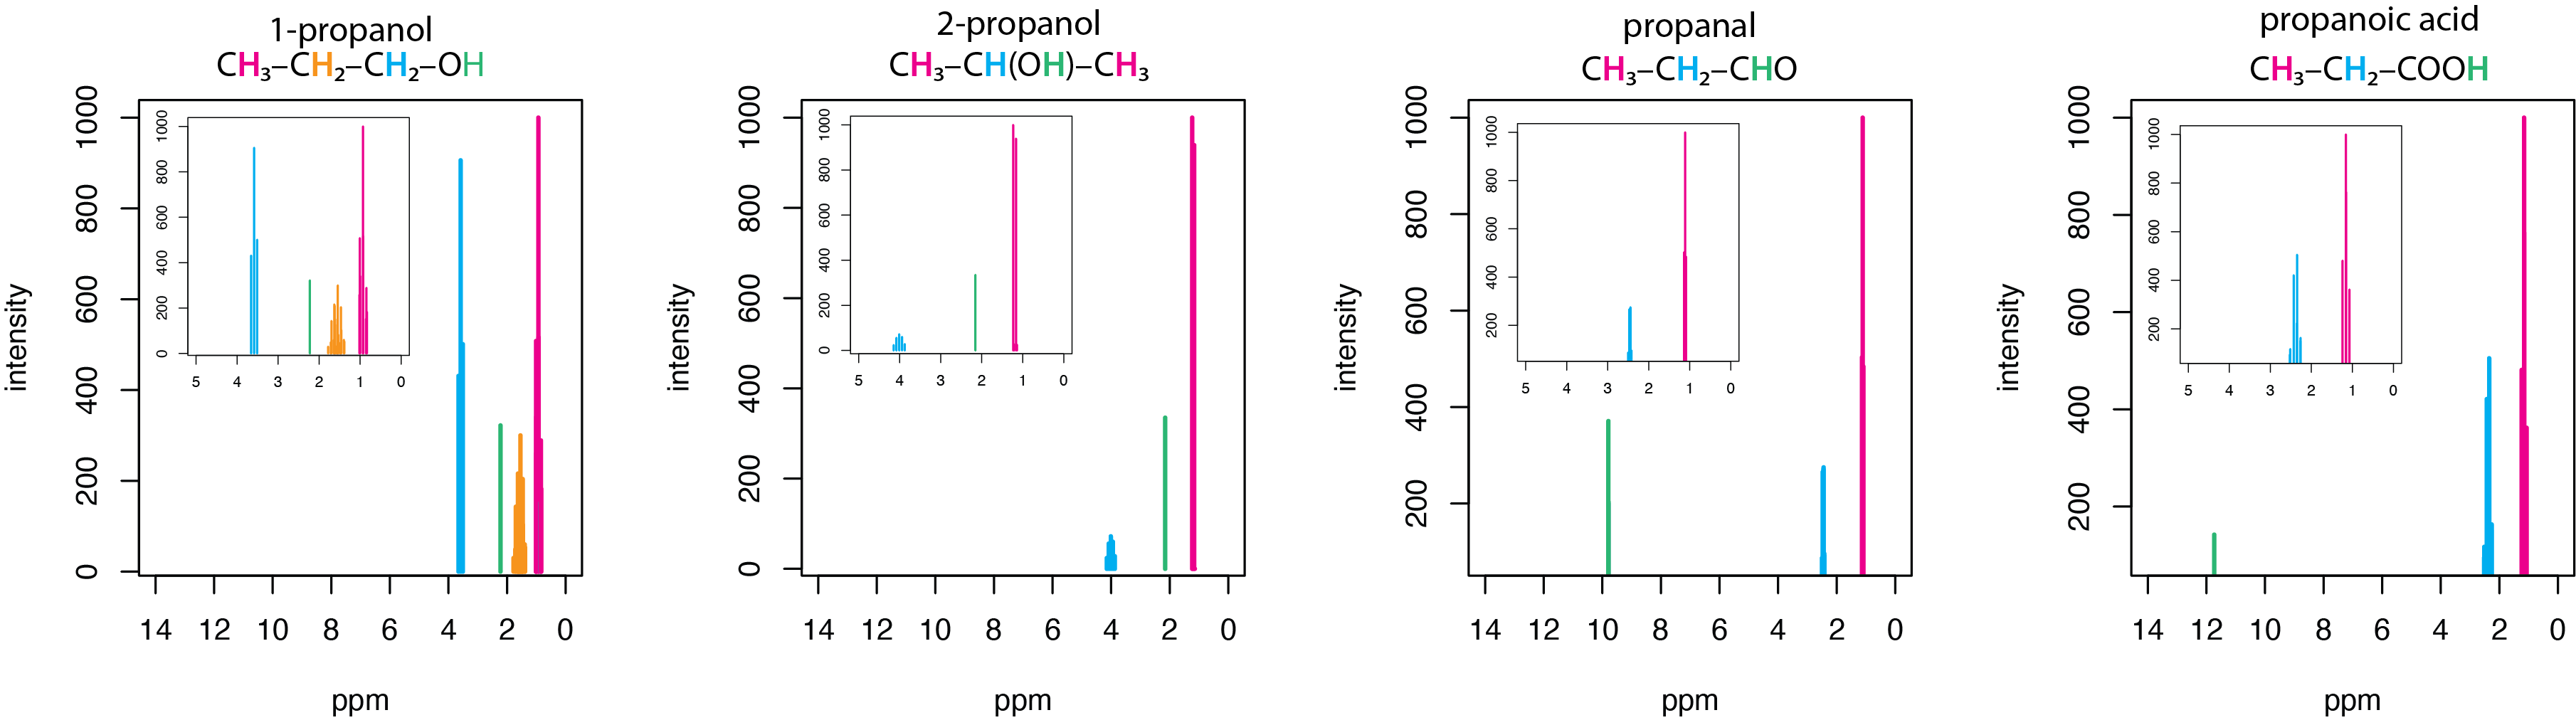
Proton NMR is an essential tool for the qualitative analysis of organic, inorganic, and biochemical compounds. Figure \(\PageIndex{1}\) provides a simple example that shows the relationship between structure and a 1H NMR's peaks. The spectra in this figure are for a set of four simple organic molecules, each of which has a chain of three carbons and an oxygen: 1-propanol, CH3CH2CH2OH, 2-propanol, CH3CH(OH)CH3, propanal, CH3CH2CHO, and propanoic acid, CH3CH2COOH. The first two of these molecules are alcohols, the third is an aldehyde, and the last is an acid. The main spectrum runs from 0–14 ppm, with insets showing the spectra over a narrower range of 0–5 ppm.
Each of these molecules has a terminal –CH3 group that is the most upfield peak in its spectrum, appearing between 0.94 – 1.20 ppm. Each of these molecules has a hydrogen that either is bonded to an oxygen or a hydrogen bonded to the same carbon as the oxygen. The hydrogens in the –OH groups of the two alcohols have similar shifts of 2.16 ppm and 2.26 ppm, but the aldehyde hydrogen in the –CHO group and the acid hydrogen in –COOH are shifted further downfield appearing at 9.793 ppm and 11.73 ppm, respectively. The hydrogens in the two –CH2– groups of 1-propanol have very different shifts, with the one adjacent to the –OH group appearing more downfield at 3.582 ppm than the one next to the –CH3 group at 1.57 ppm. Not surprisingly, the –CH– hydrogen in 2-proponal, which is adjacent to the –OH group appears at 4.008 ppm.
Comparisons such of this make it possible to build tables of chemical shifts—see Table 19.2.1 in Chapter 19.2 for an example—that can help in determining the identify of the molecule giving rise to a particular NMR spectrum. As this receives extensive coverage in other courses, particularly courses in organic chemistry, we will not provide a more extensive coverage here.
Quantitative Analysis
A quantitative analysis requires a method of standardization, which for NMR usually makes use of an internal standard. A good internal standard should have high purity and should have a relatively simple NMR spectrum with peaks that do not overlap with the analyte or other species present in the sample. If we are interested in only the relative concentrations of the analyte and the internal standard, then we can use the following formula
\[\frac{M_a}{M_{is}} = \frac{I_a}{I_{is}} \times \frac{N_{is}}{N_a} \label{quant1} \]
where \(M\) is the molar concentration of the analyte or internal standard, \(I\) is the intensity of the NMR peak for the analyte or internal standard, and \(N\) is the number of nuclei giving rise to the NMR peak for the analyte and the internal standard. Even if we don't know the exact concentration of the internal standard, if we know that its concentration is the same in all samples, then we can determine the relative concentration of analyte in a collection of samples.
If we are interested in determining the absolute concentration of analyte in a sample, then we must know the absolute concentration of the internal standared; when true, then Equation \ref{quant1} becomes
\[M_a = \frac{I_a}{I_{is}} \times \frac{N_{is}}{N_a} \times M_{is} \label{quant2} \]
Determining the purity of an analyte, \(P_a\), in a sample, we can use the equation
\[P_a = \frac{I_a}{I_{is}} \times \frac{N_{is}}{N_a} \times \frac{M_a}{M_{is}} \times \frac{W_{is}}{W_a} \times P_{is} \label{quant3} \]
where \(W\) is the weight of the internal standard or the sample that contains our analyte.