17.2: Mid-Infrared Reflection Spectrometry
- Page ID
- 379842

\( \newcommand{\vecs}[1]{\overset { \scriptstyle \rightharpoonup} {\mathbf{#1}} } \)
\( \newcommand{\vecd}[1]{\overset{-\!-\!\rightharpoonup}{\vphantom{a}\smash {#1}}} \)
\( \newcommand{\dsum}{\displaystyle\sum\limits} \)
\( \newcommand{\dint}{\displaystyle\int\limits} \)
\( \newcommand{\dlim}{\displaystyle\lim\limits} \)
\( \newcommand{\id}{\mathrm{id}}\) \( \newcommand{\Span}{\mathrm{span}}\)
( \newcommand{\kernel}{\mathrm{null}\,}\) \( \newcommand{\range}{\mathrm{range}\,}\)
\( \newcommand{\RealPart}{\mathrm{Re}}\) \( \newcommand{\ImaginaryPart}{\mathrm{Im}}\)
\( \newcommand{\Argument}{\mathrm{Arg}}\) \( \newcommand{\norm}[1]{\| #1 \|}\)
\( \newcommand{\inner}[2]{\langle #1, #2 \rangle}\)
\( \newcommand{\Span}{\mathrm{span}}\)
\( \newcommand{\id}{\mathrm{id}}\)
\( \newcommand{\Span}{\mathrm{span}}\)
\( \newcommand{\kernel}{\mathrm{null}\,}\)
\( \newcommand{\range}{\mathrm{range}\,}\)
\( \newcommand{\RealPart}{\mathrm{Re}}\)
\( \newcommand{\ImaginaryPart}{\mathrm{Im}}\)
\( \newcommand{\Argument}{\mathrm{Arg}}\)
\( \newcommand{\norm}[1]{\| #1 \|}\)
\( \newcommand{\inner}[2]{\langle #1, #2 \rangle}\)
\( \newcommand{\Span}{\mathrm{span}}\) \( \newcommand{\AA}{\unicode[.8,0]{x212B}}\)
\( \newcommand{\vectorA}[1]{\vec{#1}} % arrow\)
\( \newcommand{\vectorAt}[1]{\vec{\text{#1}}} % arrow\)
\( \newcommand{\vectorB}[1]{\overset { \scriptstyle \rightharpoonup} {\mathbf{#1}} } \)
\( \newcommand{\vectorC}[1]{\textbf{#1}} \)
\( \newcommand{\vectorD}[1]{\overrightarrow{#1}} \)
\( \newcommand{\vectorDt}[1]{\overrightarrow{\text{#1}}} \)
\( \newcommand{\vectE}[1]{\overset{-\!-\!\rightharpoonup}{\vphantom{a}\smash{\mathbf {#1}}}} \)
\( \newcommand{\vecs}[1]{\overset { \scriptstyle \rightharpoonup} {\mathbf{#1}} } \)
\(\newcommand{\longvect}{\overrightarrow}\)
\( \newcommand{\vecd}[1]{\overset{-\!-\!\rightharpoonup}{\vphantom{a}\smash {#1}}} \)
\(\newcommand{\avec}{\mathbf a}\) \(\newcommand{\bvec}{\mathbf b}\) \(\newcommand{\cvec}{\mathbf c}\) \(\newcommand{\dvec}{\mathbf d}\) \(\newcommand{\dtil}{\widetilde{\mathbf d}}\) \(\newcommand{\evec}{\mathbf e}\) \(\newcommand{\fvec}{\mathbf f}\) \(\newcommand{\nvec}{\mathbf n}\) \(\newcommand{\pvec}{\mathbf p}\) \(\newcommand{\qvec}{\mathbf q}\) \(\newcommand{\svec}{\mathbf s}\) \(\newcommand{\tvec}{\mathbf t}\) \(\newcommand{\uvec}{\mathbf u}\) \(\newcommand{\vvec}{\mathbf v}\) \(\newcommand{\wvec}{\mathbf w}\) \(\newcommand{\xvec}{\mathbf x}\) \(\newcommand{\yvec}{\mathbf y}\) \(\newcommand{\zvec}{\mathbf z}\) \(\newcommand{\rvec}{\mathbf r}\) \(\newcommand{\mvec}{\mathbf m}\) \(\newcommand{\zerovec}{\mathbf 0}\) \(\newcommand{\onevec}{\mathbf 1}\) \(\newcommand{\real}{\mathbb R}\) \(\newcommand{\twovec}[2]{\left[\begin{array}{r}#1 \\ #2 \end{array}\right]}\) \(\newcommand{\ctwovec}[2]{\left[\begin{array}{c}#1 \\ #2 \end{array}\right]}\) \(\newcommand{\threevec}[3]{\left[\begin{array}{r}#1 \\ #2 \\ #3 \end{array}\right]}\) \(\newcommand{\cthreevec}[3]{\left[\begin{array}{c}#1 \\ #2 \\ #3 \end{array}\right]}\) \(\newcommand{\fourvec}[4]{\left[\begin{array}{r}#1 \\ #2 \\ #3 \\ #4 \end{array}\right]}\) \(\newcommand{\cfourvec}[4]{\left[\begin{array}{c}#1 \\ #2 \\ #3 \\ #4 \end{array}\right]}\) \(\newcommand{\fivevec}[5]{\left[\begin{array}{r}#1 \\ #2 \\ #3 \\ #4 \\ #5 \\ \end{array}\right]}\) \(\newcommand{\cfivevec}[5]{\left[\begin{array}{c}#1 \\ #2 \\ #3 \\ #4 \\ #5 \\ \end{array}\right]}\) \(\newcommand{\mattwo}[4]{\left[\begin{array}{rr}#1 \amp #2 \\ #3 \amp #4 \\ \end{array}\right]}\) \(\newcommand{\laspan}[1]{\text{Span}\{#1\}}\) \(\newcommand{\bcal}{\cal B}\) \(\newcommand{\ccal}{\cal C}\) \(\newcommand{\scal}{\cal S}\) \(\newcommand{\wcal}{\cal W}\) \(\newcommand{\ecal}{\cal E}\) \(\newcommand{\coords}[2]{\left\{#1\right\}_{#2}}\) \(\newcommand{\gray}[1]{\color{gray}{#1}}\) \(\newcommand{\lgray}[1]{\color{lightgray}{#1}}\) \(\newcommand{\rank}{\operatorname{rank}}\) \(\newcommand{\row}{\text{Row}}\) \(\newcommand{\col}{\text{Col}}\) \(\renewcommand{\row}{\text{Row}}\) \(\newcommand{\nul}{\text{Nul}}\) \(\newcommand{\var}{\text{Var}}\) \(\newcommand{\corr}{\text{corr}}\) \(\newcommand{\len}[1]{\left|#1\right|}\) \(\newcommand{\bbar}{\overline{\bvec}}\) \(\newcommand{\bhat}{\widehat{\bvec}}\) \(\newcommand{\bperp}{\bvec^\perp}\) \(\newcommand{\xhat}{\widehat{\xvec}}\) \(\newcommand{\vhat}{\widehat{\vvec}}\) \(\newcommand{\uhat}{\widehat{\uvec}}\) \(\newcommand{\what}{\widehat{\wvec}}\) \(\newcommand{\Sighat}{\widehat{\Sigma}}\) \(\newcommand{\lt}{<}\) \(\newcommand{\gt}{>}\) \(\newcommand{\amp}{&}\) \(\definecolor{fillinmathshade}{gray}{0.9}\)The first section of this chapter considered mid-IR absorption spectrometry in which we measure the amount of light that is transmitted by the sample, which we can convert, if we wish, into absorbance values. In the process, we examined both transmittance (Figure 7.1.4 and Figure 7.1.5) and absorbance (Figure 7.1.6) spectra. In this section, we consider experiments in which we measure the reflection of infrared radiation by a sample.
Types of Reflections
There are two broad classes of reflection: internal and external. As shown in Figure \(\PageIndex{1}\), internal reflection occurs when light encounters an interface between two media—here identified as the sample and the support—that have different refractive indicies, n. When the refractive index of the support is greater than the refractive index of the sample, then some of the light reflects off the interface. Attenuated total reflectance spectrometry is one example of an instrumental method that relies on internal reflection.

External reflectance occurs when light reflects off of the sample's surface. As shown in Figure \(\PageIndex{2}\), the way in which light reflects depends on the nature of the sample's surface. In specular reflectance, the angle of reflection is the same at all locations because the sample's surface is smooth; in diffuse reflectance, the angle of reflection varies between locations due to the roughness of the sample's surface. Diffuse reflectance spectrometry is one example of an instrumental method that relies on external reflection.

Attenuated Total Reflectance Spectrometry
The analysis of an aqueous sample is complicated by the solubility of the NaCl cell window in water. One approach to obtaining an infrared spectrum of an aqueous solution is to use attenuated total reflectance instead of transmission. Figure \(\PageIndex{3}\) shows a diagram of a typical attenuated total reflectance (ATR) FT–IR instrument. The ATR cell consists of a high refractive index material, such as ZnSe or diamond, sandwiched between a low refractive index substrate and a lower refractive index sample. Radiation from the source enters the ATR crystal where it undergoes a series of internal reflections before exiting the crystal. During each reflection the radiation penetrates a short distance into the sample. This depth of penetration, \(d_p\), depends on the wavelength of the light, \(\lambda\), the refractive index of the ATR crystal, \(n_1\), the refractive index of the sample, \(n_2\), and the angle of the incident radiation, \(\theta\).
\[d_p = \frac {\lambda} {2 \pi \sqrt{n_1^2 \sin^2 \theta - n_2^2}} \label{depth} \]
For example, when using ZnSe as the ATR crystal (\(n_1 = 2.4\)) and an angle of incidence of \(45^{\circ}\), light of 1000 cm–1 penetrates to a depth of 2.0 µm in a sample with a refractive index similar to that for KBr (\(n_2\ = 1.5\)).
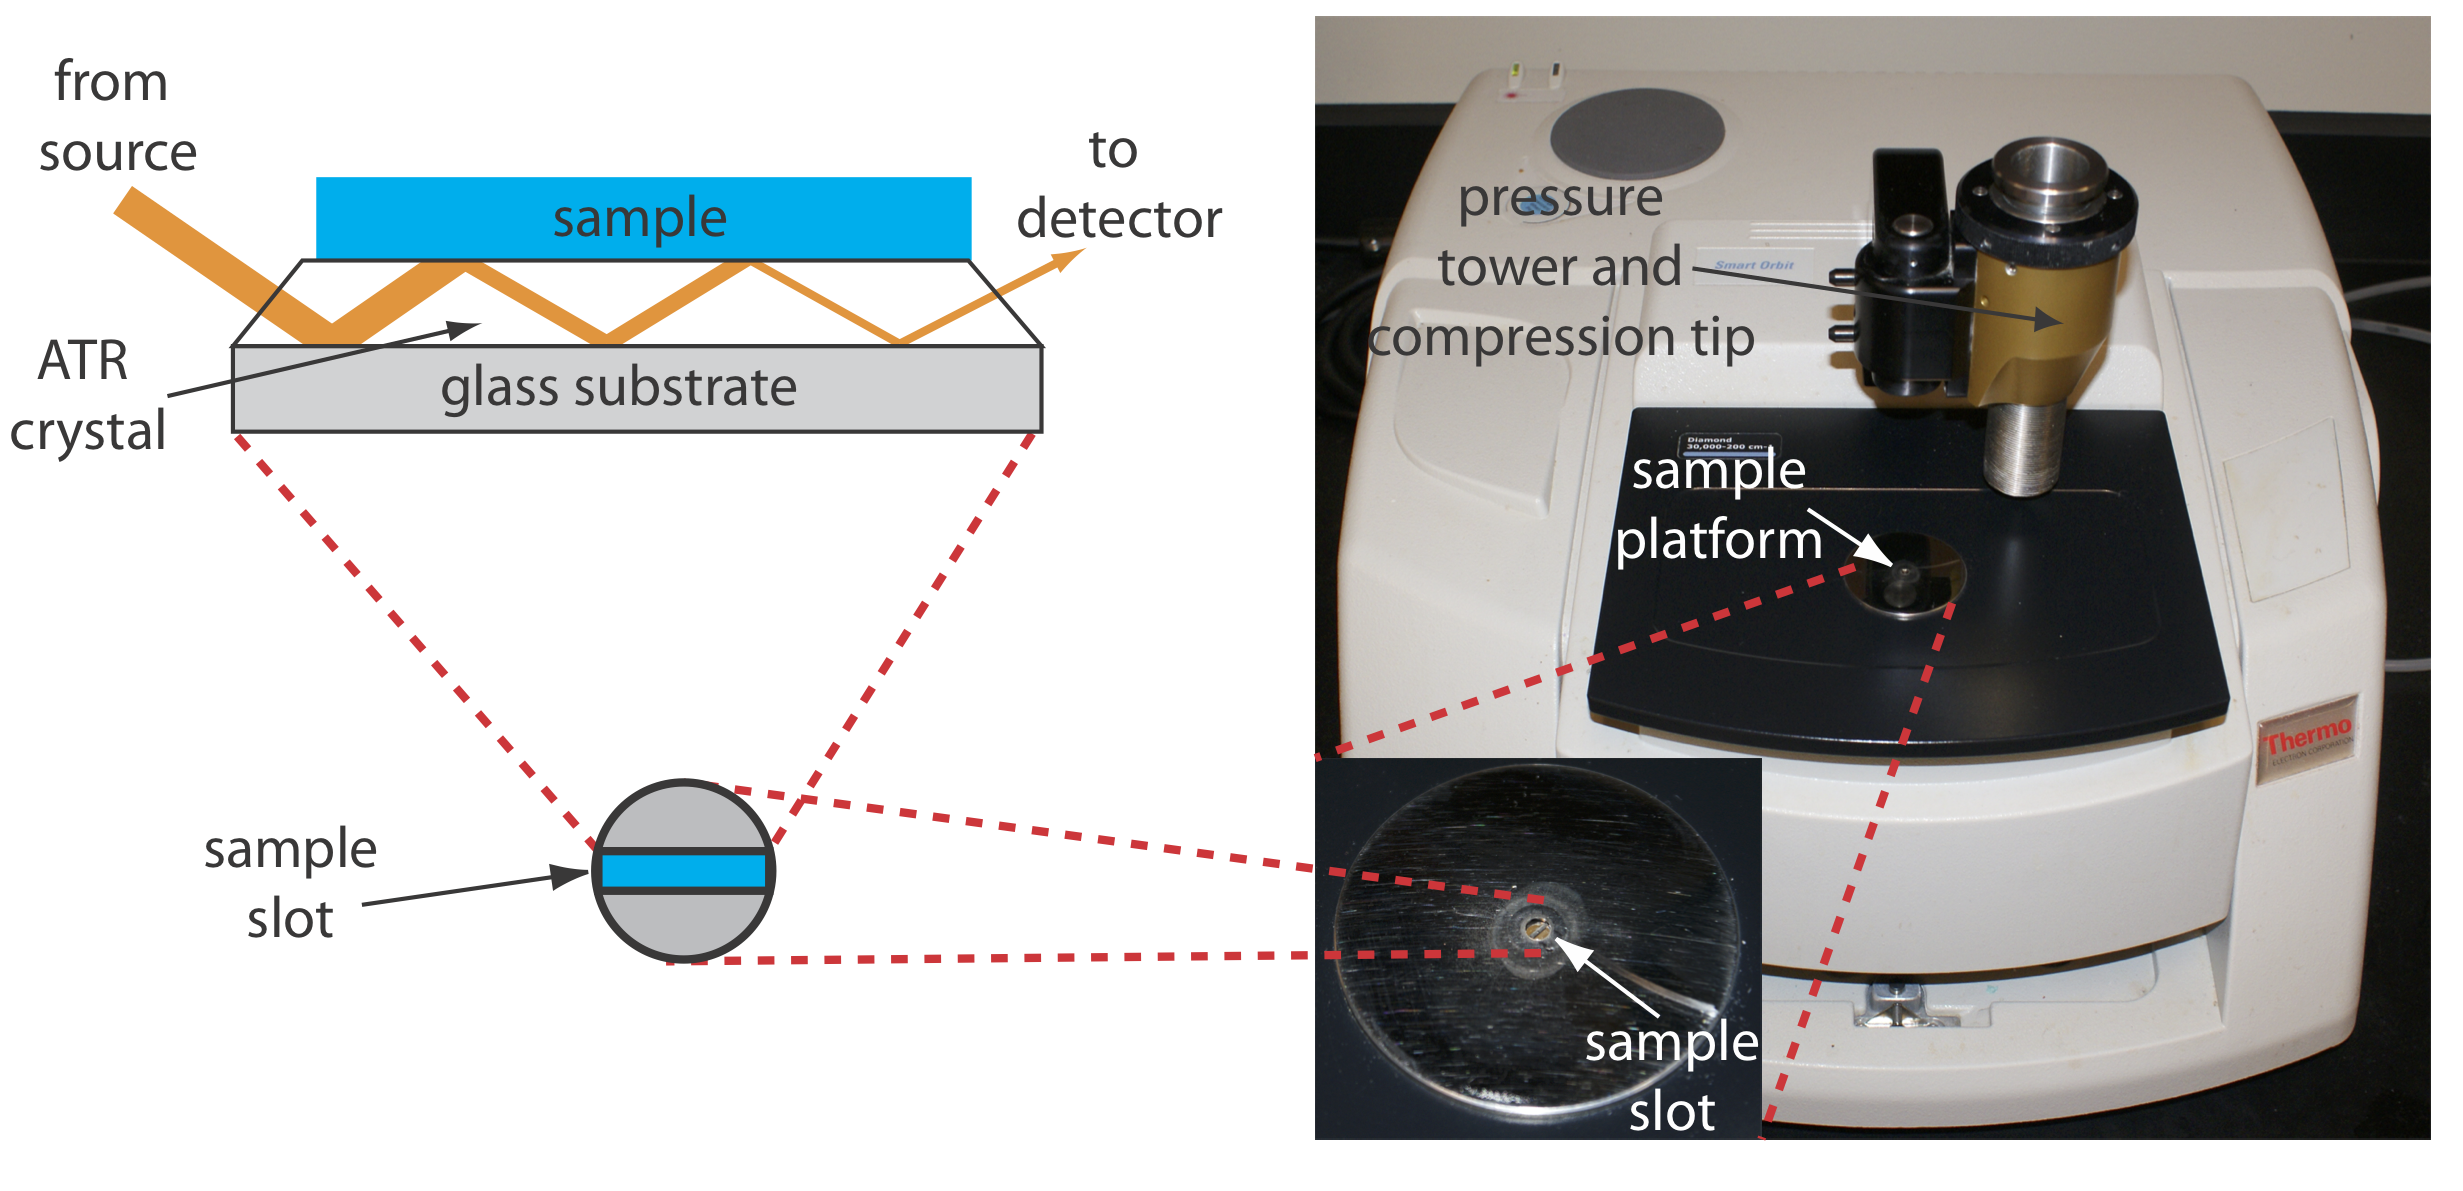
Solid samples also can be analyzed using an ATR sample cell. After placing the solid in the sample slot, a compression tip ensures that it is in contact with the ATR crystal. Examples of solids analyzed by ATR include polymers, fibers, fabrics, powders, and biological tissue samples. ATR spectra are similar, but not identical, to those obtained by measuring transmission. An important contribution to this is the wavelength-dependent depth of penetration of the infrared radiation where a decrease in wavenumber (longer wavelength) results in a greater depth of penetration, which changes the intensity and width of absorption bands.
Diffuse Reflectance Spectrometry
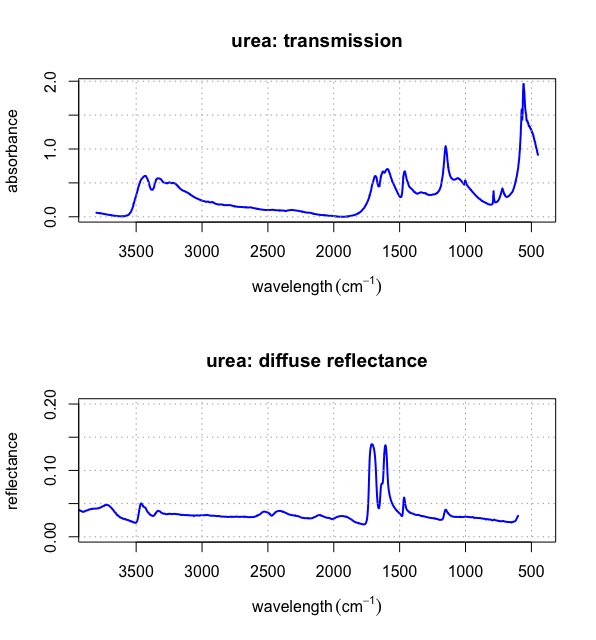
Another reflectance method is diffuse reflectance, in which radiation is reflected from a rough surface, such as a powder. Powdered samples are mixed with a non-absorbing material, such as powdered KBr, and the reflected light is collected and analyzed. As with ATR, the resulting spectrum is similar to that obtained by conventional transmission methods. Figure \(\PageIndex{4}\) shows the IR spectrum for urea obtained using transmission and diffuse reflectance (both collected using an FT-IR). Both spectra show similar features between 1000 cm–1 and 2000 cm–1, although there are differences in relative peak heights and background absorption.