
11.3: Inductively Coupled Plasma Mass Spectrometer
- Page ID
- 387722

\( \newcommand{\vecs}[1]{\overset { \scriptstyle \rightharpoonup} {\mathbf{#1}} } \)
\( \newcommand{\vecd}[1]{\overset{-\!-\!\rightharpoonup}{\vphantom{a}\smash {#1}}} \)
\( \newcommand{\id}{\mathrm{id}}\) \( \newcommand{\Span}{\mathrm{span}}\)
( \newcommand{\kernel}{\mathrm{null}\,}\) \( \newcommand{\range}{\mathrm{range}\,}\)
\( \newcommand{\RealPart}{\mathrm{Re}}\) \( \newcommand{\ImaginaryPart}{\mathrm{Im}}\)
\( \newcommand{\Argument}{\mathrm{Arg}}\) \( \newcommand{\norm}[1]{\| #1 \|}\)
\( \newcommand{\inner}[2]{\langle #1, #2 \rangle}\)
\( \newcommand{\Span}{\mathrm{span}}\)
\( \newcommand{\id}{\mathrm{id}}\)
\( \newcommand{\Span}{\mathrm{span}}\)
\( \newcommand{\kernel}{\mathrm{null}\,}\)
\( \newcommand{\range}{\mathrm{range}\,}\)
\( \newcommand{\RealPart}{\mathrm{Re}}\)
\( \newcommand{\ImaginaryPart}{\mathrm{Im}}\)
\( \newcommand{\Argument}{\mathrm{Arg}}\)
\( \newcommand{\norm}[1]{\| #1 \|}\)
\( \newcommand{\inner}[2]{\langle #1, #2 \rangle}\)
\( \newcommand{\Span}{\mathrm{span}}\) \( \newcommand{\AA}{\unicode[.8,0]{x212B}}\)
\( \newcommand{\vectorA}[1]{\vec{#1}} % arrow\)
\( \newcommand{\vectorAt}[1]{\vec{\text{#1}}} % arrow\)
\( \newcommand{\vectorB}[1]{\overset { \scriptstyle \rightharpoonup} {\mathbf{#1}} } \)
\( \newcommand{\vectorC}[1]{\textbf{#1}} \)
\( \newcommand{\vectorD}[1]{\overrightarrow{#1}} \)
\( \newcommand{\vectorDt}[1]{\overrightarrow{\text{#1}}} \)
\( \newcommand{\vectE}[1]{\overset{-\!-\!\rightharpoonup}{\vphantom{a}\smash{\mathbf {#1}}}} \)
\( \newcommand{\vecs}[1]{\overset { \scriptstyle \rightharpoonup} {\mathbf{#1}} } \)
\( \newcommand{\vecd}[1]{\overset{-\!-\!\rightharpoonup}{\vphantom{a}\smash {#1}}} \)
\(\newcommand{\avec}{\mathbf a}\) \(\newcommand{\bvec}{\mathbf b}\) \(\newcommand{\cvec}{\mathbf c}\) \(\newcommand{\dvec}{\mathbf d}\) \(\newcommand{\dtil}{\widetilde{\mathbf d}}\) \(\newcommand{\evec}{\mathbf e}\) \(\newcommand{\fvec}{\mathbf f}\) \(\newcommand{\nvec}{\mathbf n}\) \(\newcommand{\pvec}{\mathbf p}\) \(\newcommand{\qvec}{\mathbf q}\) \(\newcommand{\svec}{\mathbf s}\) \(\newcommand{\tvec}{\mathbf t}\) \(\newcommand{\uvec}{\mathbf u}\) \(\newcommand{\vvec}{\mathbf v}\) \(\newcommand{\wvec}{\mathbf w}\) \(\newcommand{\xvec}{\mathbf x}\) \(\newcommand{\yvec}{\mathbf y}\) \(\newcommand{\zvec}{\mathbf z}\) \(\newcommand{\rvec}{\mathbf r}\) \(\newcommand{\mvec}{\mathbf m}\) \(\newcommand{\zerovec}{\mathbf 0}\) \(\newcommand{\onevec}{\mathbf 1}\) \(\newcommand{\real}{\mathbb R}\) \(\newcommand{\twovec}[2]{\left[\begin{array}{r}#1 \\ #2 \end{array}\right]}\) \(\newcommand{\ctwovec}[2]{\left[\begin{array}{c}#1 \\ #2 \end{array}\right]}\) \(\newcommand{\threevec}[3]{\left[\begin{array}{r}#1 \\ #2 \\ #3 \end{array}\right]}\) \(\newcommand{\cthreevec}[3]{\left[\begin{array}{c}#1 \\ #2 \\ #3 \end{array}\right]}\) \(\newcommand{\fourvec}[4]{\left[\begin{array}{r}#1 \\ #2 \\ #3 \\ #4 \end{array}\right]}\) \(\newcommand{\cfourvec}[4]{\left[\begin{array}{c}#1 \\ #2 \\ #3 \\ #4 \end{array}\right]}\) \(\newcommand{\fivevec}[5]{\left[\begin{array}{r}#1 \\ #2 \\ #3 \\ #4 \\ #5 \\ \end{array}\right]}\) \(\newcommand{\cfivevec}[5]{\left[\begin{array}{c}#1 \\ #2 \\ #3 \\ #4 \\ #5 \\ \end{array}\right]}\) \(\newcommand{\mattwo}[4]{\left[\begin{array}{rr}#1 \amp #2 \\ #3 \amp #4 \\ \end{array}\right]}\) \(\newcommand{\laspan}[1]{\text{Span}\{#1\}}\) \(\newcommand{\bcal}{\cal B}\) \(\newcommand{\ccal}{\cal C}\) \(\newcommand{\scal}{\cal S}\) \(\newcommand{\wcal}{\cal W}\) \(\newcommand{\ecal}{\cal E}\) \(\newcommand{\coords}[2]{\left\{#1\right\}_{#2}}\) \(\newcommand{\gray}[1]{\color{gray}{#1}}\) \(\newcommand{\lgray}[1]{\color{lightgray}{#1}}\) \(\newcommand{\rank}{\operatorname{rank}}\) \(\newcommand{\row}{\text{Row}}\) \(\newcommand{\col}{\text{Col}}\) \(\renewcommand{\row}{\text{Row}}\) \(\newcommand{\nul}{\text{Nul}}\) \(\newcommand{\var}{\text{Var}}\) \(\newcommand{\corr}{\text{corr}}\) \(\newcommand{\len}[1]{\left|#1\right|}\) \(\newcommand{\bbar}{\overline{\bvec}}\) \(\newcommand{\bhat}{\widehat{\bvec}}\) \(\newcommand{\bperp}{\bvec^\perp}\) \(\newcommand{\xhat}{\widehat{\xvec}}\) \(\newcommand{\vhat}{\widehat{\vvec}}\) \(\newcommand{\uhat}{\widehat{\uvec}}\) \(\newcommand{\what}{\widehat{\wvec}}\) \(\newcommand{\Sighat}{\widehat{\Sigma}}\) \(\newcommand{\lt}{<}\) \(\newcommand{\gt}{>}\) \(\newcommand{\amp}{&}\) \(\definecolor{fillinmathshade}{gray}{0.9}\)In Chapter 10 we introduced the inductively coupled plasma (ICP) as a source for atomic emission. The plasma in ICP is formed by ionizing a flowing stream of argon gas, producing argon ions and electrons. The sample is introduced into the plasma where the high operating temperature of 6000–8000 K is sufficient to atomize and ionize the sample. In optical ICP we measure the emission of photons from the atoms and ions that are in excited states. In ICP-MS we use the plasma as a source of ions that we can send to a mass spectrometer for analysis.
Instrumentation for ICP-MS
An ICP torch operates at room pressure and at an elevated temperature, and a mass spectrometer, as noted in Section 11.2, operates under a vacuum and at room temperature. This difference in pressure and temperature means that a coupling together of these two instrument requires an interface than can bring the pressure and temprature in line with the demands of the mass spectrometer. Figure \(\PageIndex{1}\) provides a schematic diagram of a typical ICP-MS instrument with the ICP torch on the right and the mass spectrometer's quadrupole mass analyzer and a continuous electron multiplier on the left. In between the two is a two-stage interface. Note that none of the components in Figure \(\PageIndex{1}\) are drawn to scale.

The first stage of the interface consists of two cone-shaped openings: a sampler cone and a skimmer cone. The hot plasma from the ICP torch enters the first stage of the interface through the sampler cone, which is a pin-hole with a diameter of approximately 1 mm. Samples in solution form are drawn directly into the ICP torch using a nebulizer. Solid samples are vaporized using a laser (a process called laser ablation) and the vapor drawn directly into the ICP torch.
A pump is used to drop the pressure in the first stage to approximately 1 torr. The expansion of the plasma as it enters the first stage results in some cooling of the plasma. The skimmer cone allows a small portion of the plasma in the first stage to pass into the second stage, which is held at the mass spectrometer's operating pressure of approximately 10–5 torr. A series of ion lenses are used to narrow the conical dispersion of the plasma, to isolate positive ions from electrons, neutral species, and photons—all of which will generate a signal if they reach the transducer—and to focus the ion beam onto the quadrupole's entrance.
Atomic Mass Spectra and Interferences
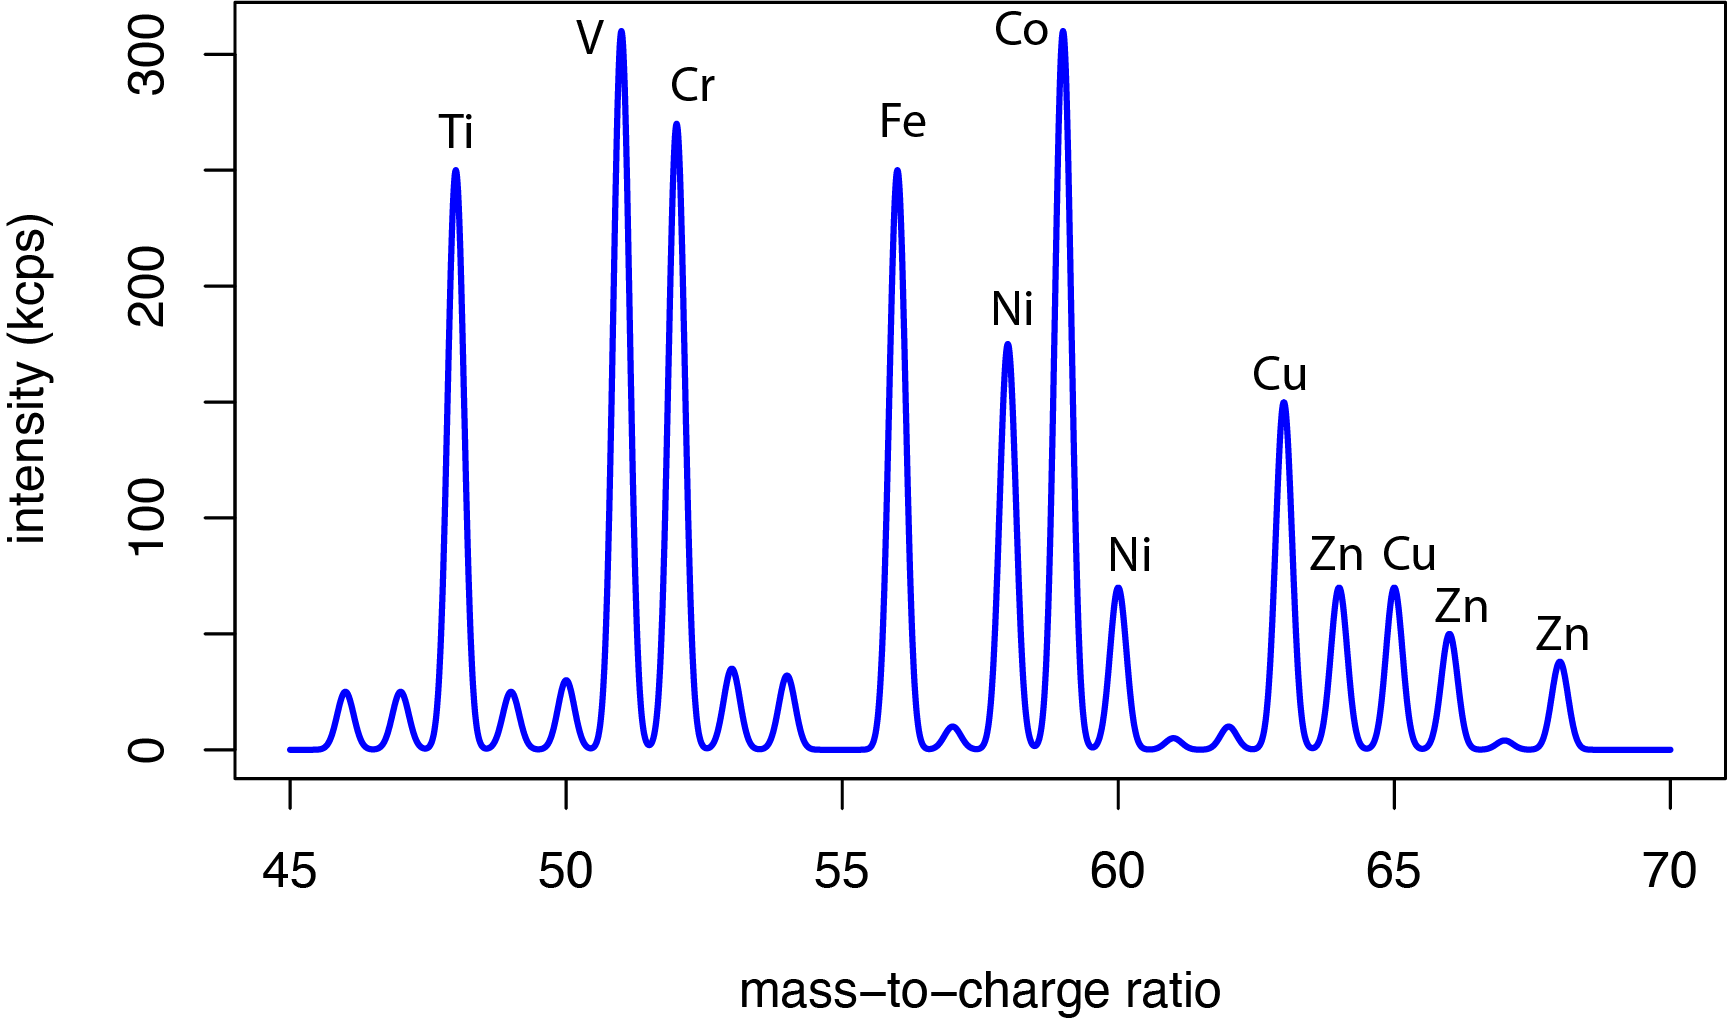
Figure \(\PageIndex{2}\) shows an example of an ICP-MS spectrum for the analysis of a metal coating using laser ablation to volatilize the sample. The quadrupole mass analyzer operates over a mass-to-charge range of approximately 3 to 300 and can resolve lines that differ by \(\pm1 \text{ m/z}\). Data are collected either by scanning the quadrupole to provide a survey spectrum of all ions generated in the plasma, as is the case in Figure \(\PageIndex{2}\), or by peak hopping in which we gather data for just a few discrete mass-to-charge ratios, adjusting the quadrupole so that it passes only a single mass-to-charge ratio and count the ions for a set period of time before moving to the next mass-to-charge ratio.
Spectroscopic Interferences
An ICP-MS spectrum is much simpler than the corresponding ICP atomic emission spectrum because each element in the latter has many emission lines and because the plasma itself has many emission lines. Still, an ICP-MS is not free from interferences, the two most important of which are isobaric ions and polyatomic ions.
Isobaric Ions. Iso- means same and -baric means weight; thus, isobaric means same weight and refers to two (or more) species that have—within the resolution of the mass spectrometer—identical weights and that both contribute to the same peak in the mass spectrum. The source of this interference is the existence of isotopes. For example, the most abundant ions for argon and for calcium are 40Ar and 40Ca, and, given the resolving power of a quadrupole mass analyzer, the two ions appear as a single peak at \(m/z = 40\) even though the mass of 40Ar is 39.962383 amu and the mass of 40Ca is 39.962591 amu. We can correct for this interference because the second most abundant isotope of calcium, 44Ca, does not share a \(m/z\) with argon (or with another element). Figure \(\PageIndex{3}\) shows the ICP-MS spectrum for a sample that contains calcium and argon, and Example \(\PageIndex{1}\) shows how we can use this spectrum to determine the contribution of each element.

For the spectrum in Figure \(\PageIndex{3}\), the intensity at \(m/z = 40\) is 972.07 cps and the intensity at \(m/z = 44\) is 18.77 cps. Given that the istopic abundance of 40Ca is 96.941% and the isotopic abundance of 44Ca is 2.086%, what is the counts-per-second at \(m/z = 40\) for Ca and for Ar.
Solution
Given that only 44Ca contributes to the peak at \(m/z = 44\) we can use the relative abundances of 40Ca and 44Ca to determine the expected contribution of 40Ca to the total intensity at \(m/z = 40\).
\[18.77 \text{ cps} \times \frac{96.941}{2.086} = 872.28 \text{ cps} \nonumber \]
Subtracting this result from the total intensity gives the intensity at \(m/z = 40\) for argon as
\[972.07 \text{ cps} - 872.28 \text{ cps} = 99.79 \text{ cps} \nonumber \]
Polyatomic Ions. Compensating for isobaric ions is relatively straightforward because we can rely on the known isotopic abundances of the elements. A more difficult problem is an interference between the isotope of an elemental analyte and a polyatomic ion that has the same mass. Such polyatomic ions may arise from the sample's matrix or from the plasma. For example, the ion 40Ar16O+ has a mass-to-charge ratio of 56, which overlaps with peak for 56Fe, the most abundant isotope of iron. Although we could choose to monitor iron at a different mass-to-charge ratio, we will lose sensitivity as we are using a less abundant isotope. Corrections can be made using the method outlined in Example \(\PageIndex{1}\), although it may require using multiple peaks, which increases the uncertainty of the final result.
Matrix Effects
A matrix effect occurs when the sample's matrix affects the relationship between the signal and the concentration of the analyte. Matrix effects are common in ICP-MS and may lead to either a suppression or an enhancement in the signal. Although not always well understood, matrix effects likely result from how easily an ionizable element affects the ability to ionize other elements. Matrix matching, using the method of standard additions, or using an internal standard can help minimize matrix effects for quantitative work.
Applications of ICP-MS
ICP-MS finds application for analytes in a wide variety of matrices, including both solutions and solids. Solution samples with high concentrations of dissolved ions may present problems due to the deposition of the salts onto the sampler and skimmer cones, which reduces the size of the pinhole that provides entry into the interface between the ICP torch and the mass spectrometer. The use of laser ablation makes it possible to analyzer surfaces—such as glasses, metals, and ceramics—without additional sample preparation.
Qualitative and Semiquantitative Applications. One of the strengths of ICP-MS is its ability to provide a survey scan, such as that in Figure \(\PageIndex{1}\), that allows for the identification of the elements present in a sample. Analysis of a single sample that contains known concentrations of these elements is suitable for providing a rough estimate of their concentration in the sample.
Quantitative Analysis. For a more accurate and precise quantitative analysis, one can prepare multiple external standards and prepare a calibration curve. Linearly across approximately six orders of magnitude with detection limits of less than 1 ppb. Including an internal standard in the external standards can help reduce matrix effects. The ideal internal standard will not produce isobaric ions and its primary ionization potential should be similar to that for the analyte; when working with several analytes, it may be necessary to choose a different internal standard for each analyte.
Isotope Ratios. An important advantage of ICP-MS over other analytical methods is its ability to monitor multiple isotopes for a single element.