10.4: Atomic Absorption Spectroscopy
- Page ID
- 157675
\( \newcommand{\vecs}[1]{\overset { \scriptstyle \rightharpoonup} {\mathbf{#1}} } \)
\( \newcommand{\vecd}[1]{\overset{-\!-\!\rightharpoonup}{\vphantom{a}\smash {#1}}} \)
\( \newcommand{\id}{\mathrm{id}}\) \( \newcommand{\Span}{\mathrm{span}}\)
( \newcommand{\kernel}{\mathrm{null}\,}\) \( \newcommand{\range}{\mathrm{range}\,}\)
\( \newcommand{\RealPart}{\mathrm{Re}}\) \( \newcommand{\ImaginaryPart}{\mathrm{Im}}\)
\( \newcommand{\Argument}{\mathrm{Arg}}\) \( \newcommand{\norm}[1]{\| #1 \|}\)
\( \newcommand{\inner}[2]{\langle #1, #2 \rangle}\)
\( \newcommand{\Span}{\mathrm{span}}\)
\( \newcommand{\id}{\mathrm{id}}\)
\( \newcommand{\Span}{\mathrm{span}}\)
\( \newcommand{\kernel}{\mathrm{null}\,}\)
\( \newcommand{\range}{\mathrm{range}\,}\)
\( \newcommand{\RealPart}{\mathrm{Re}}\)
\( \newcommand{\ImaginaryPart}{\mathrm{Im}}\)
\( \newcommand{\Argument}{\mathrm{Arg}}\)
\( \newcommand{\norm}[1]{\| #1 \|}\)
\( \newcommand{\inner}[2]{\langle #1, #2 \rangle}\)
\( \newcommand{\Span}{\mathrm{span}}\) \( \newcommand{\AA}{\unicode[.8,0]{x212B}}\)
\( \newcommand{\vectorA}[1]{\vec{#1}} % arrow\)
\( \newcommand{\vectorAt}[1]{\vec{\text{#1}}} % arrow\)
\( \newcommand{\vectorB}[1]{\overset { \scriptstyle \rightharpoonup} {\mathbf{#1}} } \)
\( \newcommand{\vectorC}[1]{\textbf{#1}} \)
\( \newcommand{\vectorD}[1]{\overrightarrow{#1}} \)
\( \newcommand{\vectorDt}[1]{\overrightarrow{\text{#1}}} \)
\( \newcommand{\vectE}[1]{\overset{-\!-\!\rightharpoonup}{\vphantom{a}\smash{\mathbf {#1}}}} \)
\( \newcommand{\vecs}[1]{\overset { \scriptstyle \rightharpoonup} {\mathbf{#1}} } \)
\( \newcommand{\vecd}[1]{\overset{-\!-\!\rightharpoonup}{\vphantom{a}\smash {#1}}} \)
\(\newcommand{\avec}{\mathbf a}\) \(\newcommand{\bvec}{\mathbf b}\) \(\newcommand{\cvec}{\mathbf c}\) \(\newcommand{\dvec}{\mathbf d}\) \(\newcommand{\dtil}{\widetilde{\mathbf d}}\) \(\newcommand{\evec}{\mathbf e}\) \(\newcommand{\fvec}{\mathbf f}\) \(\newcommand{\nvec}{\mathbf n}\) \(\newcommand{\pvec}{\mathbf p}\) \(\newcommand{\qvec}{\mathbf q}\) \(\newcommand{\svec}{\mathbf s}\) \(\newcommand{\tvec}{\mathbf t}\) \(\newcommand{\uvec}{\mathbf u}\) \(\newcommand{\vvec}{\mathbf v}\) \(\newcommand{\wvec}{\mathbf w}\) \(\newcommand{\xvec}{\mathbf x}\) \(\newcommand{\yvec}{\mathbf y}\) \(\newcommand{\zvec}{\mathbf z}\) \(\newcommand{\rvec}{\mathbf r}\) \(\newcommand{\mvec}{\mathbf m}\) \(\newcommand{\zerovec}{\mathbf 0}\) \(\newcommand{\onevec}{\mathbf 1}\) \(\newcommand{\real}{\mathbb R}\) \(\newcommand{\twovec}[2]{\left[\begin{array}{r}#1 \\ #2 \end{array}\right]}\) \(\newcommand{\ctwovec}[2]{\left[\begin{array}{c}#1 \\ #2 \end{array}\right]}\) \(\newcommand{\threevec}[3]{\left[\begin{array}{r}#1 \\ #2 \\ #3 \end{array}\right]}\) \(\newcommand{\cthreevec}[3]{\left[\begin{array}{c}#1 \\ #2 \\ #3 \end{array}\right]}\) \(\newcommand{\fourvec}[4]{\left[\begin{array}{r}#1 \\ #2 \\ #3 \\ #4 \end{array}\right]}\) \(\newcommand{\cfourvec}[4]{\left[\begin{array}{c}#1 \\ #2 \\ #3 \\ #4 \end{array}\right]}\) \(\newcommand{\fivevec}[5]{\left[\begin{array}{r}#1 \\ #2 \\ #3 \\ #4 \\ #5 \\ \end{array}\right]}\) \(\newcommand{\cfivevec}[5]{\left[\begin{array}{c}#1 \\ #2 \\ #3 \\ #4 \\ #5 \\ \end{array}\right]}\) \(\newcommand{\mattwo}[4]{\left[\begin{array}{rr}#1 \amp #2 \\ #3 \amp #4 \\ \end{array}\right]}\) \(\newcommand{\laspan}[1]{\text{Span}\{#1\}}\) \(\newcommand{\bcal}{\cal B}\) \(\newcommand{\ccal}{\cal C}\) \(\newcommand{\scal}{\cal S}\) \(\newcommand{\wcal}{\cal W}\) \(\newcommand{\ecal}{\cal E}\) \(\newcommand{\coords}[2]{\left\{#1\right\}_{#2}}\) \(\newcommand{\gray}[1]{\color{gray}{#1}}\) \(\newcommand{\lgray}[1]{\color{lightgray}{#1}}\) \(\newcommand{\rank}{\operatorname{rank}}\) \(\newcommand{\row}{\text{Row}}\) \(\newcommand{\col}{\text{Col}}\) \(\renewcommand{\row}{\text{Row}}\) \(\newcommand{\nul}{\text{Nul}}\) \(\newcommand{\var}{\text{Var}}\) \(\newcommand{\corr}{\text{corr}}\) \(\newcommand{\len}[1]{\left|#1\right|}\) \(\newcommand{\bbar}{\overline{\bvec}}\) \(\newcommand{\bhat}{\widehat{\bvec}}\) \(\newcommand{\bperp}{\bvec^\perp}\) \(\newcommand{\xhat}{\widehat{\xvec}}\) \(\newcommand{\vhat}{\widehat{\vvec}}\) \(\newcommand{\uhat}{\widehat{\uvec}}\) \(\newcommand{\what}{\widehat{\wvec}}\) \(\newcommand{\Sighat}{\widehat{\Sigma}}\) \(\newcommand{\lt}{<}\) \(\newcommand{\gt}{>}\) \(\newcommand{\amp}{&}\) \(\definecolor{fillinmathshade}{gray}{0.9}\)Guystav Kirchoff and Robert Bunsen first used atomic absorption—along with atomic emission—in 1859 and 1860 as a means for identify atoms in flames and hot gases. Although atomic emission continued to develop as an analytical technique, progress in atomic absorption languished for almost a century. Modern atomic absorption spectroscopy has its beginnings in 1955 as a result of the independent work of A. C. Walsh and C. T. J. Alkemade [(a) Walsh, A. Anal. Chem. 1991, 63, 933A–941A; (b) Koirtyohann, S. R. Anal. Chem. 1991, 63, 1024A–1031A; (c) Slavin, W. Anal. Chem. 1991, 63, 1033A–1038A]. Commercial instruments were in place by the early 1960s, and the importance of atomic absorption as an analytical technique soon was evident.
Instrumentation
Atomic absorption spectrophotometers use the same single-beam or double-beam optics described earlier for molecular absorption spectrophotometers (see Figure 10.3.2 and Figure 10.3.3). There is, however, an important additional need in atomic absorption spectroscopy: we first must covert the analyte into free atoms. In most cases the analyte is in solution form. If the sample is a solid, then we must bring the analyte into solution before the analysis. When analyzing a lake sediment for Cu, Zn, and Fe, for example, we bring the analytes into solution as Cu2+, Zn2+, and Fe3+ by extracting them with a suitable reagent. For this reason, only the introduction of solution samples is considered in this chapter.
What reagent we choose to use to bring an analyte into solution depends on our research goals. If we need to know the total amount of metal in the sediment, then we might try a microwave digestion using a mixture of concentrated acids, such as HNO3, HCl, and HF. This destroys the sediment’s matrix and brings everything into solution. On the other hand, if our interest is biologically available metals, we might extract the sample under milder conditions using, for example, a dilute solution of HCl or CH3COOH at room temperature.
Atomization
The process of converting an analyte to a free gaseous atom is called atomization. Converting an aqueous analyte into a free atom requires that we strip away the solvent, volatilize the analyte, and, if necessary, dissociate the analyte into free atoms. Desolvating an aqueous solution of CuCl2, for example, leaves us with solid particulates of CuCl2. Converting the particulate CuCl2 to gas phases atoms of Cu and Cl requires thermal energy.
\[\mathrm{CuCl}_{2}(a q) \rightarrow \mathrm{CuCl}_{2}(s) \rightarrow \mathrm{Cu}(g)+2 \mathrm{Cl}(g) \nonumber\]
There are two common atomization methods: flame atomization and electrothermal atomization, although a few elements are atomized using other methods.
Flame Atomizer
Figure 10.4.1 shows a typical flame atomization assembly with close-up views of several key components. In the unit shown here, the aqueous sample is drawn into the assembly by passing a high-pressure stream of compressed air past the end of a capillary tube immersed in the sample. When the sample exits the nebulizer it strikes a glass impact bead, which converts it into a fine aerosol mist within the spray chamber. The aerosol mist is swept through the spray chamber by the combustion gases—compressed air and acetylene in this case—to the burner head where the flame’s thermal energy desolvates the aerosol mist to a dry aerosol of small, solid particulates. The flame’s thermal energy then volatilizes the particles, producing a vapor that consists of molecular species, ionic species, and free atoms.
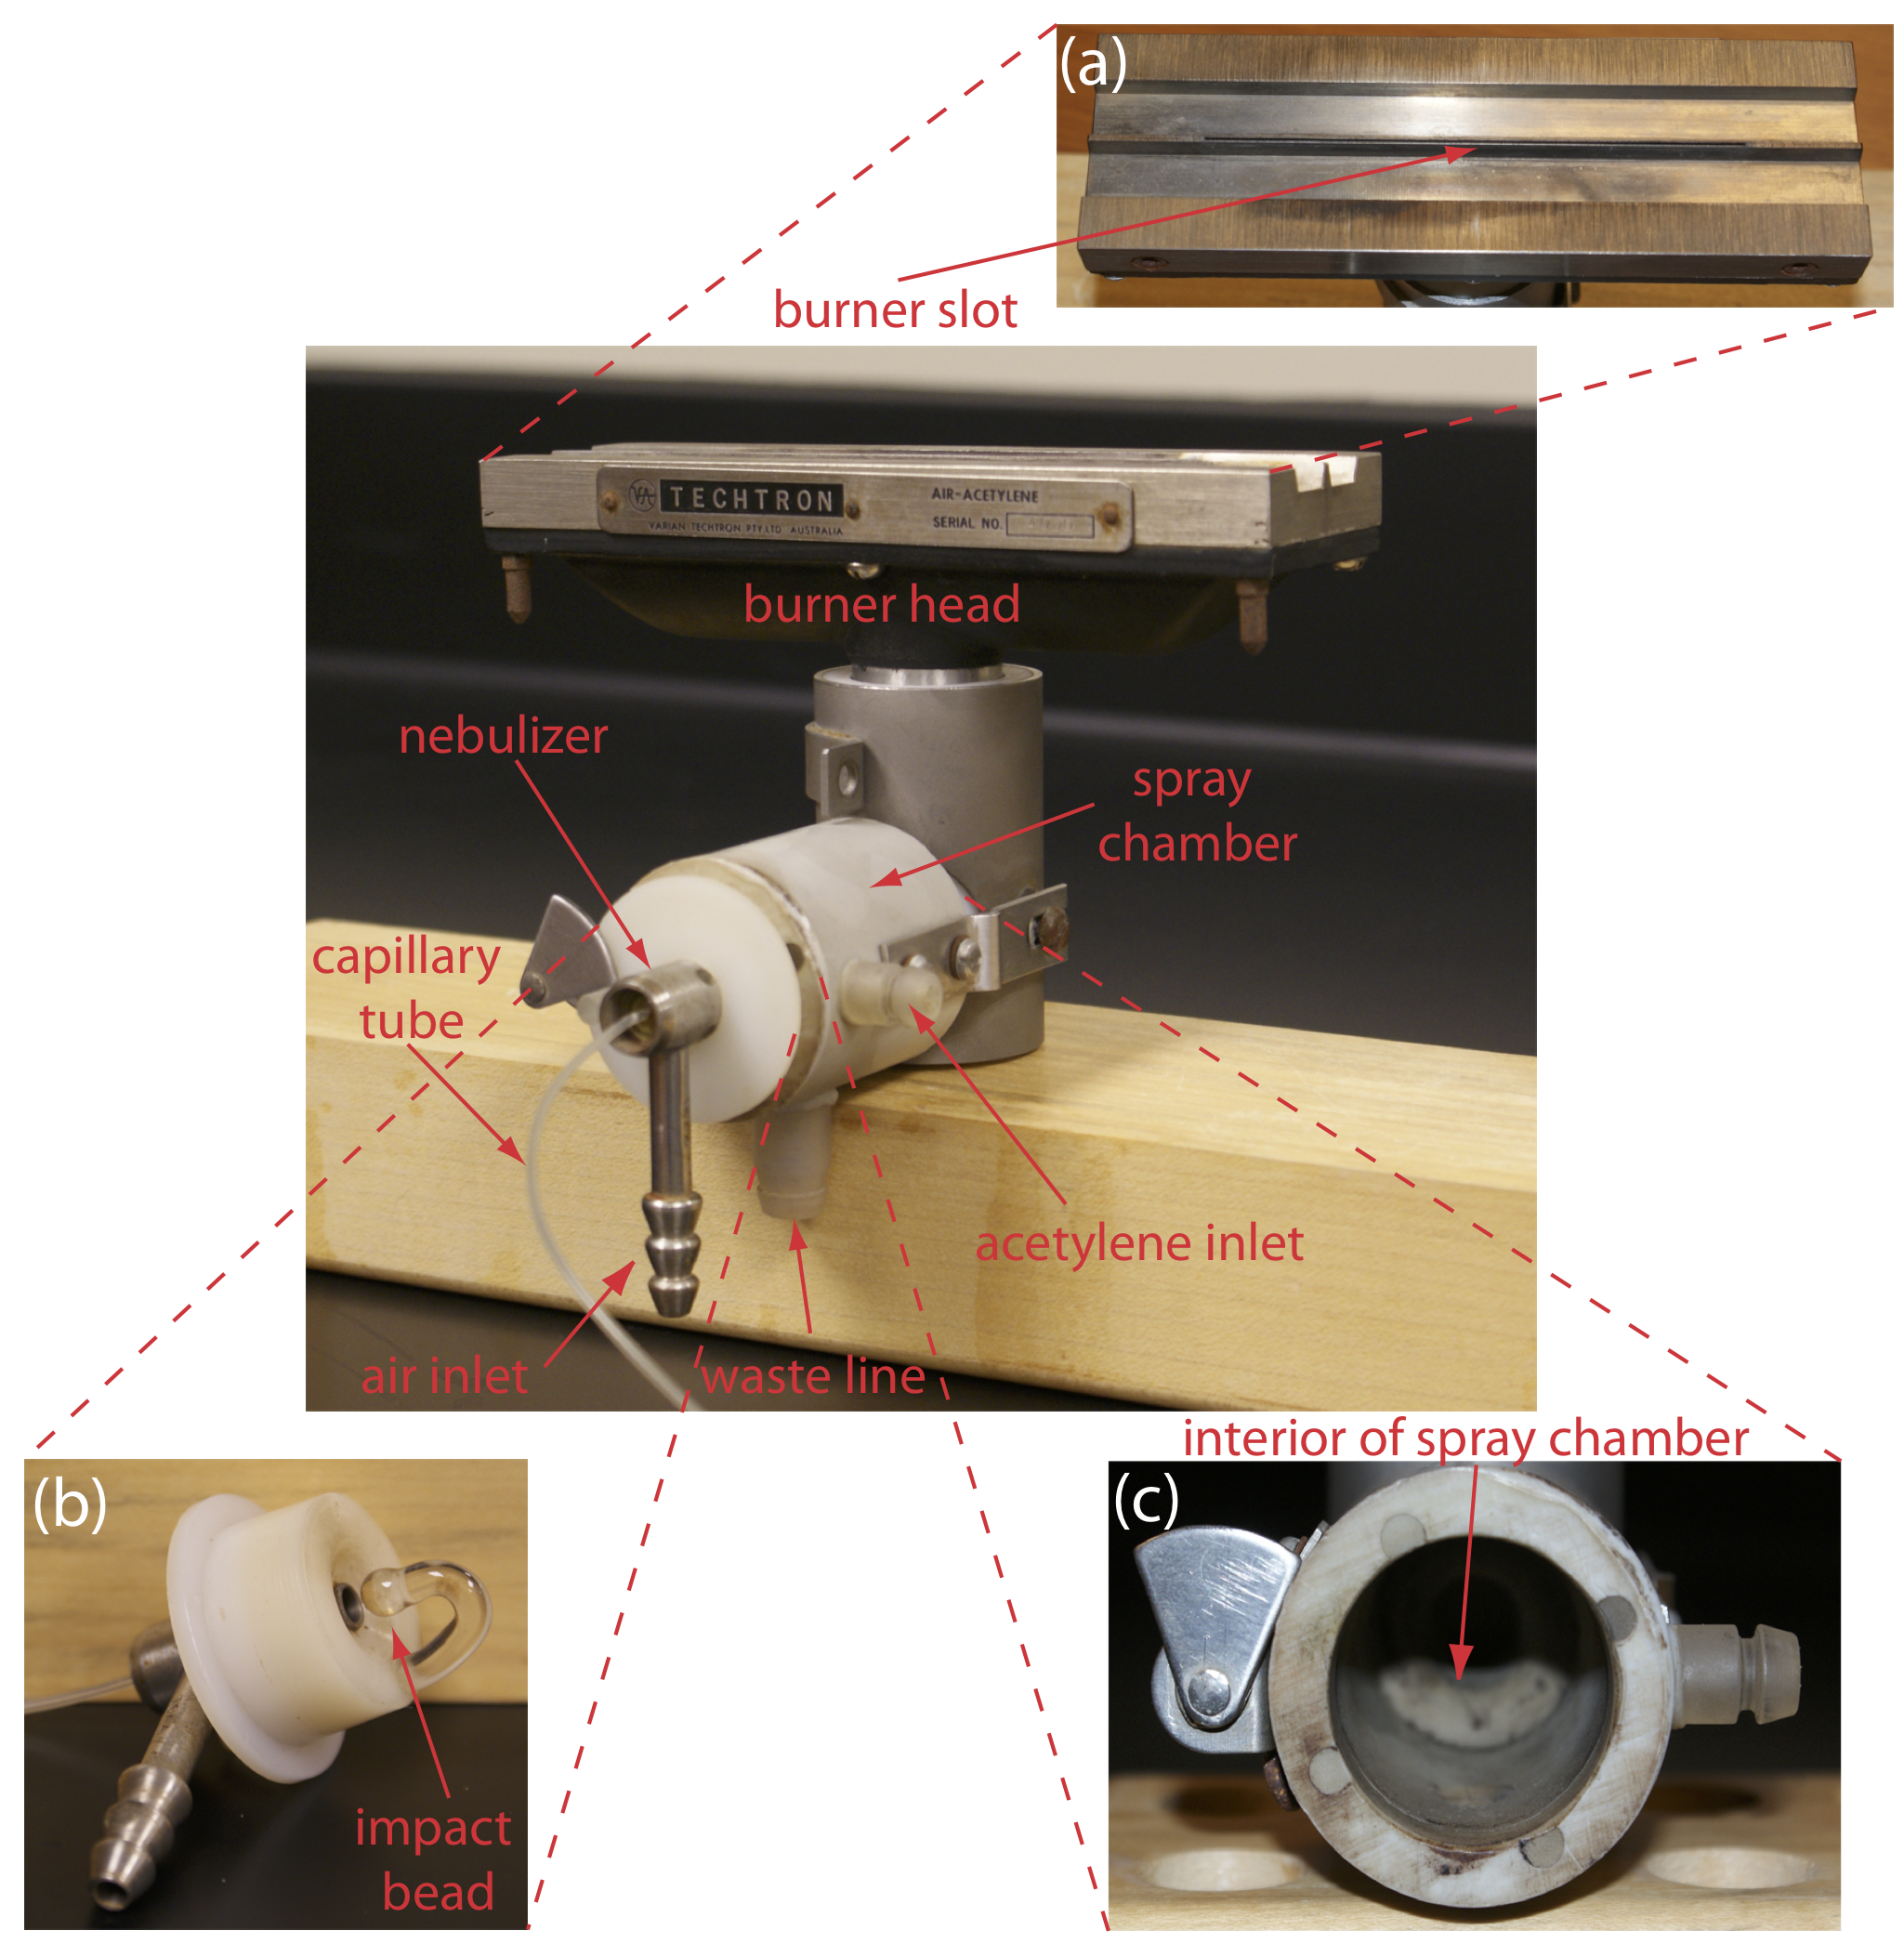
Burner. The slot burner in Figure 10.4.1 a provides a long optical pathlength and a stable flame. Because absorbance is directly proportional to pathlength, a long pathlength provides greater sensitivity. A stable flame minimizes uncertainty due to fluctuations in the flame.
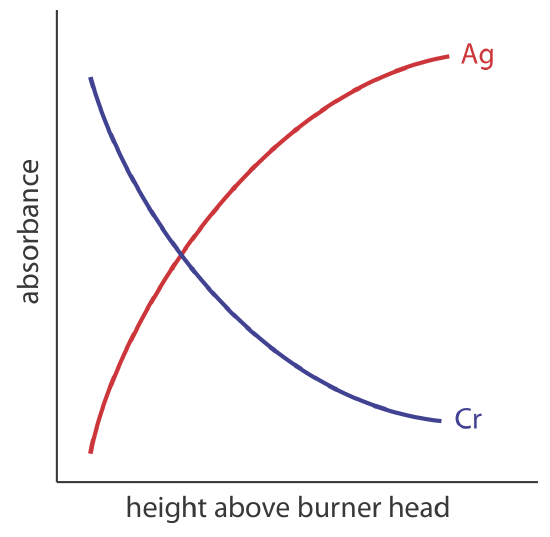
The burner is mounted on an adjustable stage that allows the entire assembly to move horizontally and vertically. Horizontal adjustments ensure the flame is aligned with the instrument’s optical path. Vertical adjustments change the height within the flame from which absorbance is monitored. This is important because two competing processes affect the concentration of free atoms in the flame. The more time an analyte spends in the flame the greater the atomization efficiency; thus, the production of free atoms increases with height. On the other hand, a longer residence time allows more opportunity for the free atoms to combine with oxygen to form a molecular oxide. As seen in Figure 10.4.2 , for a metal this is easy to oxidize, such as Cr, the concentration of free atoms is greatest just above the burner head. For a metal, such as Ag, which is difficult to oxidize, the concentration of free atoms increases steadily with height.
Flame. The flame’s temperature, which affects the efficiency of atomization, depends on the fuel–oxidant mixture, several examples of which are listed in Table 10.4.1 . Of these, the air–acetylene and the nitrous oxide–acetylene flames are the most popular. Normally the fuel and oxidant are mixed in an approximately stoichiometric ratio; however, a fuel-rich mixture may be necessary for easily oxidized analytes.
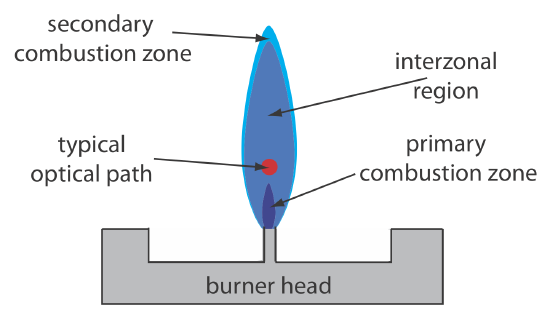
Figure 10.4.3 shows a cross-section through the flame, looking down the source radiation’s optical path. The primary combustion zone usually is rich in gas combustion products that emit radiation, limiting is useful- ness for atomic absorption. The interzonal region generally is rich in free atoms and provides the best location for measuring atomic absorption. The hottest part of the flame typically is 2–3 cm above the primary combustion zone. As atoms approach the flame’s secondary combustion zone, the decrease in temperature allows for formation of stable molecular species.
Sample Introduction. The most common means for introducing a sample into a flame atomizer is a continuous aspiration in which the sample flows through the burner while we monitor absorbance. Continuous aspiration is sample intensive, typically requiring from 2–5 mL of sample.
Flame microsampling allows us to introduce a discrete sample of fixed volume, and is useful if we have a limited amount of sample or when the sample’s matrix is incompatible with the flame atomizer. For example, continuously aspirating a sample that has a high concentration of dissolved solids—sea water, for example, comes to mind—may build-up a solid de- posit on the burner head that obstructs the flame and that lowers the absorbance. Flame microsampling is accomplished using a micropipet to place 50–250 μL of sample in a Teflon funnel connected to the nebulizer, or by dipping the nebulizer tubing into the sample for a short time. Dip sampling usually is accomplished with an automatic sampler. The signal for flame microsampling is a transitory peak whose height or area is proportional to the amount of analyte that is injected.
Advantages and Disadvantages of Flame Atomization. The principal advantage of flame atomization is the reproducibility with which the sample is introduced into the spectrophotometer; a significant disadvantage is that the efficiency of atomization is quite poor. There are two reasons for poor atomization efficiency. First, the majority of the aerosol droplets produced during nebulization are too large to be carried to the flame by the combustion gases. Consequently, as much as 95% of the sample never reaches the flame, which is the reason for the waste line shown at the bottom of the spray chamber in Figure 10.4.1 . A second reason for poor atomization efficiency is that the large volume of combustion gases significantly dilutes the sample. Together, these contributions to the efficiency of atomization reduce sensitivity because the analyte’s concentration in the flame may be a factor of \(2.5 \times 10^{-6}\) less than that in solution [Ingle, J. D.; Crouch, S. R. Spectrochemical Analysis, Prentice-Hall: Englewood Cliffs, NJ, 1988; p. 275].
Electrothermal Atomizers
A significant improvement in sensitivity is achieved by using the resistive heating of a graphite tube in place of a flame. A typical electrothermal atomizer, also known as a graphite furnace, consists of a cylindrical graphite tube approximately 1–3 cm in length and 3–8 mm in diameter. As shown in Figure 10.4.4 , the graphite tube is housed in an sealed assembly that has an optically transparent window at each end. A continuous stream of inert gas is passed through the furnace, which protects the graphite tube from oxidation and removes the gaseous products produced during atomization. A power supply is used to pass a current through the graphite tube, resulting in resistive heating.
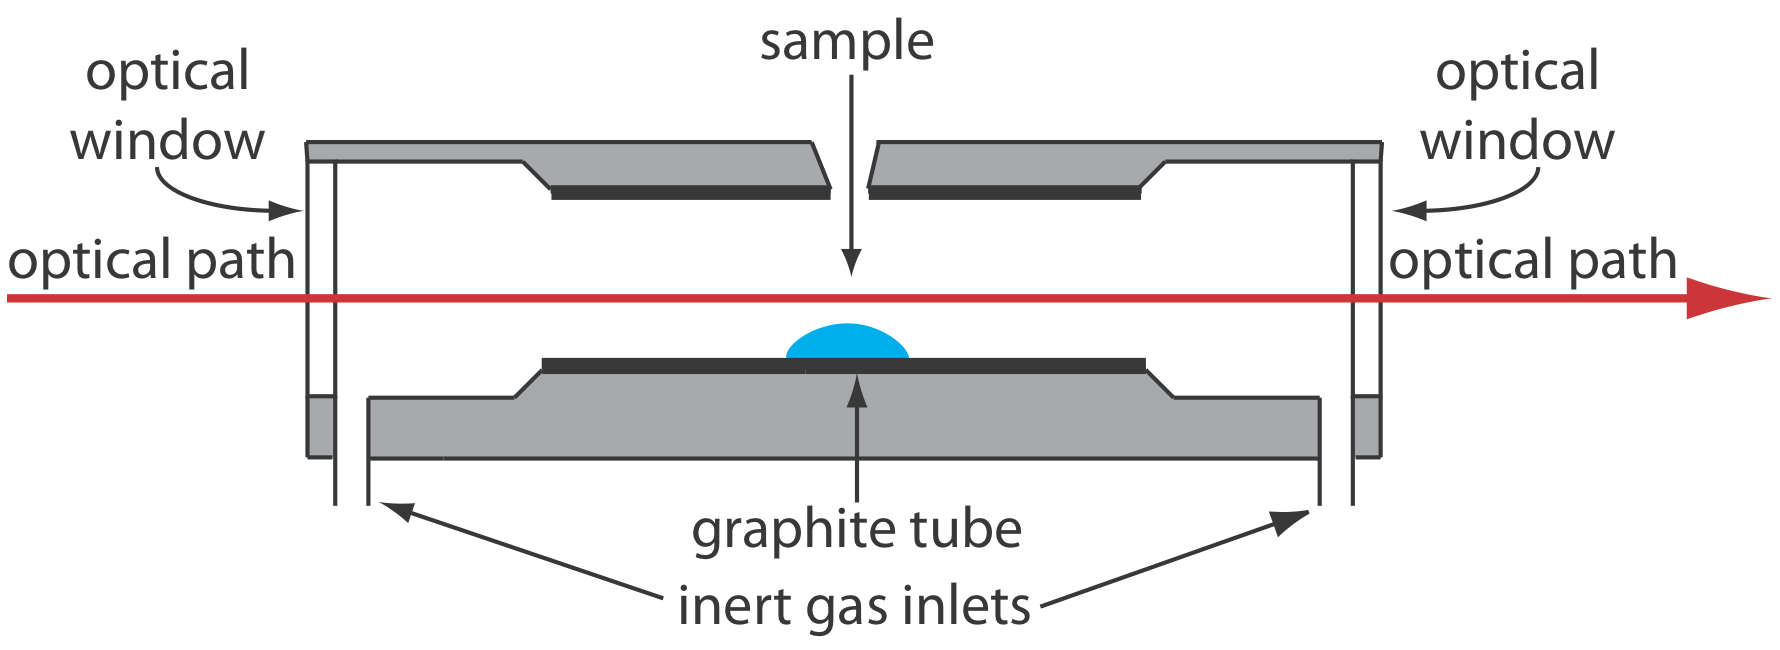
Samples of between 5–50 μL are injected into the graphite tube through a small hole at the top of the tube. Atomization is achieved in three stages. In the first stage the sample is dried to a solid residue using a current that raises the temperature of the graphite tube to about 110oC. In the second stage, which is called ashing, the temperature is increased to between 350–1200oC. At these temperatures organic material in the sample is converted to CO2 and H2O, and volatile inorganic materials are vaporized. These gases are removed by the inert gas flow. In the final stage the sample is atomized by rapidly increasing the temperature to between 2000–3000oC. The result is a transient absorbance peak whose height or area is proportional to the absolute amount of analyte injected into the graphite tube. Together, the three stages take approximately 45–90 s, with most of this time used for drying and ashing the sample.
Electrothermal atomization provides a significant improvement in sensitivity by trapping the gaseous analyte in the small volume within the graphite tube. The analyte’s concentration in the resulting vapor phase is as much as \(1000 \times\) greater than in a flame atomization [Parsons, M. L.; Major, S.; Forster, A. R. Appl. Spectrosc. 1983, 37, 411–418]. This improvement in sensitivity—and the resulting improvement in detection limits—is offset by a significant decrease in precision. Atomization efficiency is influenced strongly by the sample’s contact with the graphite tube, which is difficult to control reproducibly.
Miscellaneous Atomization Methods
A few elements are atomized by using a chemical reaction to produce a volatile product. Elements such as As, Se, Sb, Bi, Ge, Sn, Te, and Pb, for example, form volatile hydrides when they react with NaBH4 in the presence of acid. An inert gas carries the volatile hydride to either a flame or to a heated quartz observation tube situated in the optical path. Mercury is determined by the cold-vapor method in which it is reduced to elemental mercury with SnCl2. The volatile Hg is carried by an inert gas to an unheated observation tube situated in the instrument’s optical path.
Quantitative Applications
Atomic absorption is used widely for the analysis of trace metals in a variety of sample matrices. Using Zn as an example, there are standard atomic absorption methods for its determination in samples as diverse as water and wastewater, air, blood, urine, muscle tissue, hair, milk, breakfast cereals, shampoos, alloys, industrial plating baths, gasoline, oil, sediments, and rocks.
Developing a quantitative atomic absorption method requires several considerations, including choosing a method of atomization, selecting the wavelength and slit width, preparing the sample for analysis, minimizing spectral and chemical interferences, and selecting a method of standardization. Each of these topics is considered in this section.
Developing a Quantitative Method
Flame or Electrothermal Atomization? The most important factor in choosing a method of atomization is the analyte’s concentration. Because of its greater sensitivity, it takes less analyte to achieve a given absorbance when using electrothermal atomization. Table 10.4.2 , which compares the amount of analyte needed to achieve an absorbance of 0.20 when using flame atomization and electrothermal atomization, is useful when selecting an atomization method. For example, flame atomization is the method of choice if our samples contain 1–10 mg Zn2+/L, but electrothermal atomization is the best choice for samples that contain 1–10 μg Zn2+/L.
Selecting the Wavelength and Slit Width. The source for atomic absorption is a hollow cathode lamp that consists of a cathode and anode enclosed within a glass tube filled with a low pressure of an inert gas, such as Ne or Ar (Figure 10.4.5 ). Applying a potential across the electrodes ionizes the filler gas. The positively charged gas ions collide with the negatively charged cathode, sputtering atoms from the cathode’s surface. Some of the sputtered atoms are in the excited state and emit radiation characteristic of the metal(s) from which the cathode is manufactured. By fashioning the cathode from the metallic analyte, a hollow cathode lamp provides emission lines that correspond to the analyte’s absorption spectrum.
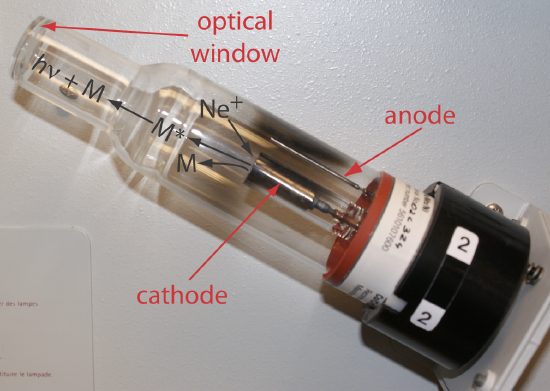
Because atomic absorption lines are narrow, we need to use a line source instead of a continuum source (compare, for example, Figure 10.2.4 with Figure 10.2.6). The effective bandwidth when using a continuum source is roughly \(1000 \times\) larger than an atomic absorption line; thus, PT ≈ P0, %T ≈ 100, and A ≈ 0. Because a hollow cathode lamp is a line source, PT and P0 have different values giving a %T < 100 and A > 0.
Each element in a hollow cathode lamp provides several atomic emission lines that we can use for atomic absorption. Usually the wavelength that provides the best sensitivity is the one we choose to use, although a less sensitive wavelength may be more appropriate for a sample that has higher concentration of analyte. For the Cr hollow cathode lamp in Table 10.4.3 , the best sensitivity is obtained using a wavelength of 357.9 nm.
Another consideration is the emission line's intensity. If several emission lines meet our requirements for sensitivity, we may wish to use the emission line with the largest relative P0 because there is less uncertainty in measuring P0 and PT. When analyzing a sample that is ≈10 mg Cr/L, for example, the first three wavelengths in Table 10.4.3 provide an appropriate sensitivity; the wavelengths of 425.4 nm and 429.0 nm, however, have a greater P0 and will provide less uncertainty in the measured absorbance.
The emission spectrum for a hollow cathode lamp includes, in addition to the analyte's emission lines, additional emission lines from impurities present in the metallic cathode and from the filler gas. These additional lines are a potential source of stray radiation that could result in an instrumental deviation from Beer’s law. The monochromator’s slit width is set as wide as possible to improve the throughput of radiation and narrow enough to eliminate these sources of stray radiation.
Preparing the Sample. Flame and electrothermal atomization require that the analyte is in solution. Solid samples are brought into solution by dissolving in an appropriate solvent. If the sample is not soluble it is digested, either on a hot-plate or by microwave, using HNO3, H2SO4, or HClO4. Alternatively, we can extract the analyte using a Soxhlet extractor. Liquid samples are analyzed directly or the analytes extracted if the matrix is in- compatible with the method of atomization. A serum sample, for instance, is difficult to aspirate when using flame atomization and may produce an unacceptably high background absorbance when using electrothermal atomization. A liquid–liquid extraction using an organic solvent and a chelating agent frequently is used to concentrate analytes. Dilute solutions of Cd2+, Co2+, Cu2+, Fe3+, Pb2+, Ni2+, and Zn2+, for example, are concentrated by extracting with a solution of ammonium pyrrolidine dithiocarbamate in methyl isobutyl ketone.
Minimizing Spectral Interference. A spectral interference occurs when an analyte’s absorption line overlaps with an interferent’s absorption line or band. Because they are so narrow, the overlap of two atomic absorption lines seldom is a problem. On the other hand, a molecule’s broad absorption band or the scattering of source radiation is a potentially serious spectral interference.
An important consideration when using a flame as an atomization source is its effect on the measured absorbance. Among the products of combustion are molecular species that exhibit broad absorption bands and particulates that scatter radiation from the source. If we fail to compensate for these spectral interferences, then the intensity of transmitted radiation is smaller than expected. The result is an apparent increase in the sample’s absorbance. Fortunately, absorption and scattering of radiation by the flame are corrected by analyzing a blank.
Spectral interferences also occur when components of the sample’s matrix other than the analyte react to form molecular species, such as oxides and hydroxides. The resulting absorption and scattering constitutes the sample’s background and may present a significant problem, particularly at wavelengths below 300 nm where the scattering of radiation becomes more important. If we know the composition of the sample’s matrix, then we can prepare our samples using an identical matrix. In this case the background absorption is the same for both the samples and the standards. Alternatively, if the background is due to a known matrix component, then we can add that component in excess to all samples and standards so that the contribution of the naturally occurring interferent is insignificant. Finally, many interferences due to the sample’s matrix are eliminated by increasing the atomization temperature. For example, switching to a higher temperature flame helps prevents the formation of interfering oxides and hydroxides.
If the identity of the matrix interference is unknown, or if it is not possible to adjust the flame or furnace conditions to eliminate the interference, then we must find another method to compensate for the background interference. Several methods have been developed to compensate for matrix interferences, and most atomic absorption spectrophotometers include one or more of these methods.
One of the most common methods for background correction is to use a continuum source, such as a D2 lamp. Because a D2 lamp is a continuum source, absorbance of its radiation by the analyte’s narrow absorption line is negligible. Only the background, therefore, absorbs radiation from the D2 lamp. Both the analyte and the background, on the other hand, absorb the hollow cathode’s radiation. Subtracting the absorbance for the D2 lamp from that for the hollow cathode lamp gives a corrected absorbance that compensates for the background interference. Although this method of background correction is effective, it does assume that the background absorbance is constant over the range of wavelengths passed by the monochromator. If this is not true, then subtracting the two absorbances underestimates or overestimates the background.
Other methods of background correction have been developed, including Zeeman effect background correction and Smith–Hieftje background correction, both of which are included in some commercially available atomic absorption spectrophotometers. Consult the chapter’s additional resources for additional information.
Minimizing Chemical Interferences. The quantitative analysis of some elements is complicated by chemical interferences that occur during atomization. The most common chemical interferences are the formation of nonvolatile compounds that contain the analyte and ionization of the analyte.
One example of the formation of a nonvolatile compound is the effect of \(\text{PO}_4^{3-}\) or Al3+ on the flame atomic absorption analysis of Ca2+. In one study, for example, adding 100 ppm Al3+ to a solution of 5 ppm Ca2+ decreased calcium ion’s absorbance from 0.50 to 0.14, while adding 500 ppm \(\text{PO}_4^{3-}\) to a similar solution of Ca2+ decreased the absorbance from 0.50 to 0.38. These interferences are attributed to the formation of nonvolatile particles of Ca3(PO4)2 and an Al–Ca–O oxide [Hosking, J. W.; Snell, N. B.; Sturman, B. T. J. Chem. Educ. 1977, 54, 128–130].
When using flame atomization, we can minimize the formation of non-volatile compounds by increasing the flame’s temperature by changing the fuel-to-oxidant ratio or by switching to a different combination of fuel and oxidant. Another approach is to add a releasing agent or a protecting agent to the sample. A releasing agent is a species that reacts preferentially with the interferent, releasing the analyte during atomization. For example, Sr2+ and La3+ serve as releasing agents for the analysis of Ca2+ in the presence of \(\text{PO}_4^{3-}\) or Al3+. Adding 2000 ppm SrCl2 to the Ca2+/ \(\text{PO}_4^{3-}\) and to the Ca2+/Al3+ mixtures described in the previous paragraph increased the absorbance to 0.48. A protecting agent reacts with the analyte to form a stable volatile complex. Adding 1% w/w EDTA to the Ca2+/ \(\text{PO}_4^{3-}\) solution described in the previous paragraph increased the absorbance to 0.52.
An ionization interference occurs when thermal energy from the flame or the electrothermal atomizer is sufficient to ionize the analyte
\[\mathrm{M}(s)\rightleftharpoons \ \mathrm{M}^{+}(a q)+e^{-} \label{10.1}\]
where M is the analyte. Because the absorption spectra for M and M+ are different, the position of the equilibrium in reaction \ref{10.1} affects the absorbance at wavelengths where M absorbs. To limit ionization we add a high concentration of an ionization suppressor, which is a species that ionizes more easily than the analyte. If the ionization suppressor's concentration is sufficient, then the increased concentration of electrons in the flame pushes reaction \ref{10.1} to the left, preventing the analyte’s ionization. Potassium and cesium frequently are used as an ionization suppressor because of their low ionization energy.
Standardizing the Method. Because Beer’s law also applies to atomic absorption, we might expect atomic absorption calibration curves to be linear. In practice, however, most atomic absorption calibration curves are nonlinear or linear over a limited range of concentrations. Nonlinearity in atomic absorption is a consequence of instrumental limitations, including stray radiation from the hollow cathode lamp and the variation in molar absorptivity across the absorption line. Accurate quantitative work, therefore, requires a suitable means for computing the calibration curve from a set of standards.
When possible, a quantitative analysis is best conducted using external standards. Unfortunately, matrix interferences are a frequent problem, particularly when using electrothermal atomization. For this reason the method of standard additions often is used. One limitation to this method of standardization, however, is the requirement of a linear relationship between absorbance and concentration.
Most instruments include several different algorithms for computing the calibration curve. The instrument in my lab, for example, includes five algorithms. Three of the algorithms fit absorbance data using linear, quadratic, or cubic polynomial functions of the analyte’s concentration. It also includes two algorithms that fit the concentrations of the standards to quadratic functions of the absorbance.
Representative Method 10.4.1: Determination of Cu and Zn in Tissue Samples
The best way to appreciate the theoretical and the practical details discussed in this section is to carefully examine a typical analytical method. Although each method is unique, the following description of the determination of Cu and Zn in biological tissues provides an instructive example of a typical procedure. The description here is based on Bhattacharya, S. K.; Goodwin, T. G.; Crawford, A. J. Anal. Lett. 1984, 17, 1567–1593, and Crawford, A. J.; Bhattacharya, S. K. Varian Instruments at Work, Number AA–46, April 1985.
Description of Method.
Copper and zinc are isolated from tissue samples by digesting the sample with HNO3 after first removing any fatty tissue. The concentration of copper and zinc in the supernatant are determined by atomic absorption using an air-acetylene flame.
Procedure.
Tissue samples are obtained by a muscle needle biopsy and dried for 24–30 h at 105oC to remove all traces of moisture. The fatty tissue in a dried sample is removed by extracting overnight with anhydrous ether. After removing the ether, the sample is dried to obtain the fat-free dry tissue weight (FFDT). The sample is digested at 68oC for 20–24 h using 3 mL of 0.75 M HNO3. After centrifuging at 2500 rpm for 10 minutes, the supernatant is transferred to a 5-mL volumetric flask. The digestion is repeated two more times, for 2–4 hours each, using 0.9-mL aliquots of 0.75 M HNO3. These supernatants are added to the 5-mL volumetric flask, which is diluted to volume with 0.75 M HNO3. The concentrations of Cu and Zn in the diluted supernatant are determined by flame atomic absorption spectroscopy using an air-acetylene flame and external standards. Copper is analyzed at a wavelength of 324.8 nm with a slit width of 0.5 nm, and zinc is analyzed at 213.9 nm with a slit width of 1.0 nm. Background correction using a D2 lamp is necessary for zinc. Results are reported as μg of Cu or Zn per gram of FFDT.
Questions.
1. Describe the appropriate matrix for the external standards and for the blank?
The matrix for the standards and the blank should match the matrix of the samples; thus, an appropriate matrix is 0.75 M HNO3. Any interferences from other components of the sample matrix are minimized by background correction.
2. Why is a background correction necessary for the analysis of Zn, but not for the analysis of Cu?
Background correction compensates for background absorption and scattering due to interferents in the sample. Such interferences are most severe when using a wavelength less than 300 nm. This is the case for Zn, but not for Cu.
3. A Cu hollow cathode lamp has several emission lines, the properties of which are shown in the following table. Explain why this method uses the line at 324.8 nm.
| wavelength (nm) | slit width (nm) | mg Cu/L for A = 0.20 | P0 (relative) |
|---|---|---|---|
| 217.9 | 0.2 | 15 | 3 |
| 218.2 | 0.2 | 15 | 3 |
| 222.6 | 0.2 | 60 | 5 |
| 244.2 | 0.2 | 400 | 15 |
| 249.2 | 0.5 | 200 | 24 |
| 324.8 | 0.5 | 1.5 | 100 |
| 327.4 | 0.5 | 3 | 87 |
With 1.5 mg Cu/L giving an absorbance of 0.20, the emission line at 324.8 nm has the best sensitivity. In addition, it is the most intense emission line, which decreases the uncertainty in the measured absorbance.
To evaluate the method described in Representative Method 10.4.1, a series of external standard is prepared and analyzed, providing the results shown here [Crawford, A. J.; Bhattacharya, S. K. “Microanalysis of Copper and Zinc in Biopsy-Sized Tissue Specimens by Atomic Absorption Spectroscopy Using a Stoichiometric Air-Acetylene Flame,” Varian Instruments at Work, Number AA–46, April 1985].
| µg Cu/mL | absorbance | µg Cu/mL | absorbance |
|---|---|---|---|
| 0.000 | 0.000 | 0.500 | 0.033 |
| 0.100 | 0.006 | 0.600 | 0.039 |
| 0.200 | 0.013 | 0.700 | 0.046 |
| 0.300 | 0.020 | 1.00 | 0.066 |
| 0.400 | 0.026 |
A bovine liver standard reference material is used to evaluate the method’s accuracy. After drying and extracting the sample, a 11.23-mg FFDT tissue sample gives an absorbance of 0.023. Report the amount of copper in the sample as μg Cu/g FFDT.
Solution
Linear regression of absorbance versus the concentration of Cu in the standards gives the calibration curve shown below and the following calibration equation.
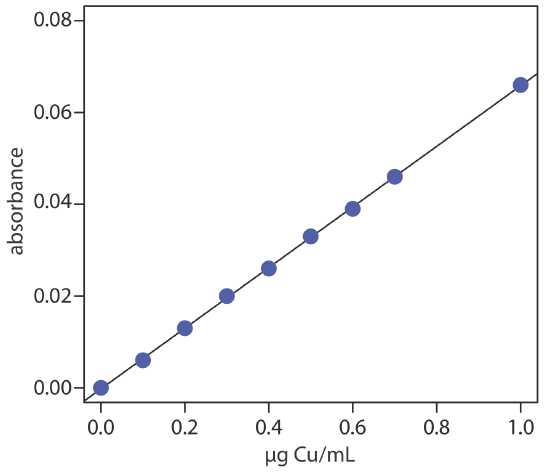
\[A=-0.0002+0.0661 \times \frac{\mu \mathrm{g} \ \mathrm{Cu}}{\mathrm{mL}} \nonumber\]
Substituting the sample’s absorbance into the calibration equation gives the concentration of copper as 0.351 μg/mL. The concentration of copper in the tissue sample, therefore, is
\[\frac { \frac{0.351 \mu \mathrm{g} \ \mathrm{Cu}}{\mathrm{mL}} \times 5.000 \ \mathrm{mL}} {0.01123 \text{ g sample}}=156 \ \mu \mathrm{g} \ \mathrm{Cu} / \mathrm{g} \ \mathrm{FDT} \nonumber\]
Evaluation of Atomic Absorption Spectroscopy
Scale of Operation
Atomic absorption spectroscopy is ideally suited for the analysis of trace and ultratrace analytes, particularly when using electrothermal atomization. For minor and major analytes, sample are diluted before the analysis. Most analyses use a macro or a meso sample. The small volume requirement for electrothermal atomization or for flame microsampling, however, makes practical the analysis of micro and ultramicro samples.
Accuracy
If spectral and chemical interferences are minimized, an accuracy of 0.5–5% is routinely attainable. When the calibration curve is nonlinear, accuracy is improved by using a pair of standards whose absorbances closely bracket the sample’s absorbance and assuming that the change in absorbance is linear over this limited concentration range. Determinate errors for electrothermal atomization often are greater than those obtained with flame atomization due to more serious matrix interferences.
Precision
For an absorbance greater than 0.1–0.2, the relative standard deviation for atomic absorption is 0.3–1% for flame atomization and 1–5% for electrothermal atomization. The principle limitation is the uncertainty in the concentration of free analyte atoms that result from variations in the rate of aspiration, nebulization, and atomization for a flame atomizer, and the consistency of injecting samples for electrothermal atomization.
Sensitivity
The sensitivity of a flame atomic absorption analysis is influenced by the flame’s composition and by the position in the flame from which we monitor the absorbance. Normally the sensitivity of an analysis is optimized by aspirating a standard solution of analyte and adjusting the fuel-to-oxidant ratio, the nebulizer flow rate, and the height of the burner, to give the greatest absorbance. With electrothermal atomization, sensitivity is influenced by the drying and ashing stages that precede atomization. The temperature and time at each stage is optimized for each type of sample.
Sensitivity also is influenced by the sample’s matrix. We already noted, for example, that sensitivity is decreased by a chemical interference. An increase in sensitivity may be realized by adding a low molecular weight alcohol, ester, or ketone to the solution, or by using an organic solvent.
Selectivity
Due to the narrow width of absorption lines, atomic absorption provides excellent selectivity. Atomic absorption is used for the analysis of over 60 elements at concentrations at or below the level of μg/L.
Time, Cost, and Equipment
The analysis time when using flame atomization is short, with sample throughputs of 250–350 determinations per hour when using a fully automated system. Electrothermal atomization requires substantially more time per analysis, with maximum sample throughputs of 20–30 determinations per hour. The cost of a new instrument ranges from between $10,000– $50,000 for flame atomization, and from $18,000–$70,000 for electrothermal atomization. The more expensive instruments in each price range include double-beam optics, automatic samplers, and can be programmed for multielemental analysis by allowing the wavelength and hollow cathode lamp to be changed automatically.


