
Introduction to Chromatography
- Page ID
- 283893

\( \newcommand{\vecs}[1]{\overset { \scriptstyle \rightharpoonup} {\mathbf{#1}} } \)
\( \newcommand{\vecd}[1]{\overset{-\!-\!\rightharpoonup}{\vphantom{a}\smash {#1}}} \)
\( \newcommand{\dsum}{\displaystyle\sum\limits} \)
\( \newcommand{\dint}{\displaystyle\int\limits} \)
\( \newcommand{\dlim}{\displaystyle\lim\limits} \)
\( \newcommand{\id}{\mathrm{id}}\) \( \newcommand{\Span}{\mathrm{span}}\)
( \newcommand{\kernel}{\mathrm{null}\,}\) \( \newcommand{\range}{\mathrm{range}\,}\)
\( \newcommand{\RealPart}{\mathrm{Re}}\) \( \newcommand{\ImaginaryPart}{\mathrm{Im}}\)
\( \newcommand{\Argument}{\mathrm{Arg}}\) \( \newcommand{\norm}[1]{\| #1 \|}\)
\( \newcommand{\inner}[2]{\langle #1, #2 \rangle}\)
\( \newcommand{\Span}{\mathrm{span}}\)
\( \newcommand{\id}{\mathrm{id}}\)
\( \newcommand{\Span}{\mathrm{span}}\)
\( \newcommand{\kernel}{\mathrm{null}\,}\)
\( \newcommand{\range}{\mathrm{range}\,}\)
\( \newcommand{\RealPart}{\mathrm{Re}}\)
\( \newcommand{\ImaginaryPart}{\mathrm{Im}}\)
\( \newcommand{\Argument}{\mathrm{Arg}}\)
\( \newcommand{\norm}[1]{\| #1 \|}\)
\( \newcommand{\inner}[2]{\langle #1, #2 \rangle}\)
\( \newcommand{\Span}{\mathrm{span}}\) \( \newcommand{\AA}{\unicode[.8,0]{x212B}}\)
\( \newcommand{\vectorA}[1]{\vec{#1}} % arrow\)
\( \newcommand{\vectorAt}[1]{\vec{\text{#1}}} % arrow\)
\( \newcommand{\vectorB}[1]{\overset { \scriptstyle \rightharpoonup} {\mathbf{#1}} } \)
\( \newcommand{\vectorC}[1]{\textbf{#1}} \)
\( \newcommand{\vectorD}[1]{\overrightarrow{#1}} \)
\( \newcommand{\vectorDt}[1]{\overrightarrow{\text{#1}}} \)
\( \newcommand{\vectE}[1]{\overset{-\!-\!\rightharpoonup}{\vphantom{a}\smash{\mathbf {#1}}}} \)
\( \newcommand{\vecs}[1]{\overset { \scriptstyle \rightharpoonup} {\mathbf{#1}} } \)
\(\newcommand{\longvect}{\overrightarrow}\)
\( \newcommand{\vecd}[1]{\overset{-\!-\!\rightharpoonup}{\vphantom{a}\smash {#1}}} \)
\(\newcommand{\avec}{\mathbf a}\) \(\newcommand{\bvec}{\mathbf b}\) \(\newcommand{\cvec}{\mathbf c}\) \(\newcommand{\dvec}{\mathbf d}\) \(\newcommand{\dtil}{\widetilde{\mathbf d}}\) \(\newcommand{\evec}{\mathbf e}\) \(\newcommand{\fvec}{\mathbf f}\) \(\newcommand{\nvec}{\mathbf n}\) \(\newcommand{\pvec}{\mathbf p}\) \(\newcommand{\qvec}{\mathbf q}\) \(\newcommand{\svec}{\mathbf s}\) \(\newcommand{\tvec}{\mathbf t}\) \(\newcommand{\uvec}{\mathbf u}\) \(\newcommand{\vvec}{\mathbf v}\) \(\newcommand{\wvec}{\mathbf w}\) \(\newcommand{\xvec}{\mathbf x}\) \(\newcommand{\yvec}{\mathbf y}\) \(\newcommand{\zvec}{\mathbf z}\) \(\newcommand{\rvec}{\mathbf r}\) \(\newcommand{\mvec}{\mathbf m}\) \(\newcommand{\zerovec}{\mathbf 0}\) \(\newcommand{\onevec}{\mathbf 1}\) \(\newcommand{\real}{\mathbb R}\) \(\newcommand{\twovec}[2]{\left[\begin{array}{r}#1 \\ #2 \end{array}\right]}\) \(\newcommand{\ctwovec}[2]{\left[\begin{array}{c}#1 \\ #2 \end{array}\right]}\) \(\newcommand{\threevec}[3]{\left[\begin{array}{r}#1 \\ #2 \\ #3 \end{array}\right]}\) \(\newcommand{\cthreevec}[3]{\left[\begin{array}{c}#1 \\ #2 \\ #3 \end{array}\right]}\) \(\newcommand{\fourvec}[4]{\left[\begin{array}{r}#1 \\ #2 \\ #3 \\ #4 \end{array}\right]}\) \(\newcommand{\cfourvec}[4]{\left[\begin{array}{c}#1 \\ #2 \\ #3 \\ #4 \end{array}\right]}\) \(\newcommand{\fivevec}[5]{\left[\begin{array}{r}#1 \\ #2 \\ #3 \\ #4 \\ #5 \\ \end{array}\right]}\) \(\newcommand{\cfivevec}[5]{\left[\begin{array}{c}#1 \\ #2 \\ #3 \\ #4 \\ #5 \\ \end{array}\right]}\) \(\newcommand{\mattwo}[4]{\left[\begin{array}{rr}#1 \amp #2 \\ #3 \amp #4 \\ \end{array}\right]}\) \(\newcommand{\laspan}[1]{\text{Span}\{#1\}}\) \(\newcommand{\bcal}{\cal B}\) \(\newcommand{\ccal}{\cal C}\) \(\newcommand{\scal}{\cal S}\) \(\newcommand{\wcal}{\cal W}\) \(\newcommand{\ecal}{\cal E}\) \(\newcommand{\coords}[2]{\left\{#1\right\}_{#2}}\) \(\newcommand{\gray}[1]{\color{gray}{#1}}\) \(\newcommand{\lgray}[1]{\color{lightgray}{#1}}\) \(\newcommand{\rank}{\operatorname{rank}}\) \(\newcommand{\row}{\text{Row}}\) \(\newcommand{\col}{\text{Col}}\) \(\renewcommand{\row}{\text{Row}}\) \(\newcommand{\nul}{\text{Nul}}\) \(\newcommand{\var}{\text{Var}}\) \(\newcommand{\corr}{\text{corr}}\) \(\newcommand{\len}[1]{\left|#1\right|}\) \(\newcommand{\bbar}{\overline{\bvec}}\) \(\newcommand{\bhat}{\widehat{\bvec}}\) \(\newcommand{\bperp}{\bvec^\perp}\) \(\newcommand{\xhat}{\widehat{\xvec}}\) \(\newcommand{\vhat}{\widehat{\vvec}}\) \(\newcommand{\uhat}{\widehat{\uvec}}\) \(\newcommand{\what}{\widehat{\wvec}}\) \(\newcommand{\Sighat}{\widehat{\Sigma}}\) \(\newcommand{\lt}{<}\) \(\newcommand{\gt}{>}\) \(\newcommand{\amp}{&}\) \(\definecolor{fillinmathshade}{gray}{0.9}\)Learning Objectives:
Students will be able to:
- Relate chromatographic bands in a column to the resulting chromatographic peaks
- Explain the role of the stationary phase and the mobile phase in the separation
- Explain the molecular-level origin of separation and the role of non-covalent interactions
- Define partition coefficient and retention factor
- Explain the stochastic origins of molecular diffusion and the resulting shape of chromatographic peaks
- Define retention time and width at half height for chromatographic peaks
- Explain and calculate theoretical plate height and plate number
- Explain the effects of flow rate on plate height (the van Deemter equation)
Session 1a: Separation of solutes in a chromatographic column
A two-component mixture has been placed on a chromatographic column packed with a non-polar stationary phase. Three snapshots in time show the progress of the two solutes, A and B, as they are flushed down the column with a polar mobile phase at a constant flow rate.
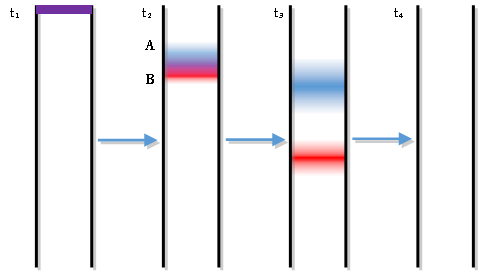
- Sketch the solute bands in the fourth snapshot
- Identify at least two changes that occur to the bands as they flow down the column.
- As the solutes leave the bottom of the column they flow past a detector that monitors their concentrations. For instance, a spectrometer could measure the absorbance of the solutes as they flow past it. A plot of the detector’s response as a function of time is known as a chromatogram. Sketch the expected chromatogram.
- Different solutes move down the column at different rates. The column in our example is packed with micrometer-sized silica (SiO2) particles bonded with octadecyl carbon chains (also known as C18) – a hydrophobic stationary phase.
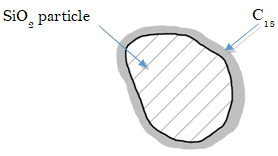
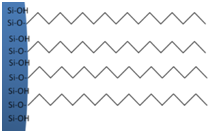
Predict which solute, A or B, is more polar. Explain. (remember that our mobile phase is polar)
- The partition coefficient is used to describe the equilibrium partitioning of a solute between the stationary phase and the mobile phase. It is defined as the ratio of moles of solute in the stationary phase and the mobile phase:
\[\mathrm{K_X = \dfrac{mol_S}{mol_M}}\nonumber\]
Write the generalized reaction that is described by the partition coefficient.
- Predict which solute has the higher KX. Explain.
- What is the purpose of the stationary phase?
Session 1b: Band Broadening
- The solute bands spread out as they flow down the column. The extent of broadening is effected by the flow rate of mobile phase. Consider a chromatographic band with the following concentration profile.
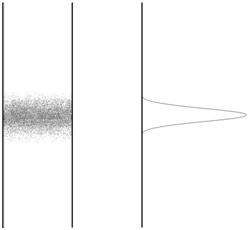
What would happen to this profile if the flow was stopped and the column was allowed to sit? Explain, on a molecular level, why this occurs.
- The phenomenon you described in (8) will also occur while the solute is carried down the column. Does this phenomenon, known as longitudinal diffusion, contribute more to band broadening at higher or lower flow rates? Explain.
- Would this phenomenon be more significant (i.e., happen faster) in the gas phase (gas chromatography) or liquid phase (liquid chromatography)? Explain.
- Consider molecules flowing through a packed bed of particles (like the C18-bonded SiO2 described above).
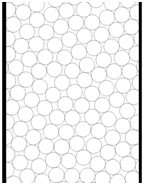
Draw two pathways a solute molecule could take from the top to the bottom of this column. Do the pathways necessarily traverse the same distance?
- Is the difference in length between the shortest and longest path dependent at all on the diameter of the particles? If so, which particles (smaller or larger) would lead to a greater difference? (Hint: Develop an analogy here to help make this intuitive)
- Based on your answer, predict how particle size would affect band broadening due to multiple paths.
- Instead of packing a column with stationary phase particles, imagine the walls of the column are coated with the stationary phase (called a capillary column):

Would band broadening due to multiple paths be larger or smaller for this type of column? Explain.
- Does the phenomenon leading to multiple paths, known as eddy diffusion, exhibit any dependence on the flow rate?
- As the solutes are undergoing eddy and longitudinal diffusion in the column, they are also partitioning between the two phases. Consider a compound that has partitioned between the mobile and stationary phase. The following might represent the concentration distribution profiles in the two phases (note that the compound as depicted has a slight preference for the mobile phase).
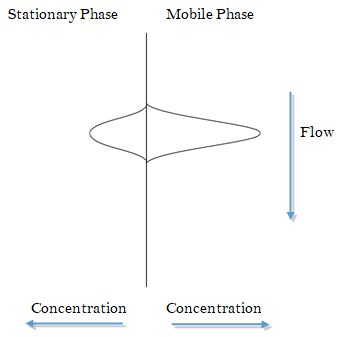
What would happen to these concentration profiles a brief instant of time later?
- Will the process described in (16) contribute to band broadening? Explain.
- Does this phenomenon, known as Stationary Phase Mass Transport Broadening, exhibit a dependence on flow rate?
- What happens to this effect as the stationary phase coating is made thicker?
- Capillary columns (see question 14) have very thin coatings. Describe one advantage of these columns. What’s a disadvantage?
- Consider a capillary column as shown below.
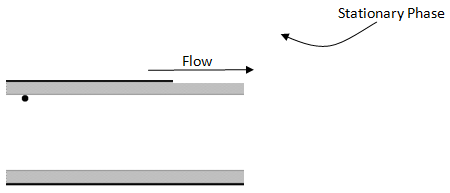
The dot represents a molecule that has just left the stationary phase is about to diffuse across the mobile phase and re-encounter the stationary phase on the other side of the column. Draw a line representing the path of the molecule.
- What would this path look like if the flow rate were doubled?
- Is it important for the molecule to encounter the stationary phase? Think about a situation in which the flow was so fast that the molecule never re-encountered the stationary phase.
- If using capillary columns, what does this suggest about the desirable diameter for such a column?
- How does this phenomenon, known as Mobile Phase Mass Transport Broadening depend on flow rate?
- Would this effect be observed in a packed column? If so, how?
- How could you reduce this effect in a packed column?
- Say something about the length of column needed if you undertake what you have suggested in (27) assuming that you have maintained a constant thickness of stationary phase.
- Recap the four contributions to band broadening. How does each depend on flow rate?
Session 2a: Theoretical Plates and the van Deemter Equation
We can approximate the column as a series of theoretical plates with plate height H. Within each plate the solute distributes between the phases according to its partition coefficient before moving to the next plate. Essentially, narrower plates → narrower peaks.
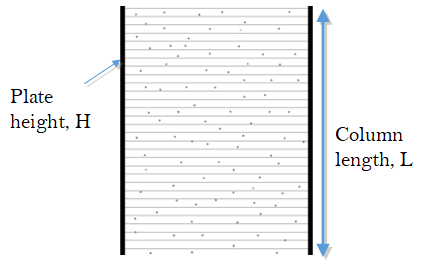
- If our column of length L has a plate height of H, can you write an expression for the number of plates (the plate number N) in terms of L and H?
- The dependence of plate height on flow rate, u, is given by the van Deemter equation:
\[H= A + \dfrac{B}{u} + Cu \nonumber\]
A, B, and C are positive constants. Based on your answer to question 29, which term on the right-hand-side corresponds to each source of band broadening?
- Sketch a plot of H versus u for each term on the same plot, i.e. sketch H = A, H = B/u, and H = Cu. Then add them together to sketch a van Deemter plot.
- Discuss at least two ways in which separation of solutes could be optimized.
Contributors and Attributions
- Dr. Ryan West, University of San Francisco (rmwest2@usfca.edu)
- NOTE: This activity is a modification of a module titled Separation Science on the Active Learning site that was written by Tom Wenzel. http://community.asdlib.org/activelearningmaterials/separation-science/
- Sourced from the Analytical Sciences Digital Library