5: Infrared Spectroscopy
- Page ID
- 332805

\( \newcommand{\vecs}[1]{\overset { \scriptstyle \rightharpoonup} {\mathbf{#1}} } \)
\( \newcommand{\vecd}[1]{\overset{-\!-\!\rightharpoonup}{\vphantom{a}\smash {#1}}} \)
\( \newcommand{\dsum}{\displaystyle\sum\limits} \)
\( \newcommand{\dint}{\displaystyle\int\limits} \)
\( \newcommand{\dlim}{\displaystyle\lim\limits} \)
\( \newcommand{\id}{\mathrm{id}}\) \( \newcommand{\Span}{\mathrm{span}}\)
( \newcommand{\kernel}{\mathrm{null}\,}\) \( \newcommand{\range}{\mathrm{range}\,}\)
\( \newcommand{\RealPart}{\mathrm{Re}}\) \( \newcommand{\ImaginaryPart}{\mathrm{Im}}\)
\( \newcommand{\Argument}{\mathrm{Arg}}\) \( \newcommand{\norm}[1]{\| #1 \|}\)
\( \newcommand{\inner}[2]{\langle #1, #2 \rangle}\)
\( \newcommand{\Span}{\mathrm{span}}\)
\( \newcommand{\id}{\mathrm{id}}\)
\( \newcommand{\Span}{\mathrm{span}}\)
\( \newcommand{\kernel}{\mathrm{null}\,}\)
\( \newcommand{\range}{\mathrm{range}\,}\)
\( \newcommand{\RealPart}{\mathrm{Re}}\)
\( \newcommand{\ImaginaryPart}{\mathrm{Im}}\)
\( \newcommand{\Argument}{\mathrm{Arg}}\)
\( \newcommand{\norm}[1]{\| #1 \|}\)
\( \newcommand{\inner}[2]{\langle #1, #2 \rangle}\)
\( \newcommand{\Span}{\mathrm{span}}\) \( \newcommand{\AA}{\unicode[.8,0]{x212B}}\)
\( \newcommand{\vectorA}[1]{\vec{#1}} % arrow\)
\( \newcommand{\vectorAt}[1]{\vec{\text{#1}}} % arrow\)
\( \newcommand{\vectorB}[1]{\overset { \scriptstyle \rightharpoonup} {\mathbf{#1}} } \)
\( \newcommand{\vectorC}[1]{\textbf{#1}} \)
\( \newcommand{\vectorD}[1]{\overrightarrow{#1}} \)
\( \newcommand{\vectorDt}[1]{\overrightarrow{\text{#1}}} \)
\( \newcommand{\vectE}[1]{\overset{-\!-\!\rightharpoonup}{\vphantom{a}\smash{\mathbf {#1}}}} \)
\( \newcommand{\vecs}[1]{\overset { \scriptstyle \rightharpoonup} {\mathbf{#1}} } \)
\(\newcommand{\longvect}{\overrightarrow}\)
\( \newcommand{\vecd}[1]{\overset{-\!-\!\rightharpoonup}{\vphantom{a}\smash {#1}}} \)
\(\newcommand{\avec}{\mathbf a}\) \(\newcommand{\bvec}{\mathbf b}\) \(\newcommand{\cvec}{\mathbf c}\) \(\newcommand{\dvec}{\mathbf d}\) \(\newcommand{\dtil}{\widetilde{\mathbf d}}\) \(\newcommand{\evec}{\mathbf e}\) \(\newcommand{\fvec}{\mathbf f}\) \(\newcommand{\nvec}{\mathbf n}\) \(\newcommand{\pvec}{\mathbf p}\) \(\newcommand{\qvec}{\mathbf q}\) \(\newcommand{\svec}{\mathbf s}\) \(\newcommand{\tvec}{\mathbf t}\) \(\newcommand{\uvec}{\mathbf u}\) \(\newcommand{\vvec}{\mathbf v}\) \(\newcommand{\wvec}{\mathbf w}\) \(\newcommand{\xvec}{\mathbf x}\) \(\newcommand{\yvec}{\mathbf y}\) \(\newcommand{\zvec}{\mathbf z}\) \(\newcommand{\rvec}{\mathbf r}\) \(\newcommand{\mvec}{\mathbf m}\) \(\newcommand{\zerovec}{\mathbf 0}\) \(\newcommand{\onevec}{\mathbf 1}\) \(\newcommand{\real}{\mathbb R}\) \(\newcommand{\twovec}[2]{\left[\begin{array}{r}#1 \\ #2 \end{array}\right]}\) \(\newcommand{\ctwovec}[2]{\left[\begin{array}{c}#1 \\ #2 \end{array}\right]}\) \(\newcommand{\threevec}[3]{\left[\begin{array}{r}#1 \\ #2 \\ #3 \end{array}\right]}\) \(\newcommand{\cthreevec}[3]{\left[\begin{array}{c}#1 \\ #2 \\ #3 \end{array}\right]}\) \(\newcommand{\fourvec}[4]{\left[\begin{array}{r}#1 \\ #2 \\ #3 \\ #4 \end{array}\right]}\) \(\newcommand{\cfourvec}[4]{\left[\begin{array}{c}#1 \\ #2 \\ #3 \\ #4 \end{array}\right]}\) \(\newcommand{\fivevec}[5]{\left[\begin{array}{r}#1 \\ #2 \\ #3 \\ #4 \\ #5 \\ \end{array}\right]}\) \(\newcommand{\cfivevec}[5]{\left[\begin{array}{c}#1 \\ #2 \\ #3 \\ #4 \\ #5 \\ \end{array}\right]}\) \(\newcommand{\mattwo}[4]{\left[\begin{array}{rr}#1 \amp #2 \\ #3 \amp #4 \\ \end{array}\right]}\) \(\newcommand{\laspan}[1]{\text{Span}\{#1\}}\) \(\newcommand{\bcal}{\cal B}\) \(\newcommand{\ccal}{\cal C}\) \(\newcommand{\scal}{\cal S}\) \(\newcommand{\wcal}{\cal W}\) \(\newcommand{\ecal}{\cal E}\) \(\newcommand{\coords}[2]{\left\{#1\right\}_{#2}}\) \(\newcommand{\gray}[1]{\color{gray}{#1}}\) \(\newcommand{\lgray}[1]{\color{lightgray}{#1}}\) \(\newcommand{\rank}{\operatorname{rank}}\) \(\newcommand{\row}{\text{Row}}\) \(\newcommand{\col}{\text{Col}}\) \(\renewcommand{\row}{\text{Row}}\) \(\newcommand{\nul}{\text{Nul}}\) \(\newcommand{\var}{\text{Var}}\) \(\newcommand{\corr}{\text{corr}}\) \(\newcommand{\len}[1]{\left|#1\right|}\) \(\newcommand{\bbar}{\overline{\bvec}}\) \(\newcommand{\bhat}{\widehat{\bvec}}\) \(\newcommand{\bperp}{\bvec^\perp}\) \(\newcommand{\xhat}{\widehat{\xvec}}\) \(\newcommand{\vhat}{\widehat{\vvec}}\) \(\newcommand{\uhat}{\widehat{\uvec}}\) \(\newcommand{\what}{\widehat{\wvec}}\) \(\newcommand{\Sighat}{\widehat{\Sigma}}\) \(\newcommand{\lt}{<}\) \(\newcommand{\gt}{>}\) \(\newcommand{\amp}{&}\) \(\definecolor{fillinmathshade}{gray}{0.9}\)Infrared Spectroscopy
Infrared spectroscopy measures the absorption of energy that matches the vibrational frequency. The energies are affected by the strength of the bond and the masses of the atoms.
Definitions and Introduction to Hooke’s Law
Hooke's Law: \(\displaystyle \nu = \frac{1}{2\pi} \sqrt{\frac{k}{m}}\)
Where k = force constant
m= mass
\(\nu\) = frequency
- What happens to \(\nu\) if k is increased?
- What happens to \(\nu\) if m is increased?
Hooke’s Law applied to IR Spectroscopy*
*Watch a video on IR and Hooke’s Law. [meta: LINK MISSING]
- Circle the two true statements:
- The stronger the spring, the higher (faster) the frequency of bouncing.
- The weaker the spring, the higher (faster) the frequency of bouncing.
- The heavier the weight, the higher (faster) the frequency of bouncing.
- The lighter the weight, the higher (faster) the frequency of bouncing.
- Order the bonds shown below in order of strength:

- If we assume bonds are like springs, explain the frequencies in this table:
| Bond type | Alkane | Alkene | Alkyne |
| Absorbance* | 1300cm-1 | 1600cm-1 | 2200cm-1 |
*IR absorbance is typically measured in wavenumbers (proportional to Hz); another system for measuring frequency.
- Explain the trends in this table. Hint: consider atomic weights of halides.
| Bond type | C-F | C-Cl | C-Br | C-I |
| Absorbance (cm-1) | 1400-1000 | 783-540 | 650-510 | 600-485 |
IR can therefore be a useful tool for determining what types of bonds (functional groups are present in a sample.
Infrared Spectroscopy: Functional Group Determination*
IR can be a useful tool for determining what types of bonds (functional groups are present in a sample.
* All spectra are either from SDBS (Japan National Institute of Advanced Industrial Science and Technology) or simulated.
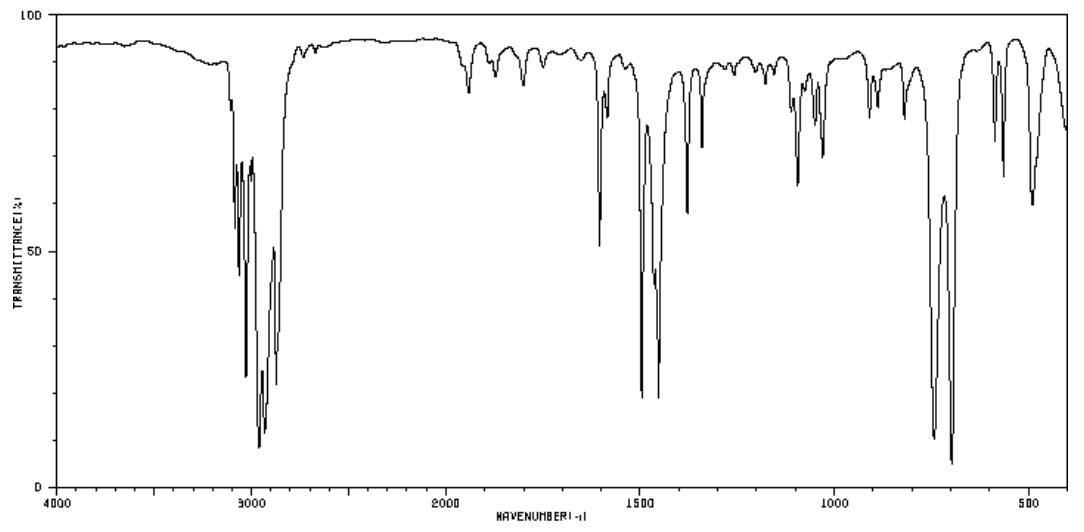
Hydrocarbons
The spectrum of octane is shown below.

- List the different types of bonds present in this structure.
- How many peaks would you expect to see?

- Based on Hooke’s Law which peak corresponds to C-H stretches? Which peak corresponds to C-C stretches?
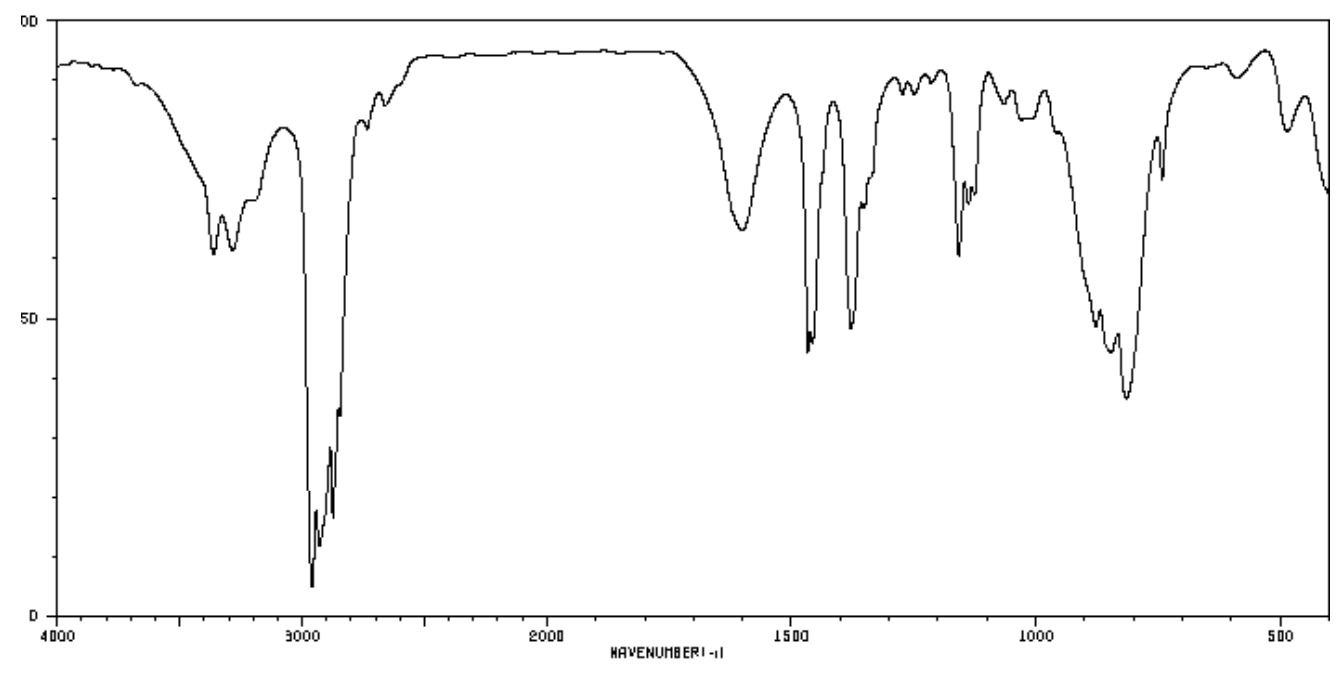
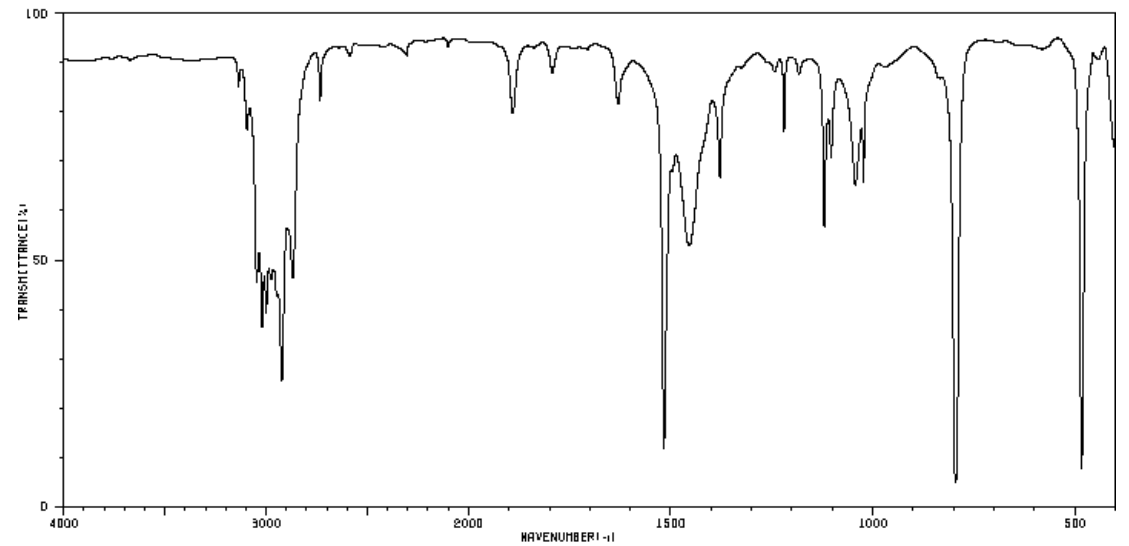
Hydrocarbons (cont.)
The spectrum of octene is shown below.
- List the different types of bonds present in this structure.
- There are two different types of C-H stretches: sp3 C-H and sp2 C-H. Based on the location of the sp3 C-H in octane, which of these is the new sp2 C-H?

- There are two different types of C-C stretches. C-C and C=C. Based on the location of the sp3 C-H in octane, which of these is the new C=C?

Alkene Analysis (cont.)
The spectra of two different alkenes are shown below.
Octene


1, 11-dodecadiene


- How do these two spectra differ?
- Can you tell how many C-C bonds or C=C are in a structure from the IR spectrum?
Alcohols
1-Octanol

- Find the sp3 C-H and the C-C stretches in the spectrum below.
There are two new stretches: O-H and C-O.
Most OH stretches show up between 3200-3400 cm-1.
- The shape of this OH peak is very distinctive. Describe this shape.

The C-O stretches show up between 1000-1300 cm-1.
- Circle or highlight this peak.

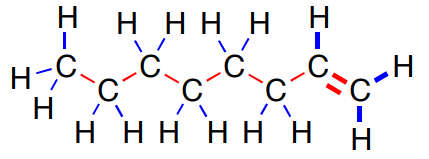
Ethers
Ethers are similar to alcohols. Here is the spectrum of butyl ether.
Ethers have sp3 C-H stretches. C-C stretches and a C-O stretch.
- Find these key peaks in the spectrum below.
- They lack a __________ stretch that is present in an alcohol.

Amines
Amines are similar to alcohols, also. Let’s consider the spectrum of 1-hexylamine

Amines have sp3 C-H stretches. C-C stretches and a C-N stretch.
- They also have an N-H stretch (or two) above 3200 cm-1.
- Find these key peaks in the spectrum below.

- The N-H stretch (or two) above 3200 cm-1 has a significantly different shape than the alcohol O-H stretch. Describe the difference.
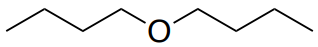
Carbonyls
Aldehydes, such as 1-octanal, have sp3 C-H stretches and C-C stretches.
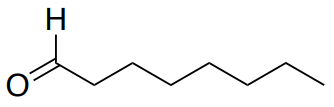
All carbonyl functional groups have a distinctive C=O stretch that absorbs strongly around 1700 cm-1.
- Find the sp3 C-H stretches and C-C stretches in the spectrum below.
- Circle or label the C=O peak.
Aldehydes also have an sp2 C-H stretch due to the aldehydic H. This peak usually has two bands around 2850 and 2750 cm−1.

- How would the spectrum of 2-octanone differ from 1-octanal?
Similar Functional Groups
- Label 1-2 relevant peaks that will help you distinguish these two functional groups.
Esters vs Ketones

- Label 1-2 relevant peaks that will help you distinguish these two functional groups.
Alcohol vs Carboxylic Acids

Summary: IR Key Ranges

Summary: IR Key Ranges (cont)
| Functional Group | Molecular Motion | Wavenumber (cm-1) |
|---|---|---|
| alkanes |
C-H stretch C-C stretch |
2950-2800 1300 |
| alkenes | =CH stretch | 3100-3010 |
| C=C stretch (isolated) | 1690-1630 | |
| alkynes | C=C-H stretch | ~3300 |
| C,C triple bond stretch | ~2150 | |
| aromatics | C-H stretch | 3020-3000 |
| C=C stretch | ~1600 & ~1475 | |
| alcohols | O-H stretch | ~3650 or 3400-3300 |
| C-O stretch | 1260-1000 | |
| ethers | C-O-C stretch (dialkyl) | 1300-1000 |
| C-O-C stretch (diaryl) | ~1250 & ~1120 | |
| aldehydes | C-H aldehyde stretch | ~2850 & ~2750 |
| C=O stretch | ~1725 | |
| ketones | C=O stretch | ~1715 |
| C-C stretch | 1300-1100 | |
| carboxylic acids | O-H stretch | 3400-2400 |
| C=O stretch | 1730-1700 | |
| C-O stretch | 1320-1210 | |
| esters | C=O stretch | 1750-1735 |
| C-O-C stretch (acetates) | 1260-1230 | |
| C-O-C stretch (all others) | 1210-1160 | |
| amines | N-H stretch (1 per N-H bond) | 3500-3300 |
| C-N Stretch (alkyl) | 1200-1025 | |
| C-N Stretch (aryl) | 1360-1250 | |
| amides | N-H stretch | 3500-3180 |
| C=O stretch | 1680-1630 | |
| nitro | -NO2 stretch |
1550-1490 1355-1315 |
Practice: IR Spectroscopy to Determine Functional Group
- Identify the most likely functional groups in these spectra.


IR and Functional Group Determination
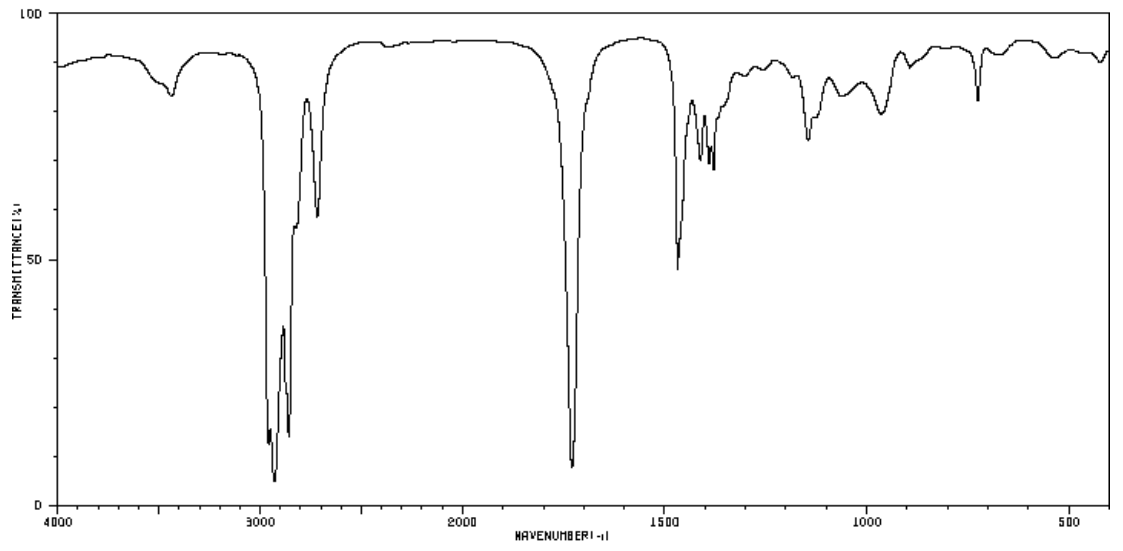
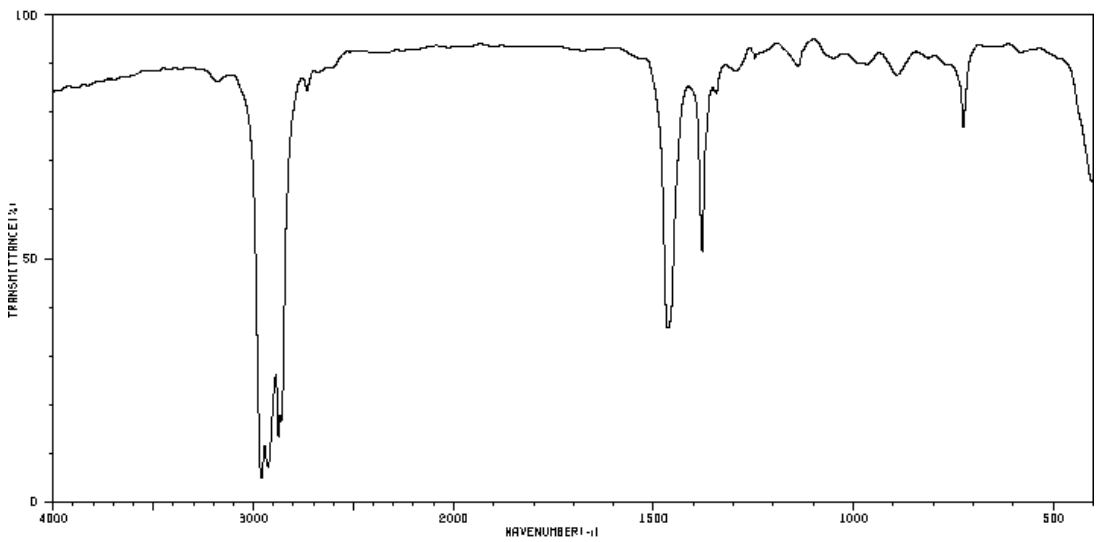
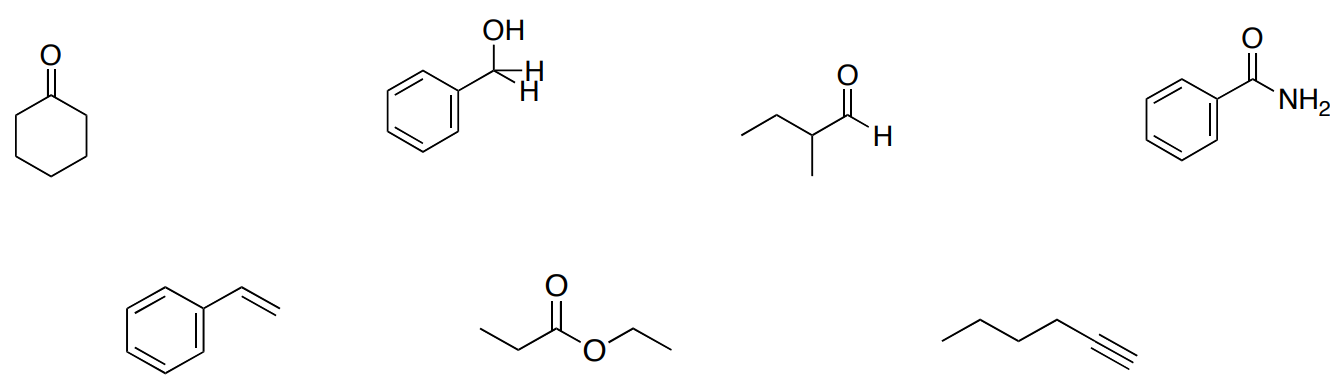
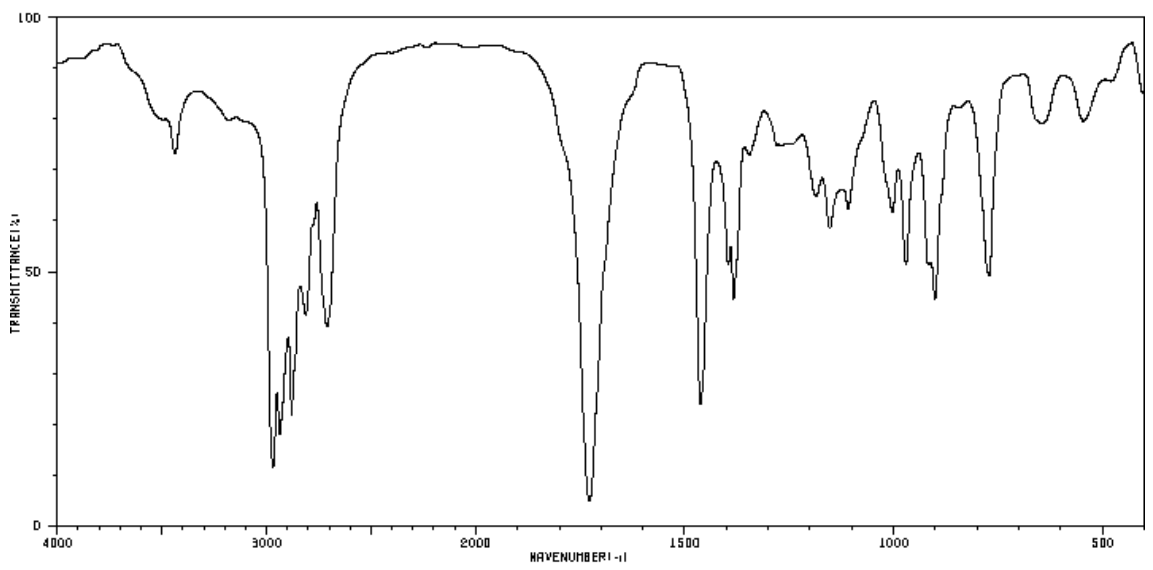
Part 1. Match the following compounds with the corresponding spectra on the following pages.
Part 2. Label 2-3 relevant peaks for each IR spectrum with the correct bond type.


Infrared Spectroscopy: Analysis Beyond Stretching
A molecule can vibrate in many ways, and each way is called a vibrational mode. Simple diatomic molecules have only one bond and only one vibrational band. If the molecule is symmetrical, the band is not observed in the IR spectrum. More complex molecules have more possible vibrations many peaks in their IR spectra.
Some possible movements:

So far, we have looked the primary stretching frequencies for polar bonds.
There are some diagnostic bending and out-of-plane bending.
Aromatic Substitution Patterns
Here are typical out-of-plane (oop) bends for mono- and di-substituted aromatic compounds.

- Determine the substitution pattern of the following compound based on oop bends.
Aromatic Substitution Patterns (cont)
- These are the spectra of the three isomers of dimethylbenzene (xylenes). Identify the ortho, meta, and para isomers.


Alkene Substitution Patterns
- Alkene molecules have C-H stretches above ____________ cm-1.
- Alkene molecules have C-C stretches around ____________ cm-1.
These two stretches are very typical for ALL alkene structures and do not provide any information about the substitution patterns but the out-of-plane (oop) bends can be diagnostic.
Here are typical out-of-plane (oop) bends for cis, trans, and terminal alkenes.

Tetrasubstituted alkenes have no hydrogens attached to the C=C moiety, and thus have no alkene C-H stretching or wagging peaks. They do have a C=C stretching peak, which appears from 1680 to 1660.
- Is there a peak that would be diagnostic for a tetra-substituted alkene?
Alkene Substitution Patterns
- Determine the substitution pattern of the following isomers of hexenes based on oop bends. (trans-3-hexene, cis-3-hexene, and 1-hexene)


Amines
N-H stretches fall in the same wavenumber range as O-H stretches, but that N-H stretches are easy to distinguish, because they will be less broad and less intense. This is due to N-H bonds being less polar than O-H bonds.
- O-H and N-H stretches show up around ____________ cm-1.
An amine does contain a C-N bond and there will be a C-N stretching peak as a result. However, C-N stretches are not very polar, so the peak intensities are not strong.
- C-N stretches show up around ____________ cm-1.
It is important to note that a primary amine has a scissors peak that appears from 1650 to 1580 cm-1. Sometimes, people will confuse this peak with an alkene.
- In this spectrum of propylamine, identify the following peaks:
- N-H stretch
- C-N stretch
- NH2 scissor

Summary of Infrared Spectroscopy:
- What information does IR provide?
- What are the limitations of IR?
- Briefly explain what information can be deduced from each of the IR regions below.

- For each set of compounds shown below, explain how IR Spectroscopy could help you tell them apart.

Another IR Matching Problem
Part 1. Identify the major functional group for the following compounds:

Part 2. Label 2-3 relevant peaks for each IR spectrum with the correct bond type.
Part 3. Match all of the IR spectra with the correct compound (from Part 1).