
14A: Atomic Emission Spectra (Experiment)
- Page ID
- 95880
\( \newcommand{\vecs}[1]{\overset { \scriptstyle \rightharpoonup} {\mathbf{#1}} } \)
\( \newcommand{\vecd}[1]{\overset{-\!-\!\rightharpoonup}{\vphantom{a}\smash {#1}}} \)
\( \newcommand{\dsum}{\displaystyle\sum\limits} \)
\( \newcommand{\dint}{\displaystyle\int\limits} \)
\( \newcommand{\dlim}{\displaystyle\lim\limits} \)
\( \newcommand{\id}{\mathrm{id}}\) \( \newcommand{\Span}{\mathrm{span}}\)
( \newcommand{\kernel}{\mathrm{null}\,}\) \( \newcommand{\range}{\mathrm{range}\,}\)
\( \newcommand{\RealPart}{\mathrm{Re}}\) \( \newcommand{\ImaginaryPart}{\mathrm{Im}}\)
\( \newcommand{\Argument}{\mathrm{Arg}}\) \( \newcommand{\norm}[1]{\| #1 \|}\)
\( \newcommand{\inner}[2]{\langle #1, #2 \rangle}\)
\( \newcommand{\Span}{\mathrm{span}}\)
\( \newcommand{\id}{\mathrm{id}}\)
\( \newcommand{\Span}{\mathrm{span}}\)
\( \newcommand{\kernel}{\mathrm{null}\,}\)
\( \newcommand{\range}{\mathrm{range}\,}\)
\( \newcommand{\RealPart}{\mathrm{Re}}\)
\( \newcommand{\ImaginaryPart}{\mathrm{Im}}\)
\( \newcommand{\Argument}{\mathrm{Arg}}\)
\( \newcommand{\norm}[1]{\| #1 \|}\)
\( \newcommand{\inner}[2]{\langle #1, #2 \rangle}\)
\( \newcommand{\Span}{\mathrm{span}}\) \( \newcommand{\AA}{\unicode[.8,0]{x212B}}\)
\( \newcommand{\vectorA}[1]{\vec{#1}} % arrow\)
\( \newcommand{\vectorAt}[1]{\vec{\text{#1}}} % arrow\)
\( \newcommand{\vectorB}[1]{\overset { \scriptstyle \rightharpoonup} {\mathbf{#1}} } \)
\( \newcommand{\vectorC}[1]{\textbf{#1}} \)
\( \newcommand{\vectorD}[1]{\overrightarrow{#1}} \)
\( \newcommand{\vectorDt}[1]{\overrightarrow{\text{#1}}} \)
\( \newcommand{\vectE}[1]{\overset{-\!-\!\rightharpoonup}{\vphantom{a}\smash{\mathbf {#1}}}} \)
\( \newcommand{\vecs}[1]{\overset { \scriptstyle \rightharpoonup} {\mathbf{#1}} } \)
\(\newcommand{\longvect}{\overrightarrow}\)
\( \newcommand{\vecd}[1]{\overset{-\!-\!\rightharpoonup}{\vphantom{a}\smash {#1}}} \)
\(\newcommand{\avec}{\mathbf a}\) \(\newcommand{\bvec}{\mathbf b}\) \(\newcommand{\cvec}{\mathbf c}\) \(\newcommand{\dvec}{\mathbf d}\) \(\newcommand{\dtil}{\widetilde{\mathbf d}}\) \(\newcommand{\evec}{\mathbf e}\) \(\newcommand{\fvec}{\mathbf f}\) \(\newcommand{\nvec}{\mathbf n}\) \(\newcommand{\pvec}{\mathbf p}\) \(\newcommand{\qvec}{\mathbf q}\) \(\newcommand{\svec}{\mathbf s}\) \(\newcommand{\tvec}{\mathbf t}\) \(\newcommand{\uvec}{\mathbf u}\) \(\newcommand{\vvec}{\mathbf v}\) \(\newcommand{\wvec}{\mathbf w}\) \(\newcommand{\xvec}{\mathbf x}\) \(\newcommand{\yvec}{\mathbf y}\) \(\newcommand{\zvec}{\mathbf z}\) \(\newcommand{\rvec}{\mathbf r}\) \(\newcommand{\mvec}{\mathbf m}\) \(\newcommand{\zerovec}{\mathbf 0}\) \(\newcommand{\onevec}{\mathbf 1}\) \(\newcommand{\real}{\mathbb R}\) \(\newcommand{\twovec}[2]{\left[\begin{array}{r}#1 \\ #2 \end{array}\right]}\) \(\newcommand{\ctwovec}[2]{\left[\begin{array}{c}#1 \\ #2 \end{array}\right]}\) \(\newcommand{\threevec}[3]{\left[\begin{array}{r}#1 \\ #2 \\ #3 \end{array}\right]}\) \(\newcommand{\cthreevec}[3]{\left[\begin{array}{c}#1 \\ #2 \\ #3 \end{array}\right]}\) \(\newcommand{\fourvec}[4]{\left[\begin{array}{r}#1 \\ #2 \\ #3 \\ #4 \end{array}\right]}\) \(\newcommand{\cfourvec}[4]{\left[\begin{array}{c}#1 \\ #2 \\ #3 \\ #4 \end{array}\right]}\) \(\newcommand{\fivevec}[5]{\left[\begin{array}{r}#1 \\ #2 \\ #3 \\ #4 \\ #5 \\ \end{array}\right]}\) \(\newcommand{\cfivevec}[5]{\left[\begin{array}{c}#1 \\ #2 \\ #3 \\ #4 \\ #5 \\ \end{array}\right]}\) \(\newcommand{\mattwo}[4]{\left[\begin{array}{rr}#1 \amp #2 \\ #3 \amp #4 \\ \end{array}\right]}\) \(\newcommand{\laspan}[1]{\text{Span}\{#1\}}\) \(\newcommand{\bcal}{\cal B}\) \(\newcommand{\ccal}{\cal C}\) \(\newcommand{\scal}{\cal S}\) \(\newcommand{\wcal}{\cal W}\) \(\newcommand{\ecal}{\cal E}\) \(\newcommand{\coords}[2]{\left\{#1\right\}_{#2}}\) \(\newcommand{\gray}[1]{\color{gray}{#1}}\) \(\newcommand{\lgray}[1]{\color{lightgray}{#1}}\) \(\newcommand{\rank}{\operatorname{rank}}\) \(\newcommand{\row}{\text{Row}}\) \(\newcommand{\col}{\text{Col}}\) \(\renewcommand{\row}{\text{Row}}\) \(\newcommand{\nul}{\text{Nul}}\) \(\newcommand{\var}{\text{Var}}\) \(\newcommand{\corr}{\text{corr}}\) \(\newcommand{\len}[1]{\left|#1\right|}\) \(\newcommand{\bbar}{\overline{\bvec}}\) \(\newcommand{\bhat}{\widehat{\bvec}}\) \(\newcommand{\bperp}{\bvec^\perp}\) \(\newcommand{\xhat}{\widehat{\xvec}}\) \(\newcommand{\vhat}{\widehat{\vvec}}\) \(\newcommand{\uhat}{\widehat{\uvec}}\) \(\newcommand{\what}{\widehat{\wvec}}\) \(\newcommand{\Sighat}{\widehat{\Sigma}}\) \(\newcommand{\lt}{<}\) \(\newcommand{\gt}{>}\) \(\newcommand{\amp}{&}\) \(\definecolor{fillinmathshade}{gray}{0.9}\)- Build and calibrate a simple spectroscope capable of measuring wavelengths of visible light.
- Measure several wavelengths of light emitted by a polyelectronic element and compare the measured values to actual values.
- Measure the wavelengths of light emitted by hydrogen and identify the electronic transition that gave rise to each wavelength using Bohr’s theory.
Atomic Emission Spectra
Electrons in atoms normally occupy the lowest energy states possible. Such an atom is said to be in the ground state. However, electrons can be excited to high energy states when they absorb excess energy. The excess energy can be provided by heat, light, or electrical discharge. The electrons then return to lower energy states, eventually returning all the way to the ground state. As the electrons return to lower energy states, they release their excess energy. Often, this excess energy is released in the form of light, with each atom or molecule releasing a single photon of light for each electron energy transition it makes.
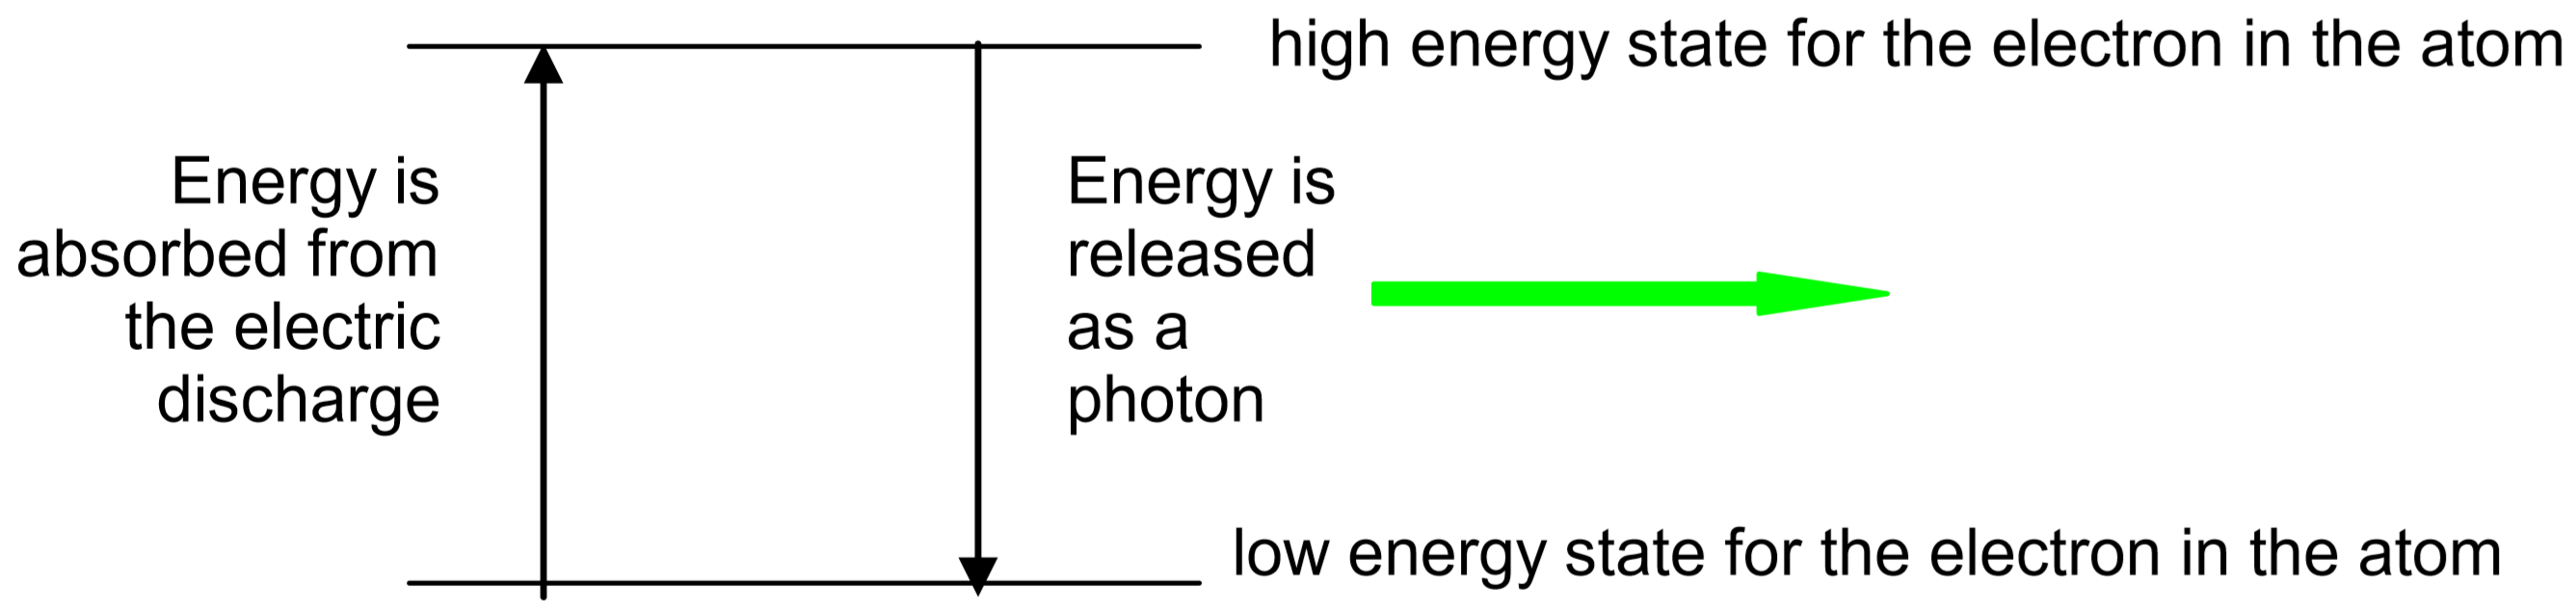
In the hydrogen discharge tubes used in this experiment, the energy of the electric discharge first dissociates the \(\ce{H2}\) molecules into \(\ce{H}\) atoms, then excites the electrons in the \(\ce{H}\) atoms into high energy states.
Due to conservation of energy, the amount of energy in an emitted photon will exactly match the amount of energy lost by the electron as it moves to the lower energy state. Different colors of light are associated with different photon energies. For example, a single photon of blue light has more energy than a single photon of red light. Thus, the color of the light emitted by a particular atom depends upon how much energy the electron releases as it moves down to a lower energy level. The energy levels that are allowed for each atom depend upon the number and arrangement of protons and electrons in the atom. Thus, each element has different energy states available to it, so each element releases photons of different color when its atoms return to their lower energy states. Since each atom has many excited states (high energy levels) available to it, several colors of light can be emitted by each element. The set of individual colors emitted by an element is called its spectrum. Since the spectrum of each element is unique, spectra can be used like fingerprints to identify unknown elements.
Wavelengths of Light
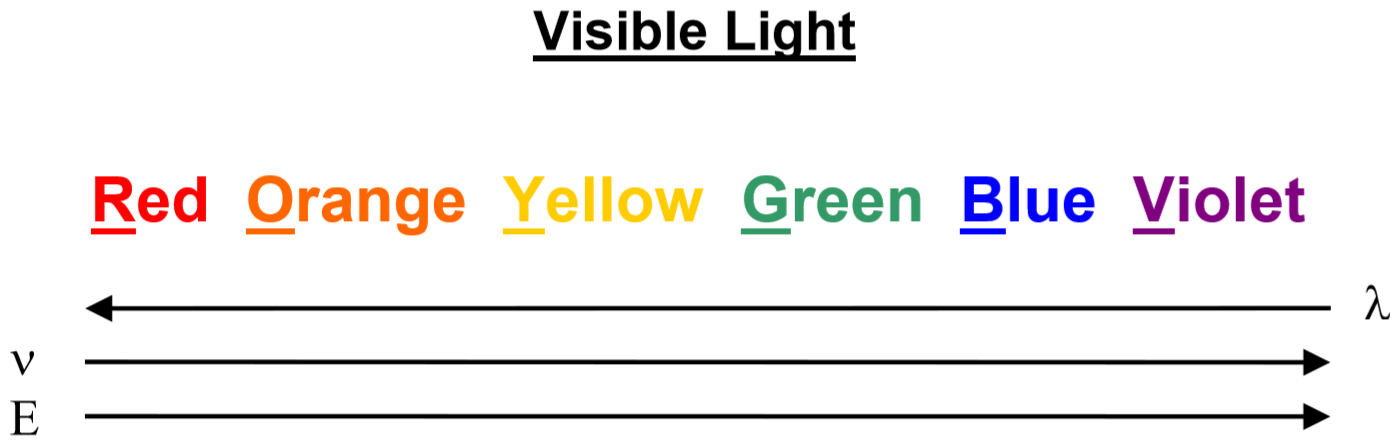
Light is one kind of electromagnetic radiation. The wavelength of radiation determines what kind of radiation it is. The human eye is able to detect only a narrow range of wavelengths of electromagnetic radiation, those from about 400nm to about 700nm. Radiation with wavelengths less than 400nm is classified as ultraviolet, x-ray, or \(\gamma\)-rays, while radiation with wavelengths longer than 700 nm is classified as infrared radiation, microwaves, and radio waves. In this experiment, we use our eyes to detect the radiation emitted by excited atoms and, therefore, we work only with visible light
The color of light is related to its wavelength (\(\lambda\)), which is related to its frequency (\(\nu\)) and the energy of its photons (\(E\)). Shorter wavelengths of light (at the blue end of the visible spectrum) have higher frequencies and higher photon energies while longer wavelengths of light (at the red end of the spectrum) have lower frequencies and less energy per photon.
It is easy to convert between photon energy, wavelength, and frequency using the following relationships where \(c\) = the speed of light = \(2.998 \times 10^8 m/s\) and \(h\) = Planck’s Constant = \(6.626 \times 10^{-34} Js\).
\[\lambda \nu = c\]
and
\[E = h \nu\]
These two relationships combine to give a third:
\[E = \dfrac{hc }{\lambda}\]
Thus, the spectrum of an element can be stated by listing the particular wavelengths of light that its atoms emit.
To measure these wavelengths in the laboratory, we must first separate them. To the naked eye, the various wavelengths (colors) of light emitted by an element are mixed together and appear as a single color that is a combination of the component colors. If we view the light through a prism or a diffraction grating, however, the individual wavelengths are separated. A diffraction grating is a piece of glass or clear plastic with many very narrow and closely spaced lines on it. As the light emerges after being reflected by the grating, these tiny lines cause the reflected light to interfere with itself in such a way that the different wavelengths of the light to appear in different positions to the left and right of the original direction in which the light was traveling. See the figure below.
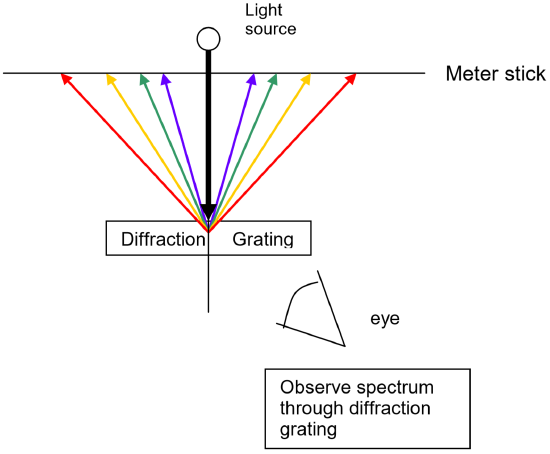
Using a light source that contains known wavelengths of light, we can measure exactly where each known wavelength appears along a meter stick. Since this position depends upon the wavelength in a linear way, a graph of wavelength vs. position of the spectral line will yield a straight line. Once the best fit straight line has been determined, the equation of this line can then be used to convert positions of other spectral lines to wavelength. For example, using the same apparatus and without moving the relative positions of the meter sticks, diffraction grating and lamp, it is possible to view the spectrum of a new element, measure where its spectral lines occur on the meter stick, and then read the graph or use the equation of the line to determine the wavelength to which each of those positions corresponds. The calibration graph is therefore an integral part of the spectroscope. Positions are measured using the meter sticks, then wavelengths are determined from the positions using the graph itself or the equation of the best fit line for that graph.
Bohr’s Theory
For atoms that contain only one electron, the theory of atomic structure proposed by Niels Bohr can be used to calculate wavelengths for transitions between particular electronic energy levels of the atom. In this experiment, the only one-electron atom we will consider is hydrogen. (Note, there are other one-electron “atoms” if you consider ions such as \(\ce{He^+}\), \(\ce{Li^{2+}}\), etc.)
Using Bohr’s theories for hydrogen, you should find a close match between the calculated wavelengths and those that you measure experimentally. To calculate the wavelengths of light emitted by hydrogen atoms, recall that the energy of an electron in the n-th energy level of a one-electron atom is given by:
\[E_n= -\dfrac{Z^2R}{n^2}\]
where \(R\) is the Rydberg constant = \(2.18 \times 10^{-18} J\), \(Z\) is the nuclear charge, and n = 1, 2, 3, ..., ∞. For hydrogen, the nuclear charge is 1 so this equation becomes:
\[E_n= -\frac{R}{ n^2}\]
The change in energy for the electron when it makes a transition from one level to another is given by its subtracting its initial energy from its final energy:
\[\Delta E_{\text{electron}} = E_f - E_i\]
By conservation of energy, the energy of the photon emitted as this electron drops to a lower energy level must equal the change in energy for the electron. However, since photon energies must be a positive quantity, the absolute value of the change in energy for the electron must be used:
\[E_{\text{photon}} = | \Delta E_{\text{electron}} |\]
Once the energy of the photon is known, it is readily converted into a wavelength as discussed earlier:
\[E_{\text{photon}} = \frac{hc}{\lambda}\]
or
\[ \lambda = \frac{hc}{E_{\text{photon}}}\]
Because there are many energy levels possible for the electron in a hydrogen atom, and because the electron could jump from any higher n to any lower n, there are many lines in the spectrum of hydrogen. However, most of these lines occur at wavelengths which our eyes cannot detect (either infrared or ultraviolet). The visible portion of the spectrum which you will observe in this experiment was the first to be studied by scientists since it is the only portion which can be seen with the naked eye. This series of spectral lines is named for one of the first scientists to study it and is called the Balmer series. Note that all of the spectral lines in the Balmer series involve transitions from a higher n level to the n=2 level. You will need that information to complete the calculations for your lab report.
Procedure
Materials and Equipment
High voltage power supply; hydrogen, mercury, and other polyelectronic element discharge tubes; meter sticks bolted in a T shape; a diffraction grating; a flashlight, ring stands.
- Use extreme caution near the high voltage power supply! Severe shocks are possible. Do not touch the front of the power supply while it is plugged in! Be sure to turn it off AND unplug it before changing discharge tubes.
- Allow discharge tubes to cool before attempting to remove them from the power supply. They become very hot with use.
- View the light emitted by the discharge tubes through glasses or goggles. Both glass and plastic lenses will absorb most of the harmful UV rays emitted by many atoms.
Part A: Calibration of the Spectroscope Using Known Wavelengths
Work in groups of 4 unless instructed otherwise. Select a workspace on one of the bench tops away from other light sources.
- Obtain 3 ring stands and adjust the iron rings so they are all at exactly the same height, about 6 inches above the bench top.
- Obtain a pair of meter sticks that have been bolted together in a “T” shape. Place the ring stands under the ends of the meter sticks so the meter stick arrangement is held about 6 inches above the bench top an is level.
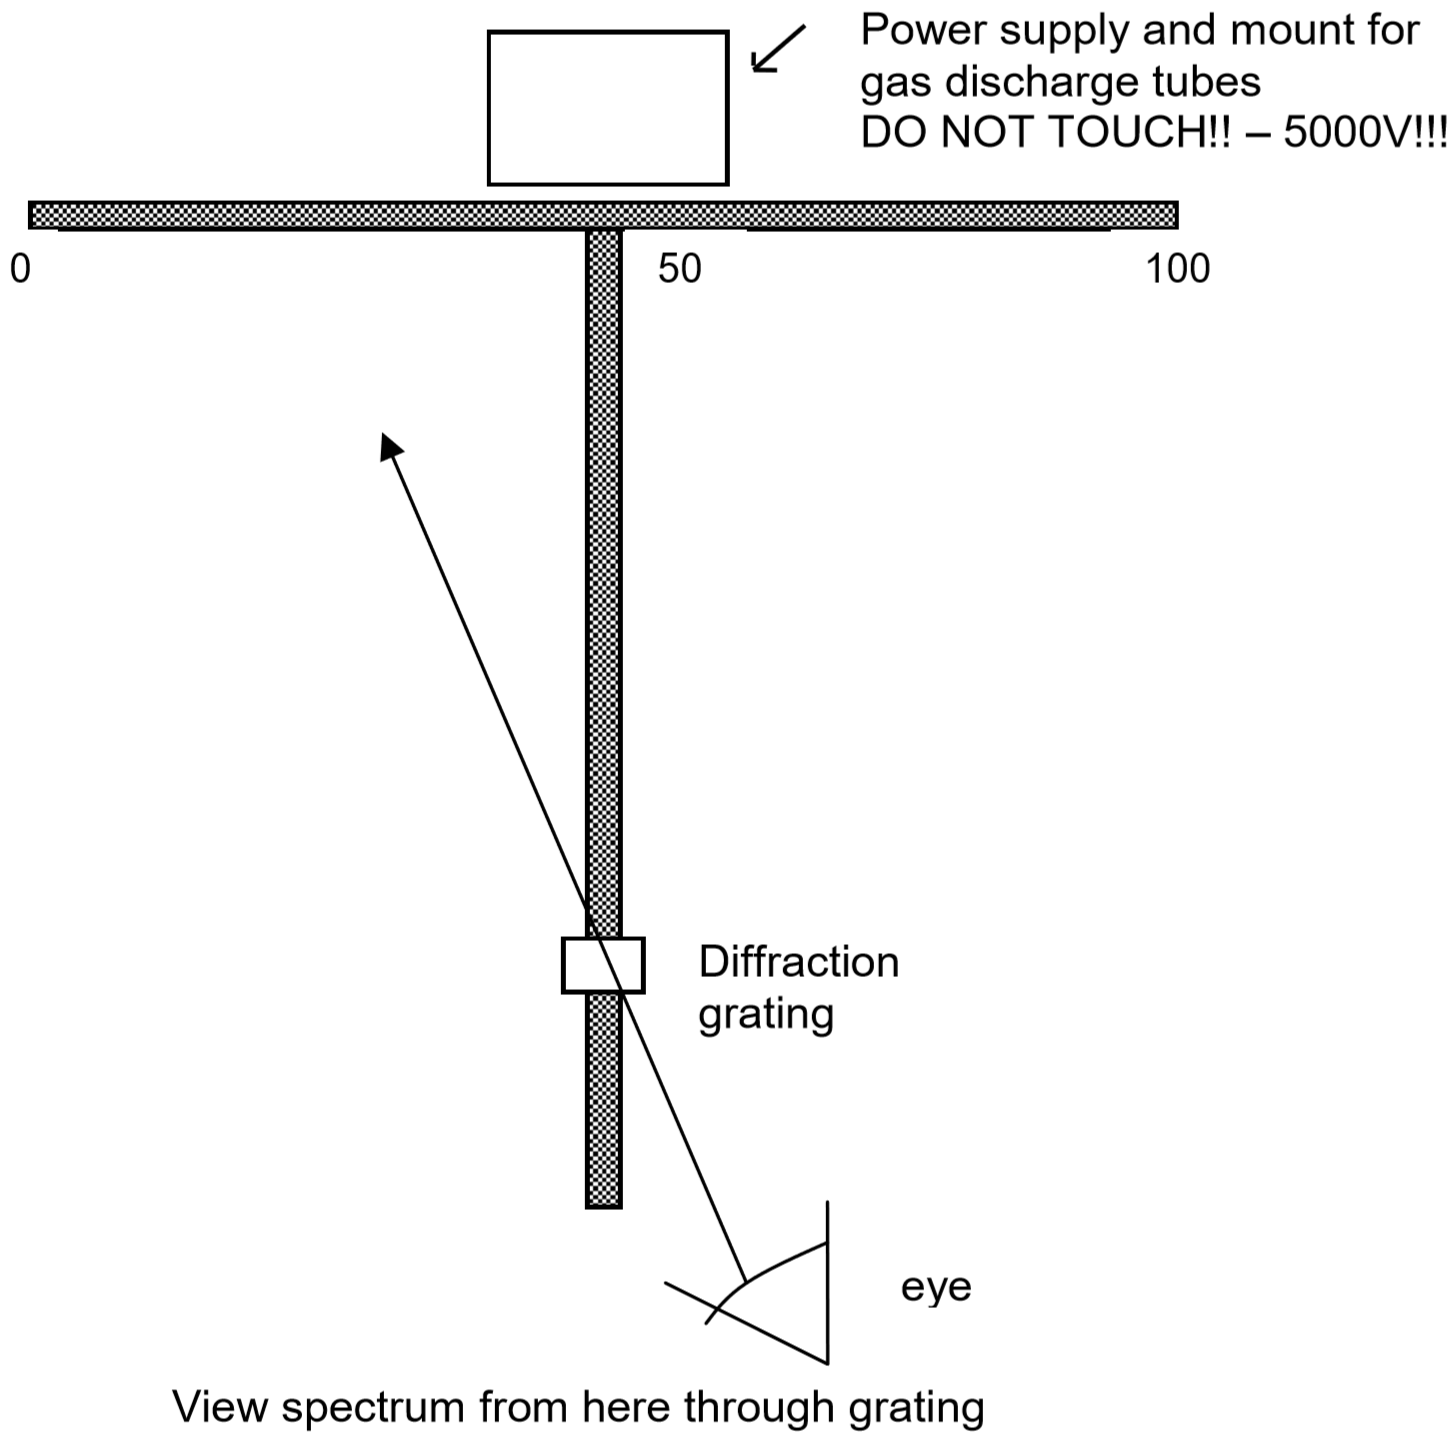
- Place a high voltage power supply (5000 V - DANGER!! - DO NOT TOUCH IF PLUGGED IN!!) containing a mercury discharge tube at the intersection point of the two meter sticks as shown in the figure on the next page. (Note that this is a very high voltage power supply! You must be careful never to touch it when it is plugged in. When you need to insert or remove a discharge tube, turn it off AND unplug it before touching the tube. Also note that the tubes become hot from use. You must let them cool before attempting to remove them.)
- Mount a diffraction grating held by a rubber stopper in a utility clamp attached to a ring stand. Place the ring stand so the diffraction grating is centered over the vertical meter stick and located about 20 cm from the free end of the vertical meter stick. See the following figure illustrating the experimental apparatus.
- Be sure not to bump the meter sticks, ring stands, or diffraction grating! If any of these components is moved in the experiment, the results will be less accurate. You will need to move the power supply to change discharge tubes, so it is a good idea to mark it’s initial position with masking tape so you can be sure to put in back in the same position each time.
- Be sure you have a mercury (\(\ce{Hg}\)) discharge tube in your power supply then turn it on. The spectrum of mercury is well known. It contains four visible wavelengths that are easily seen:
| Color | Wavelength |
|---|---|
| Violet | 404.7 nm |
| Blue | 435.8 nm |
| Green | 546.1 nm |
| Yellow | 579.0 nm |
When you look at the mercury lamp through your diffraction grating, you should see each of these four colors at varying positions along your horizontal meter stick. You can use either the spectrum to the left of the lamp or to the right. It doesn't matter because they are the same, but you should be consistent for the rest of the experiment.
- Measure the distance in cm of each line in the mercury spectrum from the center of the meter stick where the lamp is located. Note that the center of the meter stick is at 50 cm so you will have to compensate for that. Record these positions in Table 1 on your data sheet.
- Use Excel to make a graph of wavelength (in nm) vs. position (in cm) from your four data points for mercury. Wavelength should be on the y axis, position on the x axis. Obtain the equation of the best fit straight line for these data and record it on your data sheet. For help using Excel, see the Excel Graphing Exercise on the Chemistry 11 Laboratory Experiments web site.
Now that you have the equation relating position to wavelength for your spectroscope, you can use it to convert any position measured on your spectroscope into a wavelength. Thus, you can now measure wavelengths from any source of light by first measuring their position on your spectroscope and then using your graph to convert this position into a wavelength.
Be careful not to move your meter sticks or your diffraction grating! If the relative positions of these items is changed, the calibration line and its equation will no longer be accurate.
Part B: The Spectrum of a Polyelectronic Element
- Choose another discharge tube from the boxes provided. Do not choose hydrogen because you will use this tube in the next part of the experiment. Write the name of the element you chose above Table 2 on the data sheet. While the power supply is unplugged, remove the mercury discharge tube, mount the new tube in the power supply, then plug it in and turn it on.
- Use Table 2 to record the color of the five brightest spectral lines you see and their corresponding positions on the spectroscope. When you have finished, turn off your power supply and then use your calibration equation to determine the wavelengths of the lines you saw.
- Use one of the lab computers to go to http://physics.nist.gov/PhysRefData/...ement_name.htm. Select the name of the element you chose, then click on the box labeled “Strong Lines”. Scan the wavelength column for the wavelengths you measured to see if you can find any close matches. Note that the only lines you will have been likely to observe are those with the greatest intensities (see the Intensities column next to the wavelengths).
- In Table 2, recored the tabulated wavelength for the intense line nearest to each wavelength you observed.
- Calculate the % error for each of your measured wavelengths.
Part C: The Spectrum of a Single Electron Atom: Hydrogen
- With the power supply unplugged, place a hydrogen tube in your power supply then plug it in and turn it on.
- Record the colors and positions of the lines you see in Table 3. When you have finished, use your calibration equation to determine the wavelengths of the lines you saw.
- Using the information discussed earlier regarding Bohr’s theory, calculate the wavelengths of the first six lines in the Balmer series. Record your calculated results in Table 4.
- Compare your calculated wavelengths with your measured wavelengths. See if you can determine which electronic transition (from n = ? → n = 2) is responsible for each of the lines you saw in the hydrogen spectrum. Record your results in Table 5 and calculate your percent error for each line.
- Assume that the calculated wavelength is the actual wavelength:
\[ \text{% error} = \frac{|\text{observed wavelength} - \text{actual wavelength|}}{\text{actual wavelength}} \times 100\]
Pre-laboratory Assignment: Atomic Spectra
- Calculate the energy of the n=1 level for an electron in a hydrogen atom.
- Calculate the energy of the n=2 level for an electron in a hydrogen atom.
- Calculate the energy change when an electron in a hydrogen atom moves from n=2 to n=1.
- Calculate the wavelength of the light that an electron in a hydrogen atom would emit if it moved from n=2 to n=1.
- We can't see the light emitted by hydrogen atoms when the electrons move from any upper level to the n=1 level. Why not?
Lab Report: Atomic Spectra
Part A: Calibration of the Spectroscope
Table 1: Emission Spectrum of Mercury
|
Color |
Position from Center of Spectroscope (cm) |
Wavelength (nm) |
|---|---|---|
|
violet |
404.7 |
|
|
blue |
435.8 | |
|
green |
546.1 | |
|
yellow |
579.0 |
- Equation of best fit line from Excel (\(\lambda = mx + b\), where \(x\) = position):
- R2:_________________
Your instructor may ask you to attach a copy of your graph. Check with your instructor to see if this is required.
Part B: Spectrum of a Polyelectronic Element
Table 2: Atomic Spectrum of __________
|
Color of Selected Spectral Line |
Position from Center of Spectroscope (cm) |
Measured Wavelength (nm) (From Calibration Graph) |
Actual Wavelength (nm) (From NIST website) |
Percentage Error in Measured Wavelength |
|---|---|---|---|---|
Part C: Spectrum of a Single Electron Element: Hydrogen
Table 3: Atomic Spectrum of Hydrogen
|
Color |
Position from Center of Spectroscope (cm) | Wavelength (nm) (From Calibration Graph) |
|---|---|---|
|
red |
||
|
green-blue |
||
|
violet 1 |
||
|
violet 2 |
Table 4: The First Four Lines of the Balmer Series
|
Upper Level |
Energy of Upper Level (J) |
Lower Level |
Energy of Lower Level (J) |
Change in Energy of the Electron (J) |
Energy of the Emitted Photon (J) |
Wavelength of Emitted Photon (nm) |
|---|---|---|---|---|---|---|
|
3 |
2 |
|||||
|
4 |
2 |
|||||
|
5 |
2 |
|||||
|
6 |
2 |
Table 5: Comparison of Observed and Theoretical Results for Hydrogen
|
Observed Wavelength (from Table 3) |
Calculated Wavelength (from Table 4) |
Electronic Transition (from Table 4) |
Percentage Error in Measured Wavelength |
|---|---|---|---|