
13: Measuring Manganese Concentration Using Spectrophotometry (Experiment)
- Page ID
- 94001
\( \newcommand{\vecs}[1]{\overset { \scriptstyle \rightharpoonup} {\mathbf{#1}} } \)
\( \newcommand{\vecd}[1]{\overset{-\!-\!\rightharpoonup}{\vphantom{a}\smash {#1}}} \)
\( \newcommand{\dsum}{\displaystyle\sum\limits} \)
\( \newcommand{\dint}{\displaystyle\int\limits} \)
\( \newcommand{\dlim}{\displaystyle\lim\limits} \)
\( \newcommand{\id}{\mathrm{id}}\) \( \newcommand{\Span}{\mathrm{span}}\)
( \newcommand{\kernel}{\mathrm{null}\,}\) \( \newcommand{\range}{\mathrm{range}\,}\)
\( \newcommand{\RealPart}{\mathrm{Re}}\) \( \newcommand{\ImaginaryPart}{\mathrm{Im}}\)
\( \newcommand{\Argument}{\mathrm{Arg}}\) \( \newcommand{\norm}[1]{\| #1 \|}\)
\( \newcommand{\inner}[2]{\langle #1, #2 \rangle}\)
\( \newcommand{\Span}{\mathrm{span}}\)
\( \newcommand{\id}{\mathrm{id}}\)
\( \newcommand{\Span}{\mathrm{span}}\)
\( \newcommand{\kernel}{\mathrm{null}\,}\)
\( \newcommand{\range}{\mathrm{range}\,}\)
\( \newcommand{\RealPart}{\mathrm{Re}}\)
\( \newcommand{\ImaginaryPart}{\mathrm{Im}}\)
\( \newcommand{\Argument}{\mathrm{Arg}}\)
\( \newcommand{\norm}[1]{\| #1 \|}\)
\( \newcommand{\inner}[2]{\langle #1, #2 \rangle}\)
\( \newcommand{\Span}{\mathrm{span}}\) \( \newcommand{\AA}{\unicode[.8,0]{x212B}}\)
\( \newcommand{\vectorA}[1]{\vec{#1}} % arrow\)
\( \newcommand{\vectorAt}[1]{\vec{\text{#1}}} % arrow\)
\( \newcommand{\vectorB}[1]{\overset { \scriptstyle \rightharpoonup} {\mathbf{#1}} } \)
\( \newcommand{\vectorC}[1]{\textbf{#1}} \)
\( \newcommand{\vectorD}[1]{\overrightarrow{#1}} \)
\( \newcommand{\vectorDt}[1]{\overrightarrow{\text{#1}}} \)
\( \newcommand{\vectE}[1]{\overset{-\!-\!\rightharpoonup}{\vphantom{a}\smash{\mathbf {#1}}}} \)
\( \newcommand{\vecs}[1]{\overset { \scriptstyle \rightharpoonup} {\mathbf{#1}} } \)
\(\newcommand{\longvect}{\overrightarrow}\)
\( \newcommand{\vecd}[1]{\overset{-\!-\!\rightharpoonup}{\vphantom{a}\smash {#1}}} \)
\(\newcommand{\avec}{\mathbf a}\) \(\newcommand{\bvec}{\mathbf b}\) \(\newcommand{\cvec}{\mathbf c}\) \(\newcommand{\dvec}{\mathbf d}\) \(\newcommand{\dtil}{\widetilde{\mathbf d}}\) \(\newcommand{\evec}{\mathbf e}\) \(\newcommand{\fvec}{\mathbf f}\) \(\newcommand{\nvec}{\mathbf n}\) \(\newcommand{\pvec}{\mathbf p}\) \(\newcommand{\qvec}{\mathbf q}\) \(\newcommand{\svec}{\mathbf s}\) \(\newcommand{\tvec}{\mathbf t}\) \(\newcommand{\uvec}{\mathbf u}\) \(\newcommand{\vvec}{\mathbf v}\) \(\newcommand{\wvec}{\mathbf w}\) \(\newcommand{\xvec}{\mathbf x}\) \(\newcommand{\yvec}{\mathbf y}\) \(\newcommand{\zvec}{\mathbf z}\) \(\newcommand{\rvec}{\mathbf r}\) \(\newcommand{\mvec}{\mathbf m}\) \(\newcommand{\zerovec}{\mathbf 0}\) \(\newcommand{\onevec}{\mathbf 1}\) \(\newcommand{\real}{\mathbb R}\) \(\newcommand{\twovec}[2]{\left[\begin{array}{r}#1 \\ #2 \end{array}\right]}\) \(\newcommand{\ctwovec}[2]{\left[\begin{array}{c}#1 \\ #2 \end{array}\right]}\) \(\newcommand{\threevec}[3]{\left[\begin{array}{r}#1 \\ #2 \\ #3 \end{array}\right]}\) \(\newcommand{\cthreevec}[3]{\left[\begin{array}{c}#1 \\ #2 \\ #3 \end{array}\right]}\) \(\newcommand{\fourvec}[4]{\left[\begin{array}{r}#1 \\ #2 \\ #3 \\ #4 \end{array}\right]}\) \(\newcommand{\cfourvec}[4]{\left[\begin{array}{c}#1 \\ #2 \\ #3 \\ #4 \end{array}\right]}\) \(\newcommand{\fivevec}[5]{\left[\begin{array}{r}#1 \\ #2 \\ #3 \\ #4 \\ #5 \\ \end{array}\right]}\) \(\newcommand{\cfivevec}[5]{\left[\begin{array}{c}#1 \\ #2 \\ #3 \\ #4 \\ #5 \\ \end{array}\right]}\) \(\newcommand{\mattwo}[4]{\left[\begin{array}{rr}#1 \amp #2 \\ #3 \amp #4 \\ \end{array}\right]}\) \(\newcommand{\laspan}[1]{\text{Span}\{#1\}}\) \(\newcommand{\bcal}{\cal B}\) \(\newcommand{\ccal}{\cal C}\) \(\newcommand{\scal}{\cal S}\) \(\newcommand{\wcal}{\cal W}\) \(\newcommand{\ecal}{\cal E}\) \(\newcommand{\coords}[2]{\left\{#1\right\}_{#2}}\) \(\newcommand{\gray}[1]{\color{gray}{#1}}\) \(\newcommand{\lgray}[1]{\color{lightgray}{#1}}\) \(\newcommand{\rank}{\operatorname{rank}}\) \(\newcommand{\row}{\text{Row}}\) \(\newcommand{\col}{\text{Col}}\) \(\renewcommand{\row}{\text{Row}}\) \(\newcommand{\nul}{\text{Nul}}\) \(\newcommand{\var}{\text{Var}}\) \(\newcommand{\corr}{\text{corr}}\) \(\newcommand{\len}[1]{\left|#1\right|}\) \(\newcommand{\bbar}{\overline{\bvec}}\) \(\newcommand{\bhat}{\widehat{\bvec}}\) \(\newcommand{\bperp}{\bvec^\perp}\) \(\newcommand{\xhat}{\widehat{\xvec}}\) \(\newcommand{\vhat}{\widehat{\vvec}}\) \(\newcommand{\uhat}{\widehat{\uvec}}\) \(\newcommand{\what}{\widehat{\wvec}}\) \(\newcommand{\Sighat}{\widehat{\Sigma}}\) \(\newcommand{\lt}{<}\) \(\newcommand{\gt}{>}\) \(\newcommand{\amp}{&}\) \(\definecolor{fillinmathshade}{gray}{0.9}\)- To use spectroscopy to determine the amount of Manganese is an unknown sample.
Scenario: you have just joined a "Green Team" at SMC and have been asked by your faculty mentor to determine the concentration of Manganese in a sample of groundwater taken from behind the "Old Steel Works" downtown. This is one site being considered by the city of LA for the construction of a new elementary school. Your faculty mentor is on a committee hired by the city council to perform a preliminary investigation of the site for potential environmental hazards. Other green teams on campus will be looking for lead, mercury, chromium, etc. The results of your analysis may help clear the way for the safe building of a new school; require the city council to recommend remediation (cleaning up) of the site before the school is built; or perhaps result in the selection of a new site for the construction.
It is your task to determine the exact quantity of manganese in the sample you have been given. People's lives, jobs, and safety will depend on the answers you provide!
Health Effects of Manganese:
Eating a small amount of manganese each day is important in maintaining your health. The amount of manganese in a normal diet (about 2,000-9,000 μg/day) seems to be enough to meet your daily need, and no cases of illness from eating too little manganese have been reported in humans. In animals, eating too little manganese can interfere with normal growth, bone formation, and reproduction.
Too much manganese, however, can cause serious illness. Although there are some differences between different kinds of manganese, most manganese compounds seem to cause the same effects. Manganese miners or steel workers exposed to high levels of manganese dust in air may have mental and emotional disturbances, and their body movements may become slow and clumsy. This combination of symptoms is a disease called manganism. Workers usually do not develop symptoms of manganism unless they have been exposed for many months or years. Manganism occurs because too much manganese injures a part of the brain that helps control body movements. Some of the symptoms of manganism can be reduced by medical treatment, but the brain injury is permanent.
It is not certain whether eating or drinking too much manganese can cause manganism or not. In one report, humans who drank water containing high levels of manganese developed symptoms similar to those seen in manganese miners or steel workers, but it is not certain if the effects were caused by manganese alone. In another report, people who drank water with above average levels of manganese seemed to have a slightly higher frequency of symptoms such as weakness, stiff muscles, and trembling of the hands. However, these symptoms are not specific for manganese, and might have been caused by other factors. Studies in animals have shown that very high levels of manganese in food or water can cause changes in the brain. This information suggests that high levels of manganese in food or water might cause brain injury, but it does not appear that this is of concern to people exposed to the normal amounts of manganese in food, water, or air. The chances of harm from exposure near a waste site can only be evaluated on a site-by-site basis.
Information excerpted from: Toxicological Profile for Manganese July 1992, Agency for Toxic Substances and Disease Registry, United States Public Health Service.
Background
Spectroscopy is one of the most powerful analytical techniques in modern science. Before the advent of spectrophotometric techniques, a chemist interested in determining the amount of a particular substance present in a sample had to analyze the sample via a series of chemical reactions specific to that species and then carefully weigh the products (entire tomes exist detailing such analytical reactions). This process was extremely time consuming, prone to error, and generally impractical for measuring trace amounts. Today, most routine assaying is done quickly and efficiently by means of spectroscopy.
Spectroscopy works by correlating the concentration of a species in solution to the amount of light it absorbs. In this experiment we will determine the quantity of manganese using visible absorption spectroscopy. Because the wavelengths of light we will use are in the visible portion of the electromagnetic spectrum, our solutions will all be colored. However, this technique can also be used in other regions of the spectrum where the wavelength is not visible to our eyes, but can be measured using a photo-detector.
In a solution containing a colored compound, the intensity of the color can be used to measure the concentration of the compound; the more intense the color, the higher the concentration. The spectrophotometer measures how much light is absorbed at a given wavelength. The light absorption at that wavelength is expressed as a numerical value that can be related directly to the concentration of colored compound in the solution. In this experiment we will use spectroscopy to measure the amount of manganese in an unknown solution.
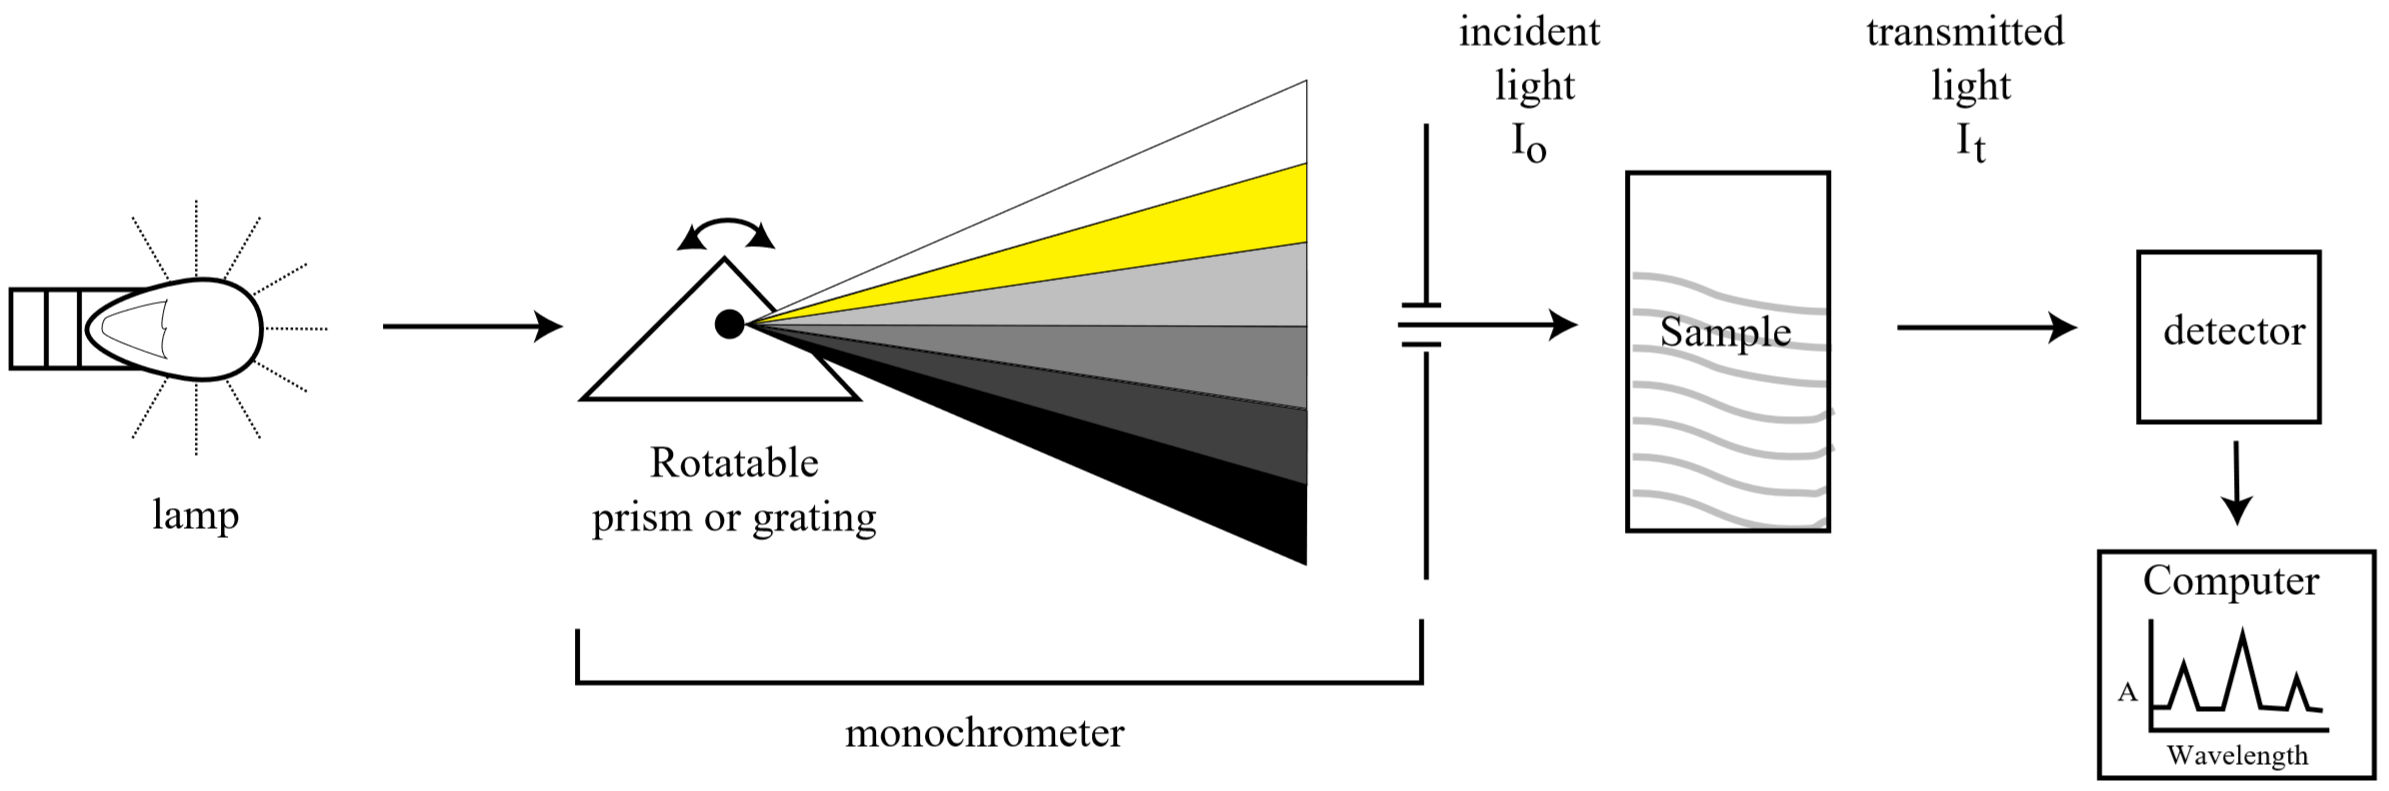
Schematic diagram of a typical absorption spectrometer
Experimental Considerations
Two important questions to answer before using a spectrophotometer are: "What wavelength will I use to measure the absorption of my compounds?" and, "How will I calibrate my instrument to get accurate readings?"
a) Choosing a wavelength
The exact color of a solution (red, blue, etc.) is an indication of how much light is absorbed at different wavelengths by its constituent molecules when white light is passed through the solution. For example, a solution that appears red in color to the eye looks red because it absorbs most colors except for red. This may sound backwards, but if white light (containing all colors) illuminates a "red" solution, then blue, green, yellow, etc. are absorbed by the solution; leaving only red light to reach our eyes. Thus, we perceive the solution as being red because all the other colors were absorbed. Similarly a blue solution absorbs most colors except blue. Some solutions have colors that are mixtures of more than one color transmitted, for example a "turquoise" colored solution may result from a mixture of blue and green light coming through the sample, etc.
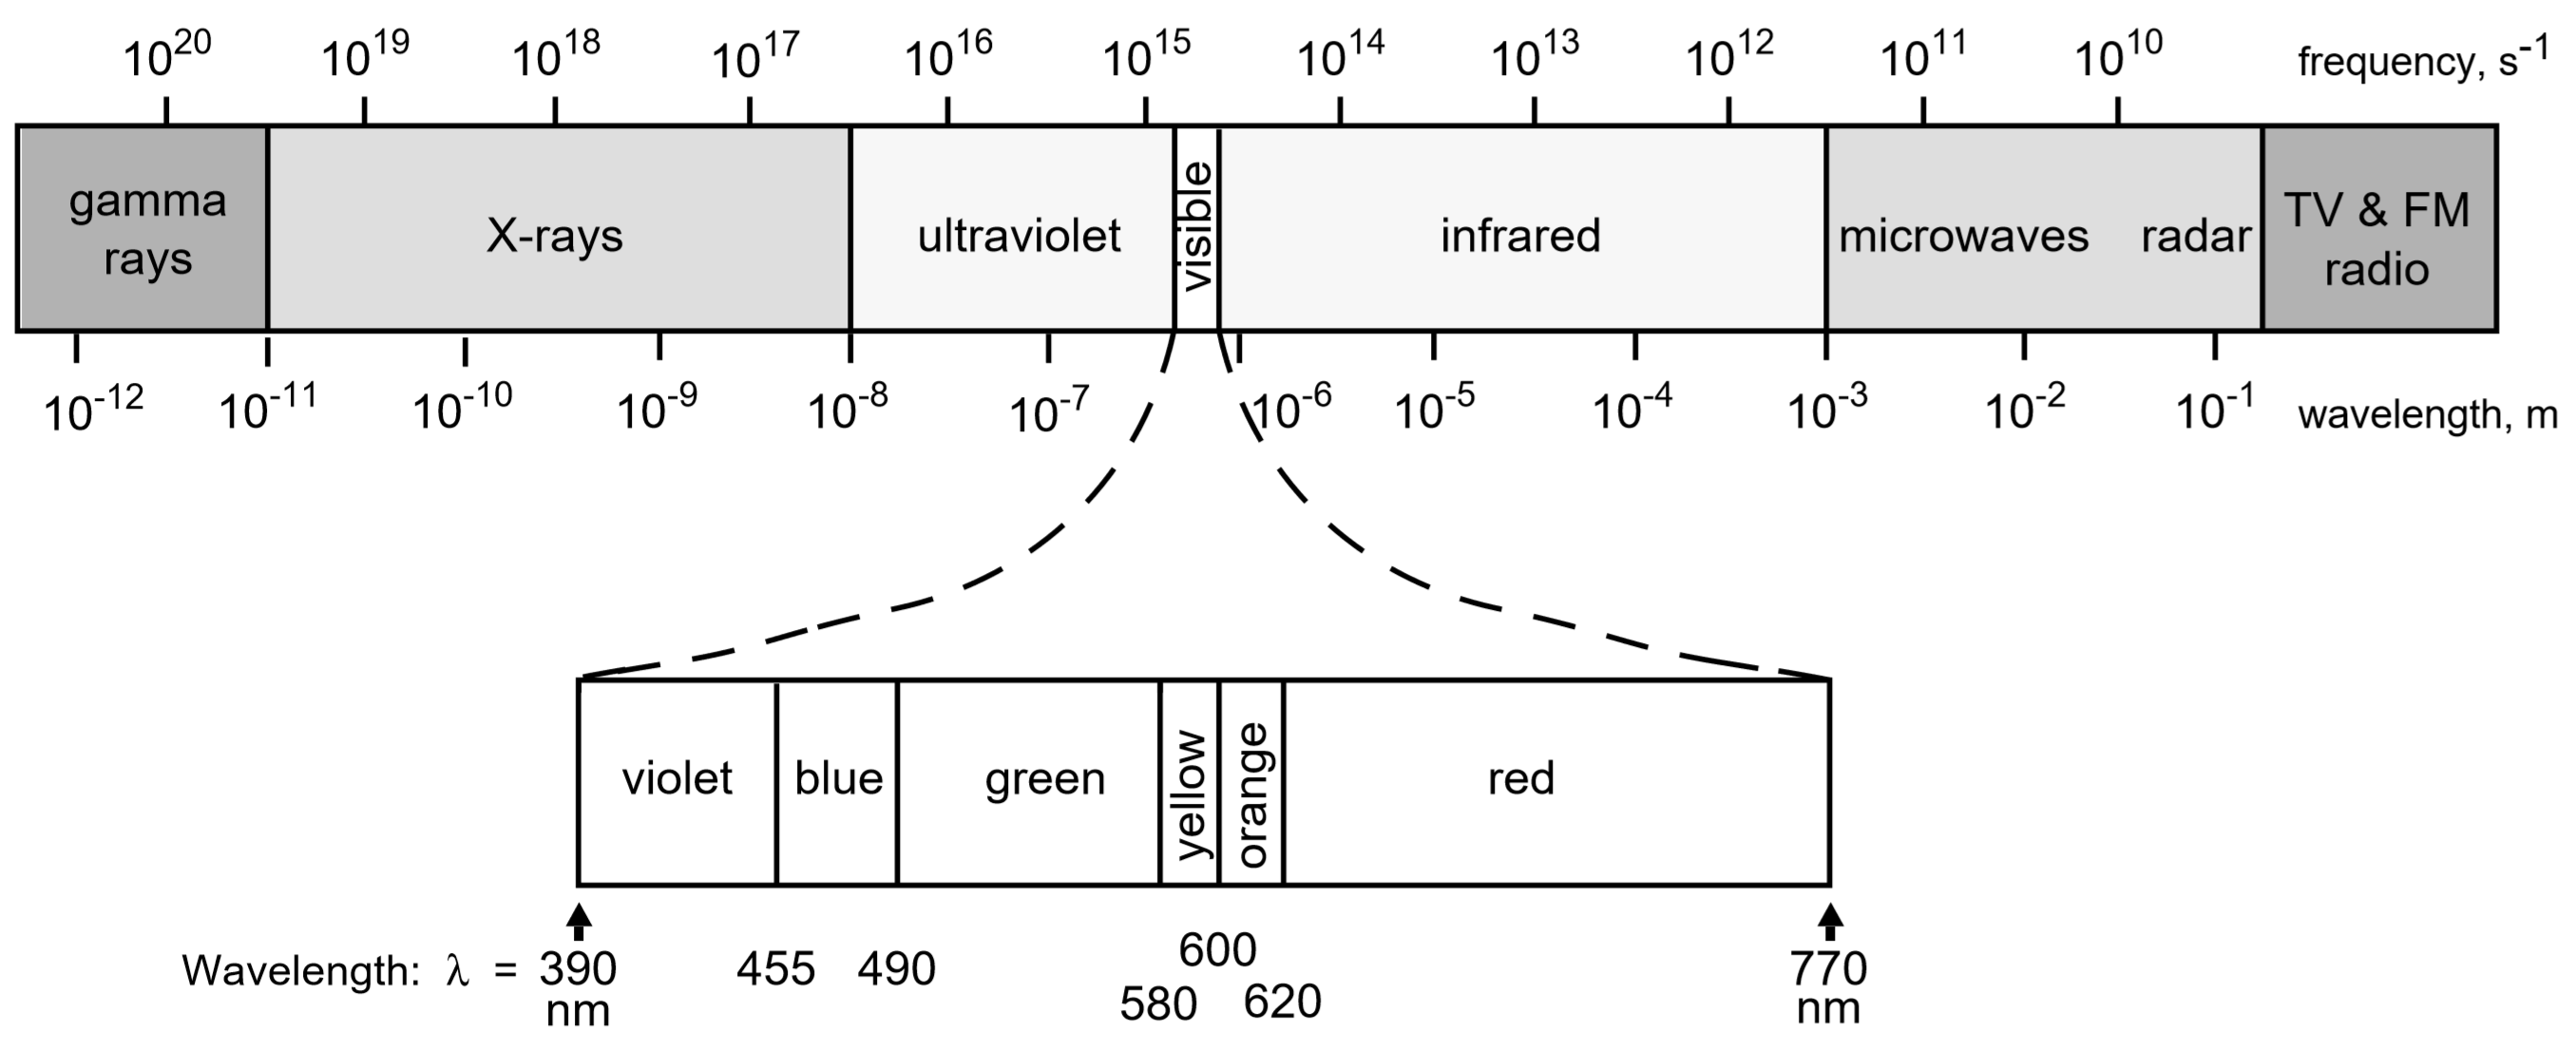
The Electromagnetic Spectrum
Thus to answer the question, "What wavelength will I use to measure the absorption of my compounds?" It is important to choose a wavelength where the solution strongly absorbs light. For example when studying a red solution it would be far better to use green light (red's complement), which is strongly absorbed by the solution; rather than orange or red light because these colors would be less strongly absorbed. The stronger the absorption at a particular wavelength the more sensitive the instrument will be at that wavelength and the more accurate your results. Thus, for a red-colored sample a wavelength in the green would probably be best; conversely if a sample is blue, then a wavelength in the red would probably be best.
In practice one first determines the best range of wavelengths at which to test a solution and then selects one "best" wavelength for the experiment by measuring the absorption of the solution in question across this range and choosing the wavelength that gives the greatest absorption. For example, for the red solution described above, the experimenter might choose to measure the absorption of the sample at a range of wavelengths between 480nm and 560nm, and then narrow-in on the wavelength that gives the greatest numeric value of the absorbance.
Please note that while some spectrometers (so-called scanning spectrometers) can do this automatically; others require changing the wavelength manually and each time the wavelength is adjusted these instruments need to be re-zeroed or they will not work properly.
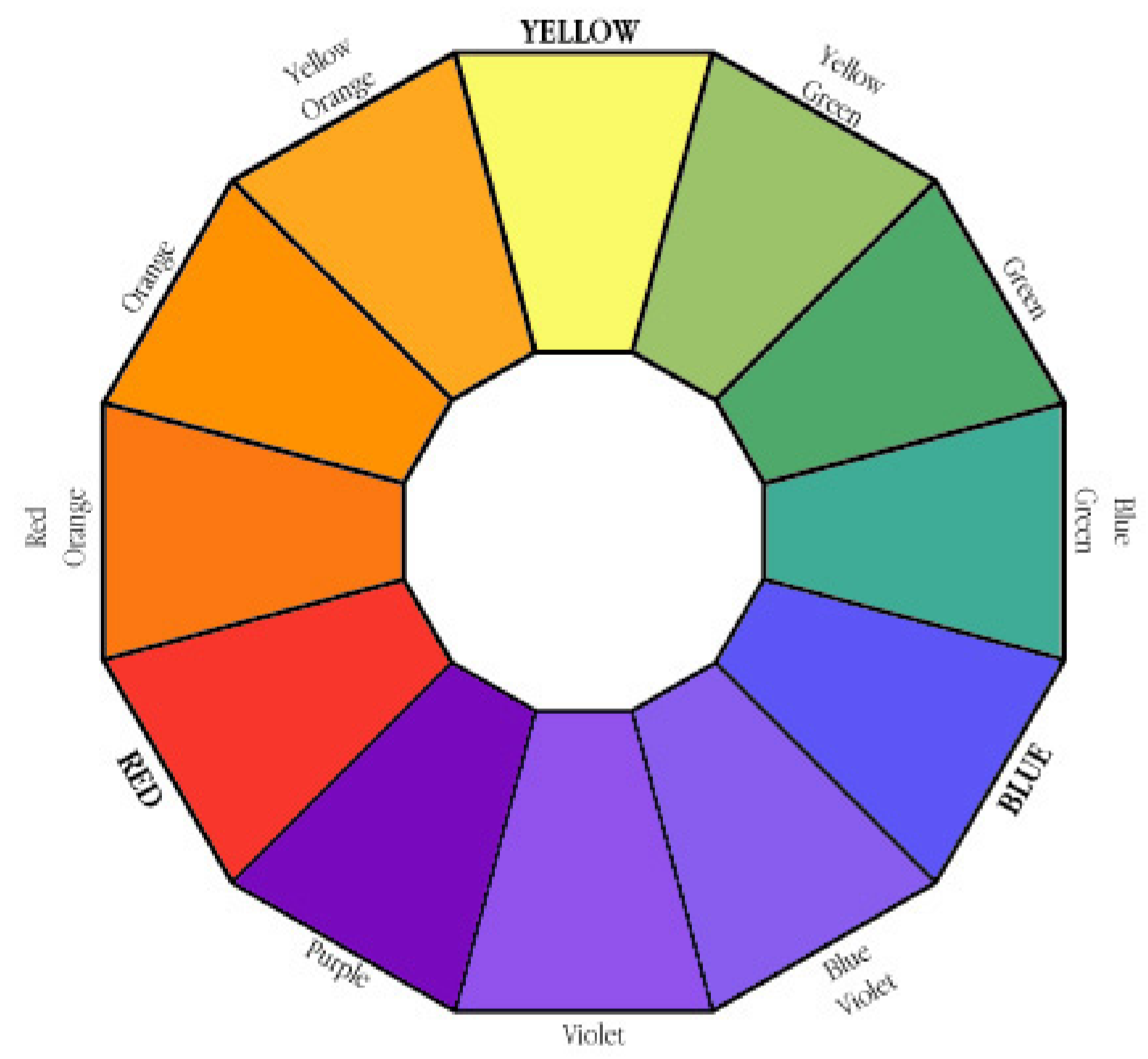
The Color Wheel is a guide to choosing complementary colors. A solution that is red is best analyzed using a wavelength in the green; a solution that is blue absorbs most strongly in the orange.
b) Calibrating the instrument
Once the specific wavelength that will be used for the experiment is chosen the experimenter needs to calibrate his or her spectrometer so that the absorbance readings can be converted into useful data such as molarity (M) of the sample.
The absorbance of light (\(A\)) is directly proportional to the concentration of the species in solution (C). This relationship is known as the Beer-Lambert-Bouguer law (or sometimes just "Beer's law") and may be expressed as:
\[A = E \times L \times C\]
where \(E\) is the molar absorptivity (or the molar extinction coefficient), \(L\) is the path length or distance the light travels through the sample, and \(C\) is the concentration of the solution in units of molarity (M). In most instruments \(L\) is a constant (1.0 cm in our experiment) and can therefore be factored into \(E\).
Thus the Beer-Lambert equation can be simplified as:
\[A = E \times C\]
\[y = mx\]
Which is the equation of a line where the intercept is through the origin (i.e. zero).
The molar absorptivity, \(E\), can therefore be determined by finding the slope of a plot of the absorbance as a function of concentration for a series of standard solutions of known concentrations. This is known as a calibration curve.
Once \(E\) has been determined from the calibration curve, the Beer-Lambert equation can be used to determine the concentration of an unknown solution by measuring its absorbance under the same conditions.
A new calibration curve is required if a different instrument, wavelength, type of solution, or procedure is used. It is also a good idea to check an instrument's calibration on a periodic basis.
c) Preparing your known standards and unknown solution for analysis
The solutions you will be given contain manganese ions, \(\ce{Mn^{2+}}\) (aq), and is an almost colorless solution. The manganese ions are easily oxidized in acidic solution to form permanganate ions, \(\ce{MnO4^{-}}\) (aq), an intensely purple species. The very intense color means that the analysis can be very sensitive because the light absorption will be relatively large, even with small amounts of manganese in the sample.
Potassium periodate, \(\ce{KIO4}\) (s), will be used to oxidize \(\ce{Mn^{2+}}\) (aq) to the purple \(\ce{MnO4^{-}}\) (aq) ion, according to the following balanced chemical equation (all species aqueous):
\[\underbrace{\ce{2Mn^{2+}}}_{\text{Colorless}} \ce{+ 5KIO4 + 3H2O ->} \underbrace{\ce{2MnO4^{-}}}_{\text{Purple}} \ce{ + 5KIO3 + 6H^{+}}\]
Procedure
Materials and Equipment
Obtain the following equipment from the stockroom:
- 1 100.0-mL volumetric flask
- 3 25.00-mL volumetric flasks (one or two per group will be OK if supplies are short)
- 2 cuvettes for the spectrophotometer
- 1 1.00 mL volumetric pipette
- 1 5.00 mL volumetric pipette
- 1 10.00 mL volumetric pipette
- 1 rubber pipette bulb
- 1 beaker tongs (not the same as the crucible tongs in your locker)
Your instructor will provide you with the spectrophotometer, stock solution, and unknowns. All other equipment is in your lab drawer.
Instructions
In order to complete this experiment in a timely manner it is suggested that one student from your team begin preparing the unknown for analysis starting with Step 16, while the rest of the team begins at Step 1 below.
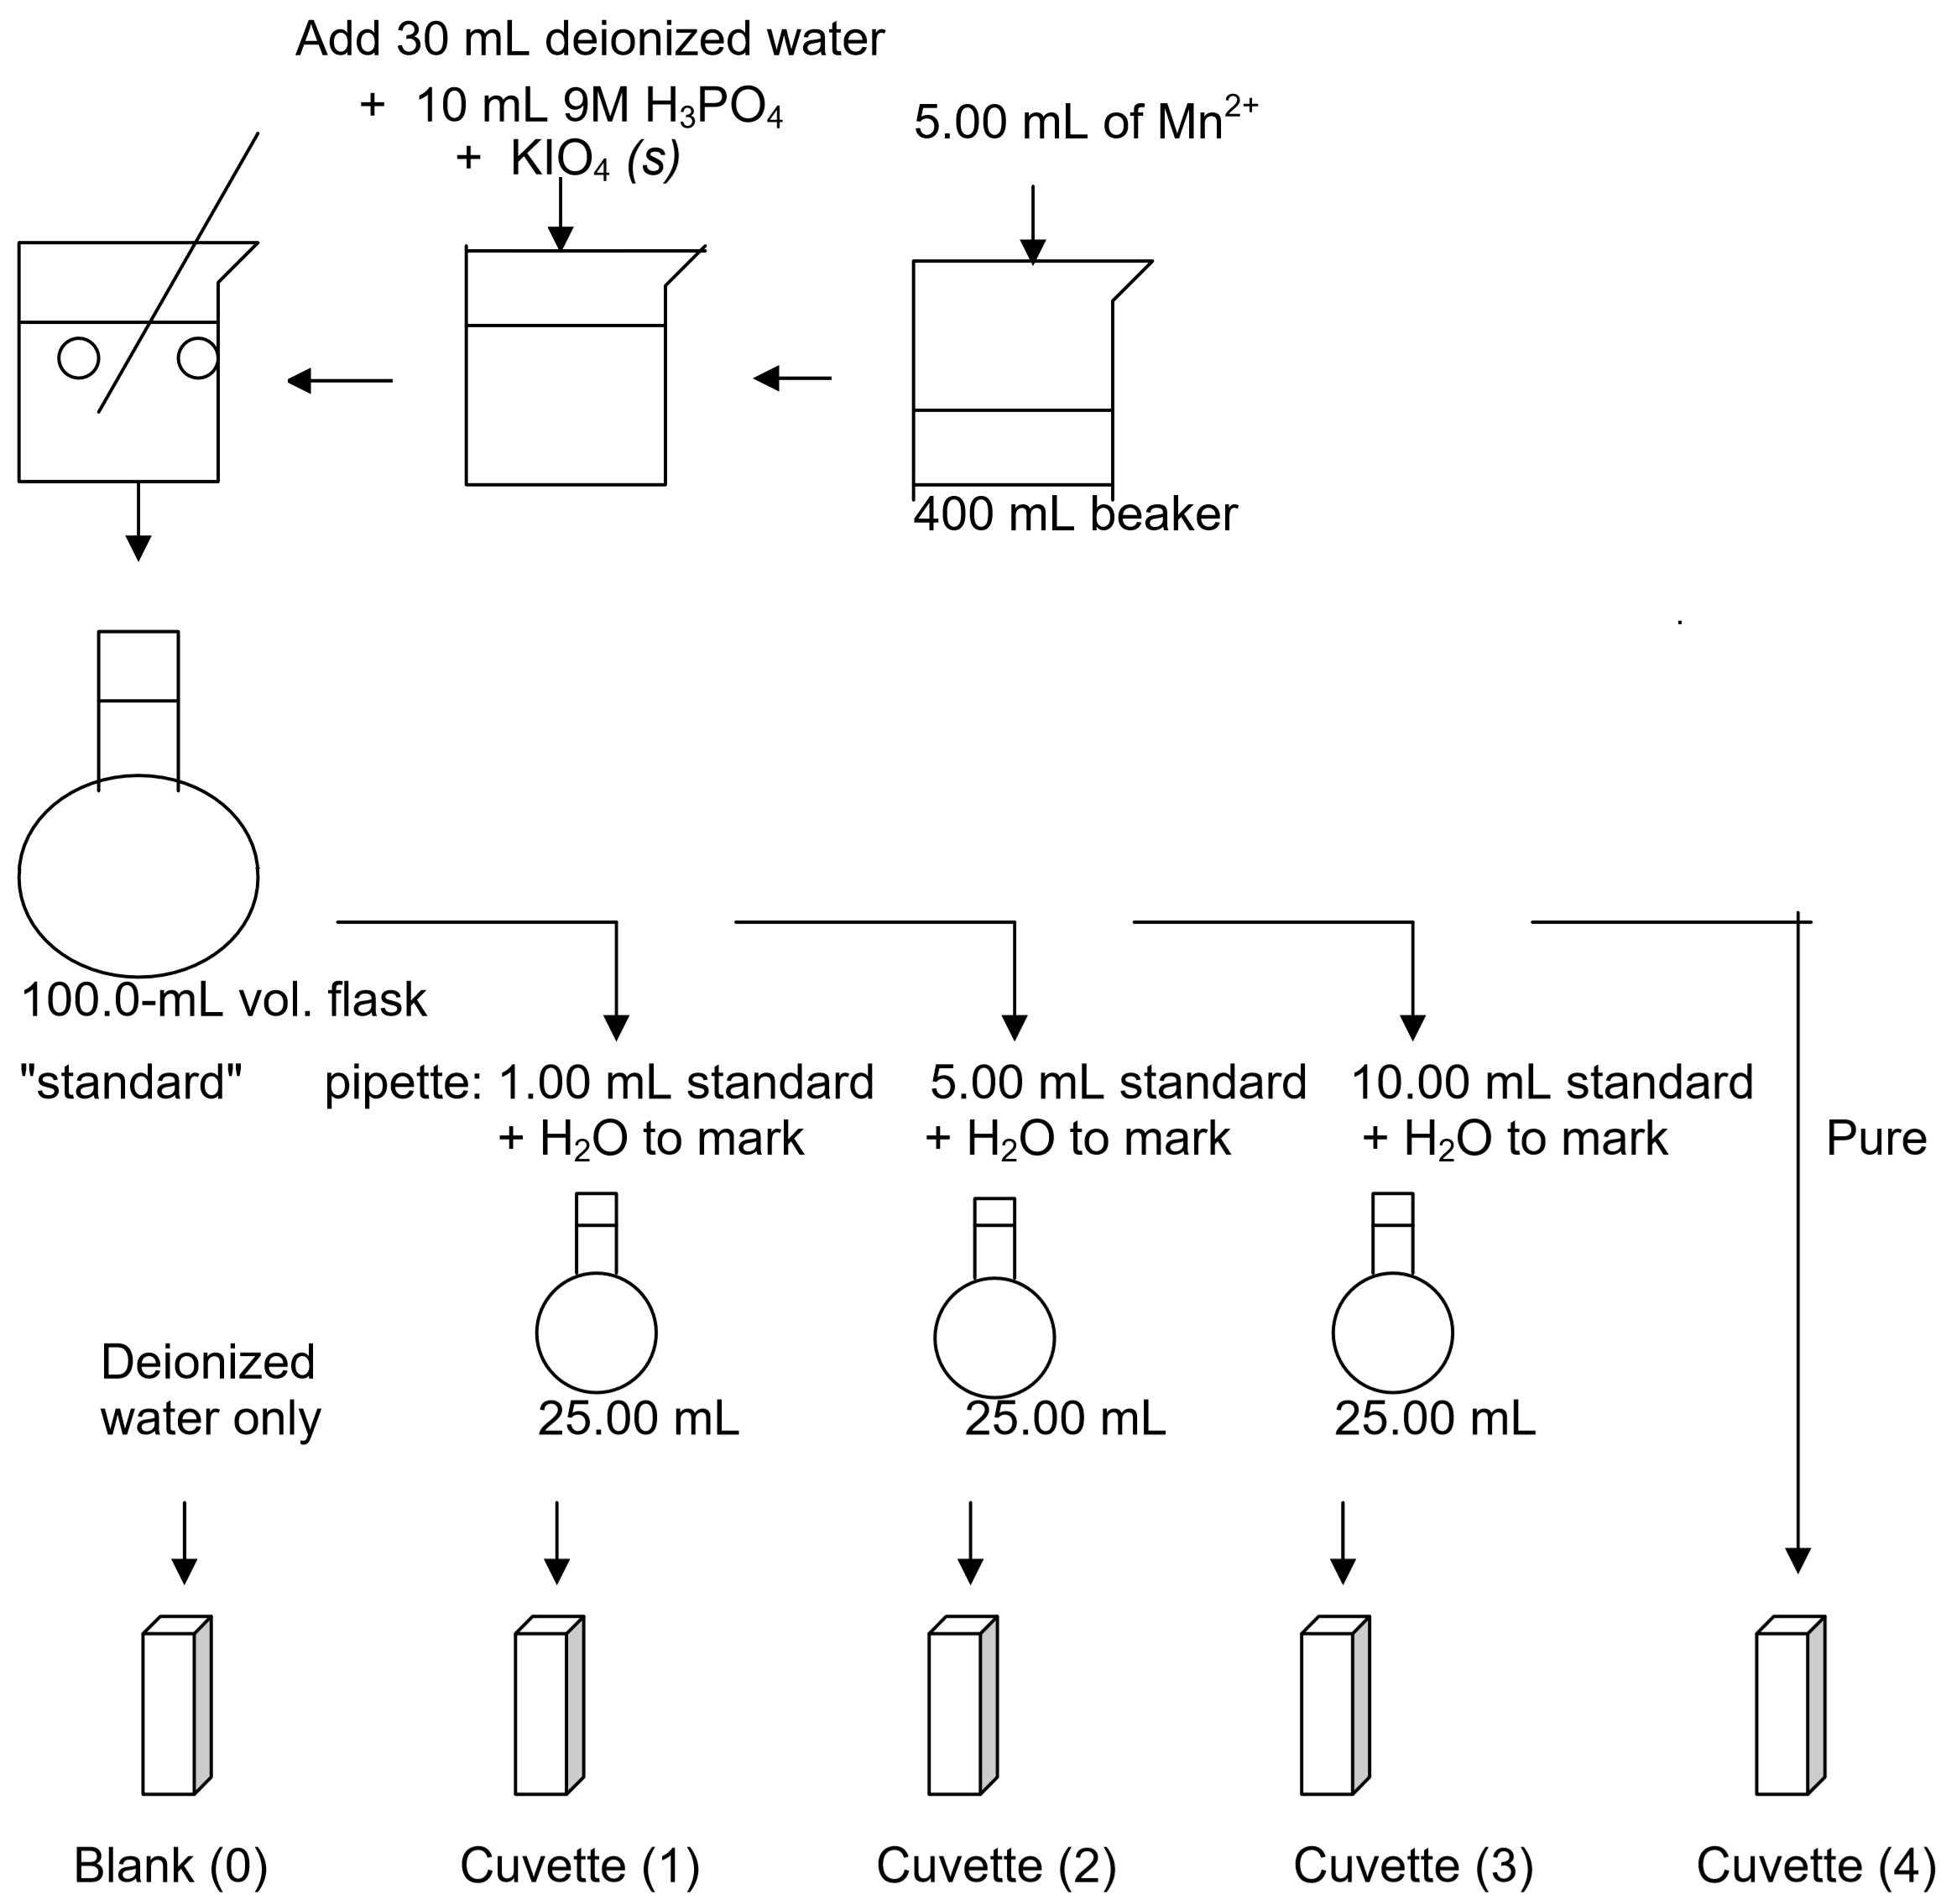
- Be sure to rinse your pipette with water followed by the stock solution before using. Pipette 5.00 mL of \(\ce{Mn^{2+}}\) (aq) stock solution into a clean 400-mL beaker.
- Using a graduated cylinder to measure volumes, add 30 mL of deionized water to the 5.00-mL stock solution. Then add 10 mL of 9 M phosphoric acid, \(\ce{H3PO4}\) (aq). (It is important to add the acid before adding the \(\ce{KIO4}\) (s) in step 5 below).
- Based on the concentration and volume of the known solution and the balanced reaction between \(\ce{Mn^{2+}}\) and \(\ce{KIO4}\), calculate the minimum mass of \(\ce{KIO4}\) (s) required to oxidize all of the \(\ce{Mn^{2+}}\) (aq) in solution to \(\ce{MnO4^-}\) (aq). Note: you will use double this amount to be certain that all of the Mn2+(aq) is actually oxidized. Show the results of this calculation to your instructor before actually proceeding.
- Using a watch glass, weigh out double the amount of solid potassium periodate, \(\ce{KIO4}\) (s), you just calculated. Do not use paper for weighing as \(\ce{KIO4}\) reacts with paper.
- Add the \(\ce{KIO4}\) (s) to your solution in the hood and stir to dissolve using a glass stirring rod. Rinse any \(\ce{KIO4}\) (s) that sticks to the watch glass into the beaker using deionized water and your squirt bottle. Leave the stirring rod in the beaker to help control bubble formation when boiling.
- Boil the solution gently. A purple color should appear. If it does not add more \(\ce{KIO4}\) (s) (add an additional 25% of your calculated value) and continue heating. Avoid splattering and boiling over! If you lose any material due to splattering you must start over repeating steps 1-4. Continue boiling gently for one to two minutes after the color changes to deep purple to be certain that the color change is complete.
- Cool the solution and transfer the entire contents of the beaker to a 100.0-mL volumetric flask using a clean funnel. Rinse the inside of the beaker and the funnel with deionized water from your wash bottle and then transfer the rinse water to the volumetric flask as well to be sure you have transferred all of the manganese solution.
- Dilute the solution in the volumetric flask with deionized water to exactly the index mark and swirl to mix thoroughly.
- Calculate the concentration of \(\ce{MnO4^-}\) (aq) in this standard solution. Label this solution "standard." You may want to transfer some of this solution to a separate container in case of "accidents."
- Label three clean, dry, 25.00-mL volumetric flasks: 1, 2, and 3. Pipette accurately 1.00, 5.00, and 10.00-mL portions of your standard solution into these flasks. Be sure to rinse the pipettes with deionized water and standard solution first. Fill each flask with deionized water exactly to the index mark and mix well. Calculate the concentration (molarity, M) of \(\ce{MnO4^-}\) (aq) ions in each of these flasks based on the molarity of your standard solution, the volume of this that you pipetted, and the total volume of your new diluted solution (25.00 mL).
- Your group will only be given two cuvettes. Rinse these using deionized water and dry the outside of each cuvette using a Kim Wipe.
- Use one cuvette for the blank and fill it 3⁄4 full with deionized water. You will use the other to measure the absorbance of each of the three solutions in the 25.00-mL volumetric flasks and the pure standard solution in the 100.0-mL volumetric flask. Be sure to rinse the second cuvette well between trials. You should first rinse this cuvette using a small amount of deionized water and then a second time using a small amount of the sample to be added.
- Before measuring the absorbance of your solutions you will need to zero your spectrometer and choose a wavelength. Your instructor will show you how to zero the spectrometer. It is up to your team to determine the best wavelength to use for this experiment – a poor choice of wavelengths will result in poor data. See the introduction to this experiment for help in choosing a wavelength. If time is limited, your instructor may provide you with a specific wavelength to use.
- Once you have zeroed the instrument and selected a wavelength, measure the absorbance of each of the three solutions in the 25.00-mL volumetric flasks and the pure standard solution in the 100.0-mL volumetric flask at this wavelength. You will have five measured data points including the deionized water blank (which should have a zero absorbance if you properly zeroed the spectrometer).
- Make a calibration curve plotting the concentration (M) of the five solutions on the x-axis and the absorbance of each on the y-axis. Use a full sheet of graph paper to make your curve – the bigger the plot the more accurate your estimate of the slope will be. Draw a best-fit-line through your points and determine the molar absorptivity, \(E\), the slope of your line. (Be sure to measure the slope of the best-fit-line; not specific data points – see your instructor if this is unclear). Your intercept should be at the origin, since your blank solution counts as one of the points. You may either plot this curve by hand using graph paper or you may use a computer program such as Excel.
Analyzing your unknown sample:
- Prepare your unknown sample in exactly the same way you prepared your standard solution following steps 1-8 above using 5.00 mL of your unknown solution instead of the known stock solution in step 1. You do not need to repeat steps 9 - 15 with the unknown.
- Measure the absorbance of the 100.0-mL purple solution prepared from your unknown at the same wavelength that you used to construct your standard curve. You can now use the equation of your best-fit-line to determine the concentration of \(\ce{MnO4^-}\) (aq) ions in this solution.
- Because this is a diluted solution, you will now need to calculate backwards from this concentration to determine the actual concentration of manganese in your original unknown sample.
- ALL WASTE MUST GO INTO THE CONTAINER IN THE HOOD!
Procedure for making the known solutions and calibration curve:
- Pipette 5.00 mL of \(\ce{Mn^{2+}}\) (aq) Stock Solution (~0.3 mg \(\ce{Mn^{2+}}\)/mL) into a clean 400 mL beaker. Record the exact concentration.
- Add 30 mL deionized water + 10 mL 9M \(\ce{H3PO4}\) + \(\ce{KIO4}\) (s) Add the acid IN THE FUME HOOD before you add the \(\ce{KIO4}\) (s). (you will need to determine how many grams of \(\ce{KIO4}\) (s) to add using the balanced equation given)
- Use a glass stirring rod to mix. Place IN THE FUME HOOD and Boil gently for 1-2 minutes after a the solution turns purple. Do not splatter! After heating, Remove from hood and allow to cool. If the solution does not turn purple add some additional \(\ce{KIO4}\) (s).
- Transfer the cool solution + rinse to a 100.0-mL volumetric flask using a funnel. Add deionized water to the mark and mix so the solution volume is 100.0 mL.
- Calculate the molarity (M) of \(\ce{MnO4^-}\) (aq) in this new solution. This will be your "standard" solution.
- Finally: calculate the molarity of each diluted solution, choose \(\lambda\), measure absorbances, and make a calibration curve.
Pre-laboratory Assignment: Measuring Manganese Using Spectrophotometry
- List 3 health effects associated with the intake of excessive manganese:
- In absorption spectroscopy the amount of light absorbed by a given sample at a specific wavelength is proportional to what two factors:
- Suppose you need to do an absorption spectroscopy experiment using an orange colored solution. Approximately what wavelength(s) of light would be the worst to measure the absorbance at; what would be the best wavelength(s) of light to measure the absorbance at. Why? Explain your answers in one or two sentences.
- Worst wavelength(s):
- Best wavelength(s):
- Explain:
- A solution contains 0.60 mg/mL \(\ce{Mn^{2+}}\). What minimum mass of \(\ce{KIO4}\) must me added to 5.00 mL of the solution in order to completely oxidize the \(\ce{Mn^{2+}}\) to \(\ce{MnO4^-}\)? Show all work.
- A student is working to determine the concentration of a dissolved protein in a biological sample using absorption spectroscopy. She prepares a blank and two standard solutions containing known concentrations of dissolved protein. She chooses an appropriate wavelength, calibrates her instrument, and then obtains the following absorption data for her standard solutions:
|
Concentration (M) |
Absorbance |
|---|---|
|
0 |
0 |
|
0.013 |
0.046 |
|
0.039 |
0.138 |
Assuming that the path length \(L\) is 1.0 cm, what is the value of \(E\)? (show all work).
- The same student now takes the biological sample containing an unknown quantity of dissolved protein and inserts it into the spectrometer. She obtains a reading that is off-scale (in other words her biological sample is too concentrated to measure). Undaunted by this result, she performs a dilution! A more dilute sample will have an absorption that can be measured by her spectrometer. She pipettes 20.00 mL of her sample into a 250.00 mL volumetric flask, adds deionized water to the index mark, and mixes the solution. She then pours a small sample of this diluted unknown solution into a cuvette and measures an absorbance of 0.228. What is the concentration of dissolved protein in her diluted unknown sample? Show all work.
- Based on this result, what is the concentration of dissolved protein in her original (undiluted) unknown biological sample? Hint: calculate the dilution backwards. Show all work.
Lab Report: Measuring Manganese Using Spectrophotometry
- Concentration of \(\ce{Mn^{2+}}\) (aq) stock solution from bottle: _________ mg/mL
- Concentration of \(\ce{Mn^{2+}}\) (aq) stock solution in units of molarity:_________ M \(\ce{Mn^{2+}}\)
- show calculation:
- Double minimum mass of \(\ce{KIO4}\) (s) required: show calculation:_________ g _____(Instructor's Initials)
- show calculation:
- Size of volumetric flask used:_________ mL
- Volume of stock solution used (quantity pipetted into beaker): _________ mL
- Concentration of resulting standard solution:_________ M \(\ce{MnO4^-}\)
- show calculation:
- Wavelength chosen for analysis: _________ nm
- Justification for choice of wavelength:
Data Table:
|
Solution |
Concentration (M) |
Absorbance |
Appearance |
|---|---|---|---|
|
Cuvette (0) (blank) |
|||
|
Cuvette (1) (1 mL / 25 mL) |
|||
|
Cuvette (2) (5 mL / 25 mL) |
|||
|
Cuvette (3) (10 mL / 25 mL) |
|||
|
Cuvette (4) (pure standard) |
Show calculations for the concentrations of cuvettes (1-3) below:
Make a graph of Concentration in Molarity on the x-axis vs. the Measured Absorbance on the y- axis and attach it on the next page. The graph should fill one sheet of paper and may be done by hand or on a computer program such as Excel. Draw a best-fit-line on your graph and be sure it goes through the origin because zeroing your instrument ensured that at zero concentration the absorbance was zero.
Calculate the equation of your best-fit-line and show the calculation and final equation below (use points from the ends of your line and not two actual data points when doing this calculation or use linear regression analysis such as the "trend-line" function in Excel or on a graphing calculator):
- Slope of the line:
- \(E\) = ___________ M-1cm-1
Unknown Analysis
- Unknown ID Code:_________
- Volume of unknown used:_________ mL
- Volume of volumetric flask:_________ mL
- Mass of \(\ce{KIO4}\) (s) added:_________ g
- Observed color of unknown solution after boiling: ____________
- Wavelength used to analyze unknown solution: _________ nm
- Absorbance of unknown solution:_________
- Concentration of \(\ce{MnO4^-}\) in diluted unknown solution:_________ M \(\ce{MnO4^-}\)
- show calculations (hint: this is where you use the slope of your best-fit-line):
- Concentration of \(\ce{Mn^{2+}}\) (aq) in original undiluted unknown sample: _________ M
- show calculations:
- Concentration of \(\ce{Mn^{2+}}\) (aq) in units of mg/mL: _________ mg / mL
- show calculations:
On the back of this page (or on a separate sheet of paper), write a brief one to two paragraph conclusion based on your findings. Include the concentration of manganese present in the ground water sample and your recommendations to the city based on these findings. Support your final recommendation using published standards and not merely the information in this experiment. Be sure to properly cite all references consulted. Keep in mind that ground water is not the same as drinking water or well water when performing your research and writing your conclusions for this report.