
Indicators in Foods
- Page ID
- 50898

\( \newcommand{\vecs}[1]{\overset { \scriptstyle \rightharpoonup} {\mathbf{#1}} } \)
\( \newcommand{\vecd}[1]{\overset{-\!-\!\rightharpoonup}{\vphantom{a}\smash {#1}}} \)
\( \newcommand{\dsum}{\displaystyle\sum\limits} \)
\( \newcommand{\dint}{\displaystyle\int\limits} \)
\( \newcommand{\dlim}{\displaystyle\lim\limits} \)
\( \newcommand{\id}{\mathrm{id}}\) \( \newcommand{\Span}{\mathrm{span}}\)
( \newcommand{\kernel}{\mathrm{null}\,}\) \( \newcommand{\range}{\mathrm{range}\,}\)
\( \newcommand{\RealPart}{\mathrm{Re}}\) \( \newcommand{\ImaginaryPart}{\mathrm{Im}}\)
\( \newcommand{\Argument}{\mathrm{Arg}}\) \( \newcommand{\norm}[1]{\| #1 \|}\)
\( \newcommand{\inner}[2]{\langle #1, #2 \rangle}\)
\( \newcommand{\Span}{\mathrm{span}}\)
\( \newcommand{\id}{\mathrm{id}}\)
\( \newcommand{\Span}{\mathrm{span}}\)
\( \newcommand{\kernel}{\mathrm{null}\,}\)
\( \newcommand{\range}{\mathrm{range}\,}\)
\( \newcommand{\RealPart}{\mathrm{Re}}\)
\( \newcommand{\ImaginaryPart}{\mathrm{Im}}\)
\( \newcommand{\Argument}{\mathrm{Arg}}\)
\( \newcommand{\norm}[1]{\| #1 \|}\)
\( \newcommand{\inner}[2]{\langle #1, #2 \rangle}\)
\( \newcommand{\Span}{\mathrm{span}}\) \( \newcommand{\AA}{\unicode[.8,0]{x212B}}\)
\( \newcommand{\vectorA}[1]{\vec{#1}} % arrow\)
\( \newcommand{\vectorAt}[1]{\vec{\text{#1}}} % arrow\)
\( \newcommand{\vectorB}[1]{\overset { \scriptstyle \rightharpoonup} {\mathbf{#1}} } \)
\( \newcommand{\vectorC}[1]{\textbf{#1}} \)
\( \newcommand{\vectorD}[1]{\overrightarrow{#1}} \)
\( \newcommand{\vectorDt}[1]{\overrightarrow{\text{#1}}} \)
\( \newcommand{\vectE}[1]{\overset{-\!-\!\rightharpoonup}{\vphantom{a}\smash{\mathbf {#1}}}} \)
\( \newcommand{\vecs}[1]{\overset { \scriptstyle \rightharpoonup} {\mathbf{#1}} } \)
\(\newcommand{\longvect}{\overrightarrow}\)
\( \newcommand{\vecd}[1]{\overset{-\!-\!\rightharpoonup}{\vphantom{a}\smash {#1}}} \)
\(\newcommand{\avec}{\mathbf a}\) \(\newcommand{\bvec}{\mathbf b}\) \(\newcommand{\cvec}{\mathbf c}\) \(\newcommand{\dvec}{\mathbf d}\) \(\newcommand{\dtil}{\widetilde{\mathbf d}}\) \(\newcommand{\evec}{\mathbf e}\) \(\newcommand{\fvec}{\mathbf f}\) \(\newcommand{\nvec}{\mathbf n}\) \(\newcommand{\pvec}{\mathbf p}\) \(\newcommand{\qvec}{\mathbf q}\) \(\newcommand{\svec}{\mathbf s}\) \(\newcommand{\tvec}{\mathbf t}\) \(\newcommand{\uvec}{\mathbf u}\) \(\newcommand{\vvec}{\mathbf v}\) \(\newcommand{\wvec}{\mathbf w}\) \(\newcommand{\xvec}{\mathbf x}\) \(\newcommand{\yvec}{\mathbf y}\) \(\newcommand{\zvec}{\mathbf z}\) \(\newcommand{\rvec}{\mathbf r}\) \(\newcommand{\mvec}{\mathbf m}\) \(\newcommand{\zerovec}{\mathbf 0}\) \(\newcommand{\onevec}{\mathbf 1}\) \(\newcommand{\real}{\mathbb R}\) \(\newcommand{\twovec}[2]{\left[\begin{array}{r}#1 \\ #2 \end{array}\right]}\) \(\newcommand{\ctwovec}[2]{\left[\begin{array}{c}#1 \\ #2 \end{array}\right]}\) \(\newcommand{\threevec}[3]{\left[\begin{array}{r}#1 \\ #2 \\ #3 \end{array}\right]}\) \(\newcommand{\cthreevec}[3]{\left[\begin{array}{c}#1 \\ #2 \\ #3 \end{array}\right]}\) \(\newcommand{\fourvec}[4]{\left[\begin{array}{r}#1 \\ #2 \\ #3 \\ #4 \end{array}\right]}\) \(\newcommand{\cfourvec}[4]{\left[\begin{array}{c}#1 \\ #2 \\ #3 \\ #4 \end{array}\right]}\) \(\newcommand{\fivevec}[5]{\left[\begin{array}{r}#1 \\ #2 \\ #3 \\ #4 \\ #5 \\ \end{array}\right]}\) \(\newcommand{\cfivevec}[5]{\left[\begin{array}{c}#1 \\ #2 \\ #3 \\ #4 \\ #5 \\ \end{array}\right]}\) \(\newcommand{\mattwo}[4]{\left[\begin{array}{rr}#1 \amp #2 \\ #3 \amp #4 \\ \end{array}\right]}\) \(\newcommand{\laspan}[1]{\text{Span}\{#1\}}\) \(\newcommand{\bcal}{\cal B}\) \(\newcommand{\ccal}{\cal C}\) \(\newcommand{\scal}{\cal S}\) \(\newcommand{\wcal}{\cal W}\) \(\newcommand{\ecal}{\cal E}\) \(\newcommand{\coords}[2]{\left\{#1\right\}_{#2}}\) \(\newcommand{\gray}[1]{\color{gray}{#1}}\) \(\newcommand{\lgray}[1]{\color{lightgray}{#1}}\) \(\newcommand{\rank}{\operatorname{rank}}\) \(\newcommand{\row}{\text{Row}}\) \(\newcommand{\col}{\text{Col}}\) \(\renewcommand{\row}{\text{Row}}\) \(\newcommand{\nul}{\text{Nul}}\) \(\newcommand{\var}{\text{Var}}\) \(\newcommand{\corr}{\text{corr}}\) \(\newcommand{\len}[1]{\left|#1\right|}\) \(\newcommand{\bbar}{\overline{\bvec}}\) \(\newcommand{\bhat}{\widehat{\bvec}}\) \(\newcommand{\bperp}{\bvec^\perp}\) \(\newcommand{\xhat}{\widehat{\xvec}}\) \(\newcommand{\vhat}{\widehat{\vvec}}\) \(\newcommand{\uhat}{\widehat{\uvec}}\) \(\newcommand{\what}{\widehat{\wvec}}\) \(\newcommand{\Sighat}{\widehat{\Sigma}}\) \(\newcommand{\lt}{<}\) \(\newcommand{\gt}{>}\) \(\newcommand{\amp}{&}\) \(\definecolor{fillinmathshade}{gray}{0.9}\)In most titrations it is necessary to add an indicator which produces a sudden color change at the equivalence point. Indicators are compounds with acid-base properties in which the acid form of the compound can be distinguished from its basic form by their characteristic colors. As the structure of the compound changes between its acid and basic form, so it does its light absorption properties resulting in a distinctive color change.
Natural food colors as indicators
Essentially, all the natural pigments found in food products with acid-base properties can be used as indicators not only to determine the approximate the pH of the foods that contain them, but also the pH of other products. For example, a grape extract containing anthocyanins can be used to estimate the pH of drinking water or a solution of sodium hydroxide.
In their acid form, anthocyanins are red with dissociation constants (Ka) ranging from 1.41 x 10⁻⁵ to 4.36 x 10⁻⁴ mol dm–3 [1], while their conjugate bases are blue. In order to simplify, we will call acid anthocyanins, HIn (protonated indicator) and their blue conjugate bases as In–. In aqueous solution, anthocyanins will present the following equilibrium
\[\ce{HIn + H2O <-> In- + H3O+} \]
According to Le Chatelier’s principle, the equilibrium shown in equation (1) will be shifted to the left if H3O+ is added. Thus in a strongly acidic solution we expect nearly all the blue In– to be consumed, and only red HIn will remain. On the other hand, if the solution is made strongly basic, the equilibrium will shift to the right because OH– ions will react with HIn molecules, converting them to In–. Thus the anthocynins solution will become blue.
Clearly there must be some intermediate situation where half the anthocynins are in the red acid form and half in the blue conjugate-base form. That is, at some pH
\[\text{[HIn]} = [\text{In}^-]\]
&nbnbsp; [HIn] = [In–]
This intermediate pH can be calculated by applying the Henderson-Hasselbalch equation to the indicator equilibrium:
\[\text{pH} = \text{pK}_a + \text{log}\dfrac{[\text{In}^-]}{[\text{HIn}]}\]
Thus at the point where half the indicator is conjugate acid and half conjugate base,
\[\text{pH} = \text{pK}_a + \text{log 1} = \text{pK}_a\]
For anthocyanins, we have
\[\text{pH} = \text{pK}_a = -\text{log(1.4} \times \text{10}^{-5}) = \text{4.8}\]
and
\[\text{pH} = \text{pK}_a = -\text{log(4.4} \times \text{10}^{-4}) = \text{3.3}\]
so we expect anthocyanins to change color in pH values around 4.8 and 3.3.
Table \(\PageIndex{1}\) The pH and Color of Anthocyanins
| pH |
Color of anthocyanins |
| 1 | red |
| 4 | blue-red |
| 6 | purple |
| 8 | blue |
| 12 | green |
| 13 | yellow |
The table above displays the color change of anthocyanins with respect to pH. Besides the most evident color change from red to blue, anthocyanins display additional colors in function of pH. They have intermediate acid-base equilibria responsible for these colors. In consequence, anthocyanins can be used as indicators in an ample pH range.
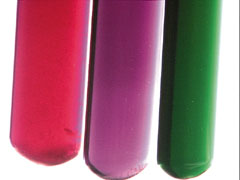
Figure \(\PageIndex{1}\) Anthocyanins from petunias[2].
Notice that we have referred to our indicator as "anthocyanins" and we worked with a range of Ka specifying that we are talking about a group of compounds not a single pure compound. Purification and isolation of a single anthocyanin requires numerous steps making the high purity product very expensive and unsuitable for use as indicator in routine titrations or pH estimations. For this reason, most of the natural food colors are used as indicators as a group of compounds.
When working with color extracts of food as indicators, we must also take into account that they may contain not only one group of color compounds with acid-base properties, but several of them. For example, in red cabbage, we will find anthocyanins and anthoxanthins. The acid form of anthocyanins tends to be red while its basic form is blue. Anthoxanthins are colorless in acidic conditions and yellow at basic pH. We should expect then that a raw extract of red cabbage would display a combination of these colors. At basic pH, for example, we can expect to observe a green coloration.
Example \(\PageIndex{1}\): pH Based on Color
Table \(\PageIndex{2}\) shows the color observed in different food products when a few drops of a grape skin extract containing anthocyanins were added to them. What is the approximate pH of these foods?.
Solution From the color displayed by the grape skin extract containing anthocyanins we can say that the pH of graham crackers is in the vicinity of pH 8, while the pH of honey is more acid, around 4. Oysters would have a pH around 6 as indicated by the purple coloration of the anthocyanin extract. We expect soft drinks to have an acidic character, the red coloration of the indicator implies that the pH of lime soda is around 1. We know that this is an extremely acidic pH for a soda, unfortunately this anthocyanin indicator does not allow us to discriminate pH values between 1 and 4. Finally, since the extract presented a blue/purple coloration in tofu, its pH must be between 6 and 8.
Table \(\PageIndex{2}\): Different Colors of Foods with Grape Skin Extract
| Food | Color displayed upon addition of grape skin extract |
| Graham crackers | Blue |
| Honey | Dark red |
| Oysters | Purple |
| Lime soda | Red |
| Tofu | Blue/Purple |
Synthetic indicators
Indicators are employed in titrations to determine the composition of food, monitor processes (fermentations), evaluate storage conditions, and assess the safety and quality of foodstuffs. When we want to obtain more specific pH values for quantitative purposes, we choose single pure compounds obtained by synthesis as indicators. The pKa and the pH at which these indicators undergo color change are well known and their cost is significantly lower than that of pure natural indicators. The table below displays a list of indicators with their corresponding pKas and color properties. One of the most used indicators in acid-base titrations is phenolphthalein whose acid form is colorless and its conjugate base is red (fucsia). The compounds listed have been selected so that their pKa values are approximately two units apart. Consequently, they offer a series of color changes spanning the whole pH range.
Table \(\PageIndex{3}\) Properties of selected indicators
| Color | ||||
| Name | pKa | Effective pH range | Acid form | Basic form |
| Thymol blue | 1.6 | 1.2 - 2.8 | Red | Yellow |
| Methyl orange | 4.2 | 3.1 - 4.4 | Red | Orange |
| Methyl red | 5.0 | 4.2 - 6.2 | Red | Yellow |
| Bromothymol blue | 7.1 | 6.0 - 7.8 | Yellow | Blue |
| Phenolphthalein | 9.5 | 8.3 - 10.0 | Colorless | Red |
| Alizarin yellow | 11.0 | 10.1 - 12.4 | Yellow | Red |
Indicators are often used to make measurements of pH which are precise to about 0.2 or 0.3 units. Suppose, for example, we add two drops of bromothymol blue to a sample of tap water and obtain a green-blue solution. Since bromothymol blue is green at a pH of 6 and blue at a pH of 8, we conclude that the pH is between these two limits. A more precise result could be obtained by comparing the color in the tap water with that obtained when two drops of indicator solution are added to buffer solutions of pH 6.5 and 7.5.
Example \(\PageIndex{2}\): Indicator Selection
What indicator, from those listed in the table, would you use to determine the approximate pH of the following foods:
a) Cow's milk
b) Canned cranberry juice
c) Egg whites
d) Cucumbers
e) Ketchup
Solution
From the table presented in pH and pOH in Food Color we have that the pH of a) cow's milk is 6.40 - 6.80, so bromothymol blue would be a suitable indicator. The pH of b) canned cranberry juice ranges from 2.30 to 2.52 and thymol blue can give us an approximate pH value. c) Egg whites have a basic pH of 7.96, in this case, bromothymol blue and phenolphthalein can provide an approximate pH value. d) Cucumbers are relatively acidic with pH above 5, methyl red would be a suitable indicator for this product. Finally, methyl orange would be the indicator choice for ketchup whose pH ranges from 3.89 to 3.92.
If a careful choice of both colors and pKa is made, it is possible to mix several indicators and obtain a universal indicator which changes color continuously over a very wide pH range. With such a mixture it is possible to find the approximate pH of any solution within this range. So-called pH paper is impregnated with one or several indicators. When a strip of this paper is immersed in a solution, its pH can be judged from the resulting color.
Example \(\PageIndex{3}\): Indicators for pH of Foods
What indicator, from those listed in the table, would you use to determine the approximate pH of the following solutions of compounds often found in food:
a) 0.100 M , N(CH3)3 (trimethyl amine)
b) 0.100 M C5H6COOH (benzoic acid)
c) A buffer mixture of of NaH2PO4 and Na2HPO4
d) 1.0 M NH4NO3 (ammonium nitrate)
a) Since we have a dilute solution of a weak base, we expect the solution to be only mildly basic with a pH around 11. Alizarin yellow would be the most suitable indicator.
b) We expect a solution of benzoic acid like this to have a pH around 3.0. From the table, both thymol blue or methyl orange could provide an approximate pH for this solution.
c) The pH of this buffer is expected to be close to 7.2, the pKa for the pair H2PO4–/HPO42–. Therefore, bromothymol blue would be a good indicator for this solution.
d) The nitrate ion is neutral while NH4+ is a weak acid. Since this is a relatively concentrated solution, it could have a pH around 5 and methyl red would work as indicator.
From ChemPRIME: 14.8: Indicators
References
Contributors and Attributions
Ed Vitz (Kutztown University), John W. Moore (UW-Madison), Justin Shorb (Hope College), Xavier Prat-Resina (University of Minnesota Rochester), Tim Wendorff, and Adam Hahn.