
Measurement of Isotopic Signatures for Ecological Studies
- Page ID
- 50782

\( \newcommand{\vecs}[1]{\overset { \scriptstyle \rightharpoonup} {\mathbf{#1}} } \)
\( \newcommand{\vecd}[1]{\overset{-\!-\!\rightharpoonup}{\vphantom{a}\smash {#1}}} \)
\( \newcommand{\id}{\mathrm{id}}\) \( \newcommand{\Span}{\mathrm{span}}\)
( \newcommand{\kernel}{\mathrm{null}\,}\) \( \newcommand{\range}{\mathrm{range}\,}\)
\( \newcommand{\RealPart}{\mathrm{Re}}\) \( \newcommand{\ImaginaryPart}{\mathrm{Im}}\)
\( \newcommand{\Argument}{\mathrm{Arg}}\) \( \newcommand{\norm}[1]{\| #1 \|}\)
\( \newcommand{\inner}[2]{\langle #1, #2 \rangle}\)
\( \newcommand{\Span}{\mathrm{span}}\)
\( \newcommand{\id}{\mathrm{id}}\)
\( \newcommand{\Span}{\mathrm{span}}\)
\( \newcommand{\kernel}{\mathrm{null}\,}\)
\( \newcommand{\range}{\mathrm{range}\,}\)
\( \newcommand{\RealPart}{\mathrm{Re}}\)
\( \newcommand{\ImaginaryPart}{\mathrm{Im}}\)
\( \newcommand{\Argument}{\mathrm{Arg}}\)
\( \newcommand{\norm}[1]{\| #1 \|}\)
\( \newcommand{\inner}[2]{\langle #1, #2 \rangle}\)
\( \newcommand{\Span}{\mathrm{span}}\) \( \newcommand{\AA}{\unicode[.8,0]{x212B}}\)
\( \newcommand{\vectorA}[1]{\vec{#1}} % arrow\)
\( \newcommand{\vectorAt}[1]{\vec{\text{#1}}} % arrow\)
\( \newcommand{\vectorB}[1]{\overset { \scriptstyle \rightharpoonup} {\mathbf{#1}} } \)
\( \newcommand{\vectorC}[1]{\textbf{#1}} \)
\( \newcommand{\vectorD}[1]{\overrightarrow{#1}} \)
\( \newcommand{\vectorDt}[1]{\overrightarrow{\text{#1}}} \)
\( \newcommand{\vectE}[1]{\overset{-\!-\!\rightharpoonup}{\vphantom{a}\smash{\mathbf {#1}}}} \)
\( \newcommand{\vecs}[1]{\overset { \scriptstyle \rightharpoonup} {\mathbf{#1}} } \)
\( \newcommand{\vecd}[1]{\overset{-\!-\!\rightharpoonup}{\vphantom{a}\smash {#1}}} \)
\(\newcommand{\avec}{\mathbf a}\) \(\newcommand{\bvec}{\mathbf b}\) \(\newcommand{\cvec}{\mathbf c}\) \(\newcommand{\dvec}{\mathbf d}\) \(\newcommand{\dtil}{\widetilde{\mathbf d}}\) \(\newcommand{\evec}{\mathbf e}\) \(\newcommand{\fvec}{\mathbf f}\) \(\newcommand{\nvec}{\mathbf n}\) \(\newcommand{\pvec}{\mathbf p}\) \(\newcommand{\qvec}{\mathbf q}\) \(\newcommand{\svec}{\mathbf s}\) \(\newcommand{\tvec}{\mathbf t}\) \(\newcommand{\uvec}{\mathbf u}\) \(\newcommand{\vvec}{\mathbf v}\) \(\newcommand{\wvec}{\mathbf w}\) \(\newcommand{\xvec}{\mathbf x}\) \(\newcommand{\yvec}{\mathbf y}\) \(\newcommand{\zvec}{\mathbf z}\) \(\newcommand{\rvec}{\mathbf r}\) \(\newcommand{\mvec}{\mathbf m}\) \(\newcommand{\zerovec}{\mathbf 0}\) \(\newcommand{\onevec}{\mathbf 1}\) \(\newcommand{\real}{\mathbb R}\) \(\newcommand{\twovec}[2]{\left[\begin{array}{r}#1 \\ #2 \end{array}\right]}\) \(\newcommand{\ctwovec}[2]{\left[\begin{array}{c}#1 \\ #2 \end{array}\right]}\) \(\newcommand{\threevec}[3]{\left[\begin{array}{r}#1 \\ #2 \\ #3 \end{array}\right]}\) \(\newcommand{\cthreevec}[3]{\left[\begin{array}{c}#1 \\ #2 \\ #3 \end{array}\right]}\) \(\newcommand{\fourvec}[4]{\left[\begin{array}{r}#1 \\ #2 \\ #3 \\ #4 \end{array}\right]}\) \(\newcommand{\cfourvec}[4]{\left[\begin{array}{c}#1 \\ #2 \\ #3 \\ #4 \end{array}\right]}\) \(\newcommand{\fivevec}[5]{\left[\begin{array}{r}#1 \\ #2 \\ #3 \\ #4 \\ #5 \\ \end{array}\right]}\) \(\newcommand{\cfivevec}[5]{\left[\begin{array}{c}#1 \\ #2 \\ #3 \\ #4 \\ #5 \\ \end{array}\right]}\) \(\newcommand{\mattwo}[4]{\left[\begin{array}{rr}#1 \amp #2 \\ #3 \amp #4 \\ \end{array}\right]}\) \(\newcommand{\laspan}[1]{\text{Span}\{#1\}}\) \(\newcommand{\bcal}{\cal B}\) \(\newcommand{\ccal}{\cal C}\) \(\newcommand{\scal}{\cal S}\) \(\newcommand{\wcal}{\cal W}\) \(\newcommand{\ecal}{\cal E}\) \(\newcommand{\coords}[2]{\left\{#1\right\}_{#2}}\) \(\newcommand{\gray}[1]{\color{gray}{#1}}\) \(\newcommand{\lgray}[1]{\color{lightgray}{#1}}\) \(\newcommand{\rank}{\operatorname{rank}}\) \(\newcommand{\row}{\text{Row}}\) \(\newcommand{\col}{\text{Col}}\) \(\renewcommand{\row}{\text{Row}}\) \(\newcommand{\nul}{\text{Nul}}\) \(\newcommand{\var}{\text{Var}}\) \(\newcommand{\corr}{\text{corr}}\) \(\newcommand{\len}[1]{\left|#1\right|}\) \(\newcommand{\bbar}{\overline{\bvec}}\) \(\newcommand{\bhat}{\widehat{\bvec}}\) \(\newcommand{\bperp}{\bvec^\perp}\) \(\newcommand{\xhat}{\widehat{\xvec}}\) \(\newcommand{\vhat}{\widehat{\vvec}}\) \(\newcommand{\uhat}{\widehat{\uvec}}\) \(\newcommand{\what}{\widehat{\wvec}}\) \(\newcommand{\Sighat}{\widehat{\Sigma}}\) \(\newcommand{\lt}{<}\) \(\newcommand{\gt}{>}\) \(\newcommand{\amp}{&}\) \(\definecolor{fillinmathshade}{gray}{0.9}\)Isotopic Signatures in Ecological Studies IWC replica Réplica de reloj In a previous section, we saw that isotopic signatures can be used to trace origins of birds and butterflies. Here, we'll see how the isotopic signature ratio, " δ" is calculated. For example, δ13C designates the ratio of isotopic abundances of isotopes 13C and 12C:

These ratios change slightly depending on the source of the element. For example, biogenic and inorganic carbon compounds, or biogenic carbon compounds from different regions, usually have slightly different δ13C values, so the atomic weight of carbon actually varies!
But if isotopes of an element all behave chemically the same, how are they separated and measured? And if we're really talking about atomic weights (as opposed to molar masses), how can something so incredibly small be measured?
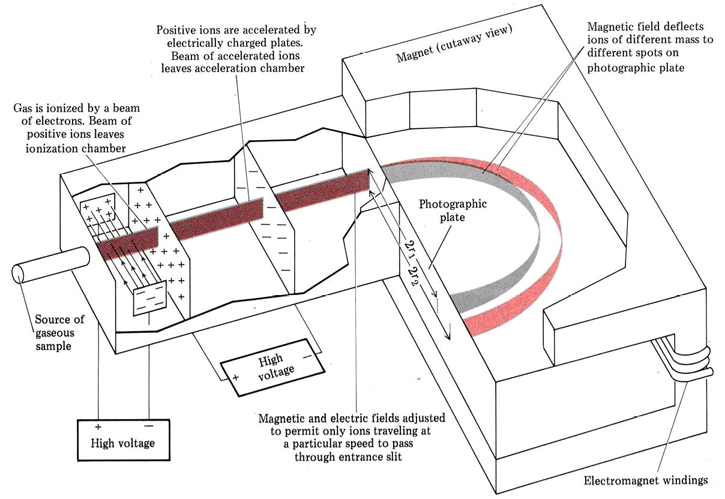
You may have wondered why we have been so careful to define atomic weights and nuclidic masses as ratios of masses. The reason will be clearer once the most important and accurate experimental technique by which isotopic weights are measured has been described. This technique, called mass spectrometry, has developed from the experiments with cathode-ray tubes mentioned earlier in this chapter. It depends on the fact that an electrically charged particle passing through a magnetic field of constant strength moves in a circular path. The radius r of such a path is directly proportional to the mass m and the speed u of the particle, and inversely proportional to the charge Q. Thus the greater the mass or speed of the particle, the greater the radius of its path. The greater the charge, the smaller the radius. In a mass spectrometer, as seen below, atoms or molecules in the gaseous phase are bombarded by a beam of electrons. Occasionally one of these electrons will strike another electron in a particular atom, and both electrons will have enough energy to escape the attraction of the positive nucleus. This leaves behind a positive ion since the atom now has one more proton than it has electrons. For example, \({}_{6}^{12}\text{C}\) + e–(high-speed electron) → 126C + + 2e–
Once positive ions are produced in a mass spectrometer, they are accelerated by the attraction of a negative electrode and pass through a slit. This produces a narrow beam of ions traveling parallel to one another. The beam then passes through electric and magnetic fields. The fields deflect away all ions except those traveling at a certain speed.
The beam of ions is then passed between the poles of a large electromagnet. Since the speed and charge are the same for all ions, the radii of their paths depend only on their masses. For different ions of masses m1 and m2
\[\dfrac{r_{\text{2}}}{r_{\text{1}}}=\dfrac{m_{\text{2}}}{m_{\text{1}}}\]
and the ratio of masses may be obtained by measuring the ratio of radii, The paths of the ions are determined either by a photographic plate (which darkens where the ions strike it, as in the figure) or a metal plate connected to a galvanometer (a device which detects the electric current due to the beam of charged ions).
Example \(\PageIndex{1}\): Relative Atomic Masses
When a sample of carbon is vaporized in a mass spectrometer, two lines are observed on the photographic plate. The darker line is 27.454 cm, and the other is 29.749 cm from the entrance slit. Determine the relative atomic masses (isotopic weights) of the two isotopes of carbon.
Solution Since the distance from the entrance slit to the line on the photographic plate is twice the radius of the circular path of the ions, we have
\(\dfrac{m_{\text{2}}}{m_{\text{1}}}=\dfrac{r_{\text{2}}}{r_{\text{1}}} =\dfrac{2r_{\text{2}}}{2r_{\text{1}}} = \dfrac{\text{29.749}}{\text{27.454}} = \text{1.08359} \)
Thus m2 = 1.083m1. If we assume that the darker mark on the photographic plate is produced because there are a greater number of \({}_{6}^{12}\text{C}\)+ ions than of the less common 136C+, then m1 may be equated with the relative mass of 126C and may be assigned a value of 12.000 000 exactly. The isotopic weight of 126C is then
\(\text{m}_2 = \text{1.08359} \times \text{12.00000} = \text{13.0031}\)
Notice that in mass spectrometry all that is required is that the charge and speed of the two ions whose relative masses are to be determined be the same. If the mass of an individual ion were to be measured accurately, its actual speed upon entering the magnetic field and the exact magnitude of its electric charge would have to be known very accurately. Therefore it is easier to measure the ratio of two masses than to determine a single absolute mass, and so atomic weights are reported as pure numbers.
From ChemPRIME: 4.14: Measurement of Atomic Weights
Contributors and Attributions
Ed Vitz (Kutztown University), John W. Moore (UW-Madison), Justin Shorb (Hope College), Xavier Prat-Resina (University of Minnesota Rochester), Tim Wendorff, and Adam Hahn.