
Calculating S/N
- Page ID
- 77470

Calculating the signal to noise ratio based on our brief discussion of Gaussian statistics can be achieved as follows:
- Find a section of the data that contains a representative baseline. Notice that on the chart, the representative baseline does not contain any signal.
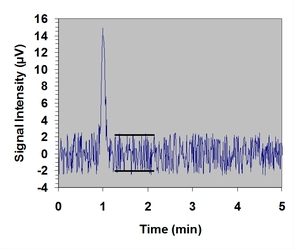
Estimate peak-to-peak noise (VN)
If the data is on a piece of paper, draw two lines that are parallel with the baseline and tangential to the edges of the baseline. See the example above.
If the data is digitized (e.g. in a spreadsheet or text file), locate the maximum and minimum values in a representative section of the dataset that only represents the noise level.
Estimate root mean square noise
- Calculate the standard deviation of the noise voltage (expressed as VRMS, the square root of the mean squared voltage for a given frequency range). At the 99% confidence level: VN = ±2.58σ
\[\mathrm{σ = V_{RMS} = \dfrac{VN}{±2.58} = \dfrac{(V_{max} - V_{min})}{5.16} = \dfrac{(2.50 - (- 2.50))}{5.16} = 0.97\: V}\]
- Estimate the S/N. The signal is 16.0 μV.
Estimating S/N
First, calculate the standard deviation (VRMS) of the noise. At the 99% confidence level: VN = ±2.58σ.Therefore:
\[\mathrm{σ = \dfrac{V_N}{±2.58} = \dfrac{(V_{max} - V_{min})}{5.16} = \dfrac{(2.50 - (-2.50))}{5.16} = 0.97\: V}\]
Second, calculate the S/N. The signal is 16.0 μV.
\[\mathrm{\dfrac{S}{N} = \dfrac{16.0\: μV}{0.97\: μV} = 16.5}\]