
19.15: 19.14 Spectroscopy of Aldehydes and Ketones
- Page ID
- 162236
\( \newcommand{\vecs}[1]{\overset { \scriptstyle \rightharpoonup} {\mathbf{#1}} } \)
\( \newcommand{\vecd}[1]{\overset{-\!-\!\rightharpoonup}{\vphantom{a}\smash {#1}}} \)
\( \newcommand{\id}{\mathrm{id}}\) \( \newcommand{\Span}{\mathrm{span}}\)
( \newcommand{\kernel}{\mathrm{null}\,}\) \( \newcommand{\range}{\mathrm{range}\,}\)
\( \newcommand{\RealPart}{\mathrm{Re}}\) \( \newcommand{\ImaginaryPart}{\mathrm{Im}}\)
\( \newcommand{\Argument}{\mathrm{Arg}}\) \( \newcommand{\norm}[1]{\| #1 \|}\)
\( \newcommand{\inner}[2]{\langle #1, #2 \rangle}\)
\( \newcommand{\Span}{\mathrm{span}}\)
\( \newcommand{\id}{\mathrm{id}}\)
\( \newcommand{\Span}{\mathrm{span}}\)
\( \newcommand{\kernel}{\mathrm{null}\,}\)
\( \newcommand{\range}{\mathrm{range}\,}\)
\( \newcommand{\RealPart}{\mathrm{Re}}\)
\( \newcommand{\ImaginaryPart}{\mathrm{Im}}\)
\( \newcommand{\Argument}{\mathrm{Arg}}\)
\( \newcommand{\norm}[1]{\| #1 \|}\)
\( \newcommand{\inner}[2]{\langle #1, #2 \rangle}\)
\( \newcommand{\Span}{\mathrm{span}}\) \( \newcommand{\AA}{\unicode[.8,0]{x212B}}\)
\( \newcommand{\vectorA}[1]{\vec{#1}} % arrow\)
\( \newcommand{\vectorAt}[1]{\vec{\text{#1}}} % arrow\)
\( \newcommand{\vectorB}[1]{\overset { \scriptstyle \rightharpoonup} {\mathbf{#1}} } \)
\( \newcommand{\vectorC}[1]{\textbf{#1}} \)
\( \newcommand{\vectorD}[1]{\overrightarrow{#1}} \)
\( \newcommand{\vectorDt}[1]{\overrightarrow{\text{#1}}} \)
\( \newcommand{\vectE}[1]{\overset{-\!-\!\rightharpoonup}{\vphantom{a}\smash{\mathbf {#1}}}} \)
\( \newcommand{\vecs}[1]{\overset { \scriptstyle \rightharpoonup} {\mathbf{#1}} } \)
\( \newcommand{\vecd}[1]{\overset{-\!-\!\rightharpoonup}{\vphantom{a}\smash {#1}}} \)
\(\newcommand{\avec}{\mathbf a}\) \(\newcommand{\bvec}{\mathbf b}\) \(\newcommand{\cvec}{\mathbf c}\) \(\newcommand{\dvec}{\mathbf d}\) \(\newcommand{\dtil}{\widetilde{\mathbf d}}\) \(\newcommand{\evec}{\mathbf e}\) \(\newcommand{\fvec}{\mathbf f}\) \(\newcommand{\nvec}{\mathbf n}\) \(\newcommand{\pvec}{\mathbf p}\) \(\newcommand{\qvec}{\mathbf q}\) \(\newcommand{\svec}{\mathbf s}\) \(\newcommand{\tvec}{\mathbf t}\) \(\newcommand{\uvec}{\mathbf u}\) \(\newcommand{\vvec}{\mathbf v}\) \(\newcommand{\wvec}{\mathbf w}\) \(\newcommand{\xvec}{\mathbf x}\) \(\newcommand{\yvec}{\mathbf y}\) \(\newcommand{\zvec}{\mathbf z}\) \(\newcommand{\rvec}{\mathbf r}\) \(\newcommand{\mvec}{\mathbf m}\) \(\newcommand{\zerovec}{\mathbf 0}\) \(\newcommand{\onevec}{\mathbf 1}\) \(\newcommand{\real}{\mathbb R}\) \(\newcommand{\twovec}[2]{\left[\begin{array}{r}#1 \\ #2 \end{array}\right]}\) \(\newcommand{\ctwovec}[2]{\left[\begin{array}{c}#1 \\ #2 \end{array}\right]}\) \(\newcommand{\threevec}[3]{\left[\begin{array}{r}#1 \\ #2 \\ #3 \end{array}\right]}\) \(\newcommand{\cthreevec}[3]{\left[\begin{array}{c}#1 \\ #2 \\ #3 \end{array}\right]}\) \(\newcommand{\fourvec}[4]{\left[\begin{array}{r}#1 \\ #2 \\ #3 \\ #4 \end{array}\right]}\) \(\newcommand{\cfourvec}[4]{\left[\begin{array}{c}#1 \\ #2 \\ #3 \\ #4 \end{array}\right]}\) \(\newcommand{\fivevec}[5]{\left[\begin{array}{r}#1 \\ #2 \\ #3 \\ #4 \\ #5 \\ \end{array}\right]}\) \(\newcommand{\cfivevec}[5]{\left[\begin{array}{c}#1 \\ #2 \\ #3 \\ #4 \\ #5 \\ \end{array}\right]}\) \(\newcommand{\mattwo}[4]{\left[\begin{array}{rr}#1 \amp #2 \\ #3 \amp #4 \\ \end{array}\right]}\) \(\newcommand{\laspan}[1]{\text{Span}\{#1\}}\) \(\newcommand{\bcal}{\cal B}\) \(\newcommand{\ccal}{\cal C}\) \(\newcommand{\scal}{\cal S}\) \(\newcommand{\wcal}{\cal W}\) \(\newcommand{\ecal}{\cal E}\) \(\newcommand{\coords}[2]{\left\{#1\right\}_{#2}}\) \(\newcommand{\gray}[1]{\color{gray}{#1}}\) \(\newcommand{\lgray}[1]{\color{lightgray}{#1}}\) \(\newcommand{\rank}{\operatorname{rank}}\) \(\newcommand{\row}{\text{Row}}\) \(\newcommand{\col}{\text{Col}}\) \(\renewcommand{\row}{\text{Row}}\) \(\newcommand{\nul}{\text{Nul}}\) \(\newcommand{\var}{\text{Var}}\) \(\newcommand{\corr}{\text{corr}}\) \(\newcommand{\len}[1]{\left|#1\right|}\) \(\newcommand{\bbar}{\overline{\bvec}}\) \(\newcommand{\bhat}{\widehat{\bvec}}\) \(\newcommand{\bperp}{\bvec^\perp}\) \(\newcommand{\xhat}{\widehat{\xvec}}\) \(\newcommand{\vhat}{\widehat{\vvec}}\) \(\newcommand{\uhat}{\widehat{\uvec}}\) \(\newcommand{\what}{\widehat{\wvec}}\) \(\newcommand{\Sighat}{\widehat{\Sigma}}\) \(\newcommand{\lt}{<}\) \(\newcommand{\gt}{>}\) \(\newcommand{\amp}{&}\) \(\definecolor{fillinmathshade}{gray}{0.9}\)After completing this section, you should be able to
- identify the region of the infrared spectrum in which the carbonyl absorption of aldehydes and ketones is found.
- identify the region of the infrared spectrum in which the two characteristic C$\ce{-}$H absorptions of aldehydes are found.
- use a table of characteristic absorption frequencies to assist in the determination of the structure of an unknown aldehyde or ketone, given its infrared spectrum and other spectral or experimental data.
- identify the region of a proton NMR spectrum in which absorptions caused by the presence of aldehydic protons and protons attached to the α‑carbon atoms of aldehydes and ketones occur.
- identify two important fragmentations that occur when aliphatic aldehydes and ketones are subjected to analysis by mass spectrometry.
Make certain that you can define, and use in context, the key term below.
- McLafferty rearrangement
The appearance of a strong absorption at 1660–1770 cm−1 in the infrared spectrum of a compound is a clear indication of the presence of a carbonyl group. Although you need not remember the detailed absorptions it is important that you realize that the precise wavenumber of the infrared absorption can often provide some quite specific information about the environment of the carbonyl group in a compound. Notice how conjugation between a carbonyl group and a double bond (α, β‑unsaturated aldehyde or ketone or aromatic ring) lowers the absorption by about 25–30 cm−1.
You may wish to review the McLafferty rearrangement and the alpha cleavage in Section 12.3.
IR Spectra
Ketones
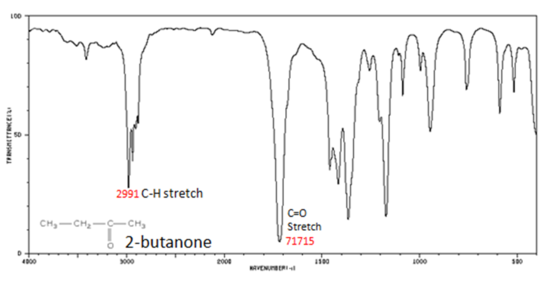
The carbonyl (C=O) stretching vibration band of saturated aliphatic ketones appears at:
- Aliphatic ketones 1715 cm-1
- α, β‑unsaturated (enone) 1685-1666 cm-1
Figure 8. shows the spectrum of 2-butanone. This is a saturated ketone, and the C=O band appears at 1715.
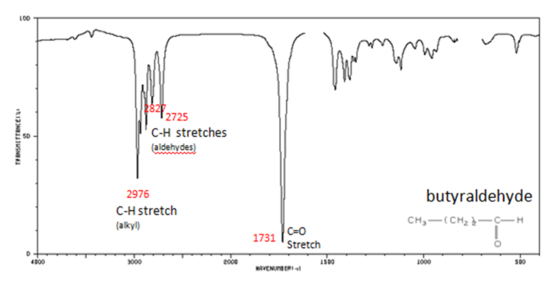
Aldehyde
In the IR spectra of an aldehyde, a peak usually appears around 2720 cm-1 and often appears as a shoulder-type peak just to the right of the alkyl C–H stretches.
H–C=O stretch 2830-2695 cm-1
C=O stretch
- Aliphatic aldehydes 1740-1720 cm-1
- α, β‑unsaturated aldehydes (enones) 1710-1685 cm-1
Figure 9. shows the spectrum of butyraldehyde.
1H NMR Spectra
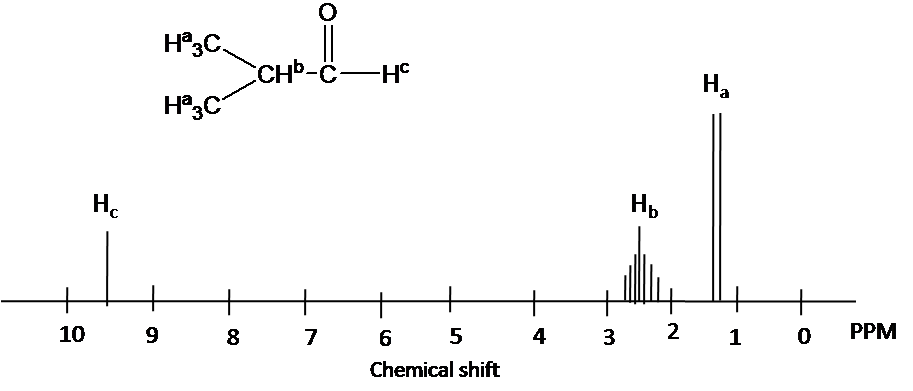
Hydrogens attached to a carbon adjacent to the sp2 hybridized carbon in aldehydes and ketones are deshielded due the anisotropy created by the C=O bond and usually show up at 2.0-2.5 ppm.

Aldehyde hydrogens are highly deshielded, appearing far downfield at 9-10 ppm, due the anisotropy created by the pi electrons of the C=O bond, and induction caused by the highly electronegative oxygen atom.

The 1H NMR spectra of 2-methylpropanal is shown below. The methyl groups, (Hb), show up at 1.1 ppm. The -CH- group is moved downfield due to effect an adjacent aldehyde group (2.4 ppm). The chemical shift of aldehyde hydrogen is highly deshielded (9.6 ppm). Splitting pattern is determined by (N+1) rule: Ha is split into two peaks by Hb(#of proton=1). Hb has the septet pattern by Ha (#of proton=6). Hc has one peak. (Note that Hc has doublet pattern by Hb due to vicinal proton-proton coupling.)
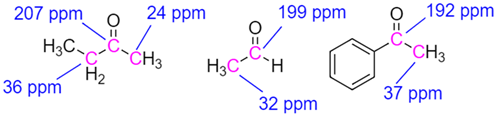
13C NMR Spectra
Aldehydes and ketones have distinctive 13C NMR peaks which appear in the range 190 to 215 ppm range. Very few types of carbons absorb in this range so the presence of 13C peak around 200 ppm is considered evidence for a carbonyl group.
Mass Spectra
Aldehydes and ketones generally give moderately intense signals due to their molecular ions, \(\ce{M^+}\). Thus the determination of the molecular weight of a ketone by mass spectroscopy usually is not difficult. Furthermore, there are some characteristic fragmentation patterns that aid in structural identification. These are:
- Formation of the molecular ion:

- \(\alpha\) cleavage to form an acylium ion. This is usually the base peak in the mass spectra.


- A common fragmentation pattern for larger carbonyl compounds is a transfer of \(\gamma\) hydrogen with \(\beta\) cleavage called the McLafferty rearrangement:


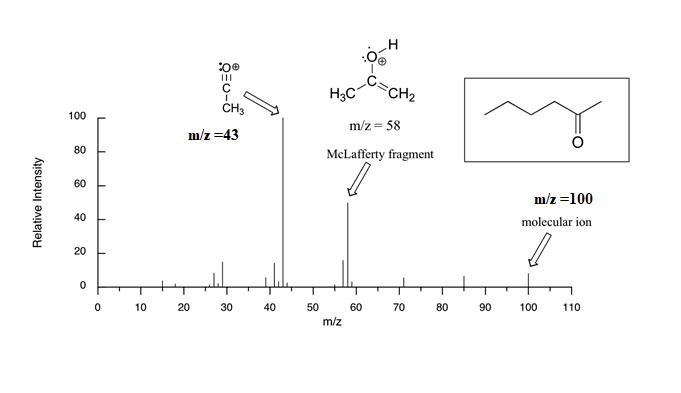
The mass spectrum of 2-hexanone shows a 'McLafferty fragment' at m/z = 58, while the propene fragment is not observed because it is a neutral species (remember, only cationic fragments are observed in MS). The base peak in this spectrum is an acylium ion formed after alpha cleavage is at m/z = 43. The molecular ion peak is at m/z =100.
Electronic Absorption Spectra

The absorption at 277 nm for 2-butanone is an n → pi∗ transition, and with 3-buten-2-one, this absorption shifts to longer wavelengths (324 nm). There is also an intense absorption band for 3-buten-2-one at 219 nm, which is a pi →pi∗ transition. With 2-butanone a corresponding absorption occurs at 185 nm, which is out of the range of the spectrometer used to take the spectra.

Exercises
1) What are the masses of all the components in the following fragmentations?

2) A mixture was separated into three fractions: A, B, and C. Elemental analysis reveals that the fractions are structural isomers with the following composition: 69.72% C, 11.70% H, and 18.58% O. The IR spectra for all fractions show several moderate bands around 2950 cm-1, and a strong band near 1700 cm-1. The proton and 13C NMR spectra for each fraction are shown below. Give the common name and draw the bond-line structure for each fraction and correlate the NMR signals with their respective atoms.

Solutions
1)

2)
