5.3: NMR Spectroscopy
- Last updated
- Save as PDF
- Page ID
- 167053
\( \newcommand{\vecs}[1]{\overset { \scriptstyle \rightharpoonup} {\mathbf{#1}} } \)
\( \newcommand{\vecd}[1]{\overset{-\!-\!\rightharpoonup}{\vphantom{a}\smash {#1}}} \)
\( \newcommand{\id}{\mathrm{id}}\) \( \newcommand{\Span}{\mathrm{span}}\)
( \newcommand{\kernel}{\mathrm{null}\,}\) \( \newcommand{\range}{\mathrm{range}\,}\)
\( \newcommand{\RealPart}{\mathrm{Re}}\) \( \newcommand{\ImaginaryPart}{\mathrm{Im}}\)
\( \newcommand{\Argument}{\mathrm{Arg}}\) \( \newcommand{\norm}[1]{\| #1 \|}\)
\( \newcommand{\inner}[2]{\langle #1, #2 \rangle}\)
\( \newcommand{\Span}{\mathrm{span}}\)
\( \newcommand{\id}{\mathrm{id}}\)
\( \newcommand{\Span}{\mathrm{span}}\)
\( \newcommand{\kernel}{\mathrm{null}\,}\)
\( \newcommand{\range}{\mathrm{range}\,}\)
\( \newcommand{\RealPart}{\mathrm{Re}}\)
\( \newcommand{\ImaginaryPart}{\mathrm{Im}}\)
\( \newcommand{\Argument}{\mathrm{Arg}}\)
\( \newcommand{\norm}[1]{\| #1 \|}\)
\( \newcommand{\inner}[2]{\langle #1, #2 \rangle}\)
\( \newcommand{\Span}{\mathrm{span}}\) \( \newcommand{\AA}{\unicode[.8,0]{x212B}}\)
\( \newcommand{\vectorA}[1]{\vec{#1}} % arrow\)
\( \newcommand{\vectorAt}[1]{\vec{\text{#1}}} % arrow\)
\( \newcommand{\vectorB}[1]{\overset { \scriptstyle \rightharpoonup} {\mathbf{#1}} } \)
\( \newcommand{\vectorC}[1]{\textbf{#1}} \)
\( \newcommand{\vectorD}[1]{\overrightarrow{#1}} \)
\( \newcommand{\vectorDt}[1]{\overrightarrow{\text{#1}}} \)
\( \newcommand{\vectE}[1]{\overset{-\!-\!\rightharpoonup}{\vphantom{a}\smash{\mathbf {#1}}}} \)
\( \newcommand{\vecs}[1]{\overset { \scriptstyle \rightharpoonup} {\mathbf{#1}} } \)
\( \newcommand{\vecd}[1]{\overset{-\!-\!\rightharpoonup}{\vphantom{a}\smash {#1}}} \)
\(\newcommand{\avec}{\mathbf a}\) \(\newcommand{\bvec}{\mathbf b}\) \(\newcommand{\cvec}{\mathbf c}\) \(\newcommand{\dvec}{\mathbf d}\) \(\newcommand{\dtil}{\widetilde{\mathbf d}}\) \(\newcommand{\evec}{\mathbf e}\) \(\newcommand{\fvec}{\mathbf f}\) \(\newcommand{\nvec}{\mathbf n}\) \(\newcommand{\pvec}{\mathbf p}\) \(\newcommand{\qvec}{\mathbf q}\) \(\newcommand{\svec}{\mathbf s}\) \(\newcommand{\tvec}{\mathbf t}\) \(\newcommand{\uvec}{\mathbf u}\) \(\newcommand{\vvec}{\mathbf v}\) \(\newcommand{\wvec}{\mathbf w}\) \(\newcommand{\xvec}{\mathbf x}\) \(\newcommand{\yvec}{\mathbf y}\) \(\newcommand{\zvec}{\mathbf z}\) \(\newcommand{\rvec}{\mathbf r}\) \(\newcommand{\mvec}{\mathbf m}\) \(\newcommand{\zerovec}{\mathbf 0}\) \(\newcommand{\onevec}{\mathbf 1}\) \(\newcommand{\real}{\mathbb R}\) \(\newcommand{\twovec}[2]{\left[\begin{array}{r}#1 \\ #2 \end{array}\right]}\) \(\newcommand{\ctwovec}[2]{\left[\begin{array}{c}#1 \\ #2 \end{array}\right]}\) \(\newcommand{\threevec}[3]{\left[\begin{array}{r}#1 \\ #2 \\ #3 \end{array}\right]}\) \(\newcommand{\cthreevec}[3]{\left[\begin{array}{c}#1 \\ #2 \\ #3 \end{array}\right]}\) \(\newcommand{\fourvec}[4]{\left[\begin{array}{r}#1 \\ #2 \\ #3 \\ #4 \end{array}\right]}\) \(\newcommand{\cfourvec}[4]{\left[\begin{array}{c}#1 \\ #2 \\ #3 \\ #4 \end{array}\right]}\) \(\newcommand{\fivevec}[5]{\left[\begin{array}{r}#1 \\ #2 \\ #3 \\ #4 \\ #5 \\ \end{array}\right]}\) \(\newcommand{\cfivevec}[5]{\left[\begin{array}{c}#1 \\ #2 \\ #3 \\ #4 \\ #5 \\ \end{array}\right]}\) \(\newcommand{\mattwo}[4]{\left[\begin{array}{rr}#1 \amp #2 \\ #3 \amp #4 \\ \end{array}\right]}\) \(\newcommand{\laspan}[1]{\text{Span}\{#1\}}\) \(\newcommand{\bcal}{\cal B}\) \(\newcommand{\ccal}{\cal C}\) \(\newcommand{\scal}{\cal S}\) \(\newcommand{\wcal}{\cal W}\) \(\newcommand{\ecal}{\cal E}\) \(\newcommand{\coords}[2]{\left\{#1\right\}_{#2}}\) \(\newcommand{\gray}[1]{\color{gray}{#1}}\) \(\newcommand{\lgray}[1]{\color{lightgray}{#1}}\) \(\newcommand{\rank}{\operatorname{rank}}\) \(\newcommand{\row}{\text{Row}}\) \(\newcommand{\col}{\text{Col}}\) \(\renewcommand{\row}{\text{Row}}\) \(\newcommand{\nul}{\text{Nul}}\) \(\newcommand{\var}{\text{Var}}\) \(\newcommand{\corr}{\text{corr}}\) \(\newcommand{\len}[1]{\left|#1\right|}\) \(\newcommand{\bbar}{\overline{\bvec}}\) \(\newcommand{\bhat}{\widehat{\bvec}}\) \(\newcommand{\bperp}{\bvec^\perp}\) \(\newcommand{\xhat}{\widehat{\xvec}}\) \(\newcommand{\vhat}{\widehat{\vvec}}\) \(\newcommand{\uhat}{\widehat{\uvec}}\) \(\newcommand{\what}{\widehat{\wvec}}\) \(\newcommand{\Sighat}{\widehat{\Sigma}}\) \(\newcommand{\lt}{<}\) \(\newcommand{\gt}{>}\) \(\newcommand{\amp}{&}\) \(\definecolor{fillinmathshade}{gray}{0.9}\)Nuclear magnetic resonance spectroscopy (NMR) is a widely used and powerful method that takes advantage of the magnetic properties of certain nuclei. The basic principle behind NMR is that some nuclei exist in specific nuclear spin states when exposed to an external magnetic field. NMR observes transitions between these spin states that are specific to the particular nuclei in question, as well as that nuclei's chemical environment. However, this only applies to nuclei whose spin, I, is not equal to 0, so nuclei where I = 0 are ‘invisible’ to NMR spectroscopy. These properties have led to NMR being used to identify molecular structures, monitor reactions, study metabolism in cells, and is used in medicine, biochemistry, physics, industry, and almost every imaginable branch of science.
Theory
The chemical theory that underlies NMR spectroscopy depends on the intrinsic spin of the nucleus involved, described by the quantum number S. Nuclei with a non-zero spin are always associated with a non-zero magnetic moment, as described by Equation \ref{1}, where μ is the magnetic moment, \(S\) is the spin, and γ is always non-zero. It is this magnetic moment that allows for NMR to be used; therefore nuclei whose quantum spin is zero cannot be measured using NMR. Almost all isotopes that have both an even number of protons and neutrons have no magnetic moment, and cannot be measured using NMR.
\[ \mu =\ \gamma \cdot S \label{1} \]
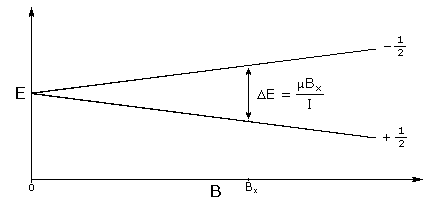
In the presence of an external magnetic field (B) for a nuclei with a spin I = 1/2, there are two spin states present of +1/2 and -1/2. The difference in energy between these two states at a specific external magnetic field (Bx) are given by Equation \ref{2}, and are shown in Figure \(\PageIndex{1}\) where E is energy, I is the spin of the nuclei, and μ is the magnetic moment of the specific nuclei being analyzed. The difference in energy shown is always extremely small, so for NMR strong magnetic fields are required to further separate the two energy states. At the applied magnetic fields used for NMR, most magnetic resonance frequencies tend to fall in the radio frequency range.
\[ E\ =\ \mu \cdot B_{x} / I \label{2} \]
The reason NMR can differentiate between different elements and isotopes is due to the fact that each specific nuclide will only absorb at a very specific frequency. This specificity means that NMR can generally detect one isotope at a time, and this results in different types of NMR: such as 1H NMR, 13C NMR, and 31P NMR, to name only a few.
The subsequent absorbed frequency of any type of nuclei is not always constant, since electrons surrounding a nucleus can result in an effect called nuclear shielding, where the magnetic field at the nucleus is changed (usually lowered) because of the surrounding electron environment. This differentiation of a particular nucleus based upon its electronic (chemical) environment allows NMR be used to identify structure. Since nuclei of the same type in different electron environments will be more or less shielded than another, the difference in their environment (as observed by a difference in the surrounding magnetic field) is defined as the chemical shift.
Instrumentation
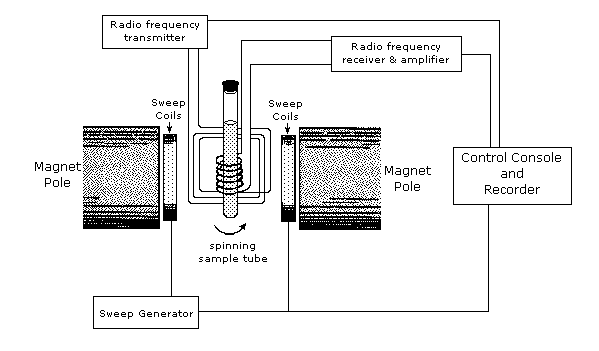
An example of an NMR spectrometer is given in Figure \(\PageIndex{2}\). NMR spectroscopy works by varying the machine’s emitted frequency over a small range while the sample is inside a constant magnetic field. Most of the magnets used in NMR machines to create the magnetic field range from 6 to 24 T. The sample is placed within the magnet and surrounded by superconducting coils, and is then subjected to a frequency from the radio wave source. A detector then interprets the results and sends it to the main console.
Interpreting NMR spectra
Chemical Shift
The different local chemical environments surrounding any particular nuclei causes them to resonate at slightly different frequencies. This is a result of a nucleus being more or less shielded than another. This is called the chemical shift (δ). One factor that affects chemical shift is the changing of electron density from around a nucleus, such as a bond to an electronegative group. Hydrogen bonding also changes the electron density in 1H NMR, causing a larger shift. These frequency shifts are miniscule in comparison to the fundamental NMR frequency differences, on a scale of Hz as compared to MHz. For this reason chemical shifts (δ) are described by the unit ppm on an NMR spectra, \ref{3}, where Href = the resonance frequency of the reference, Hsub = resonance frequency of the substance, and Hmachine = operating frequency of the spectrometer.
\[ \delta \ =\ (\frac{H_{ref}-H_{sub}}{H_{machine}})\ \times 10^{6} \label{3} \]
Since the chemical shift (δ in ppm) is reported as a relative difference from some reference frequency, so a reference is required. In 1H and 13C NMR, for example, tetramethylsilane (TMS, Si(CH3)4) is used as the reference. Chemical shifts can be used to identify structural properties in a molecule based on our understanding of different chemical environments. Some examples of where different chemical environments fall on a 1H NMR spectra are given in Table \(\PageIndex{1}\).
| Functional Group | Chemical Shift Range (ppm) |
|---|---|
| Alkyl (e.g. methyl-CH3) | ~ 1 |
| Alkyl adjacent to oxygen (-CH2-O) | 3 - 4 |
| Alkene (=CH2) | ~ 6 |
| Alkyne (C-H) | ~ 3 |
| Aromatic | 7 - 8 |
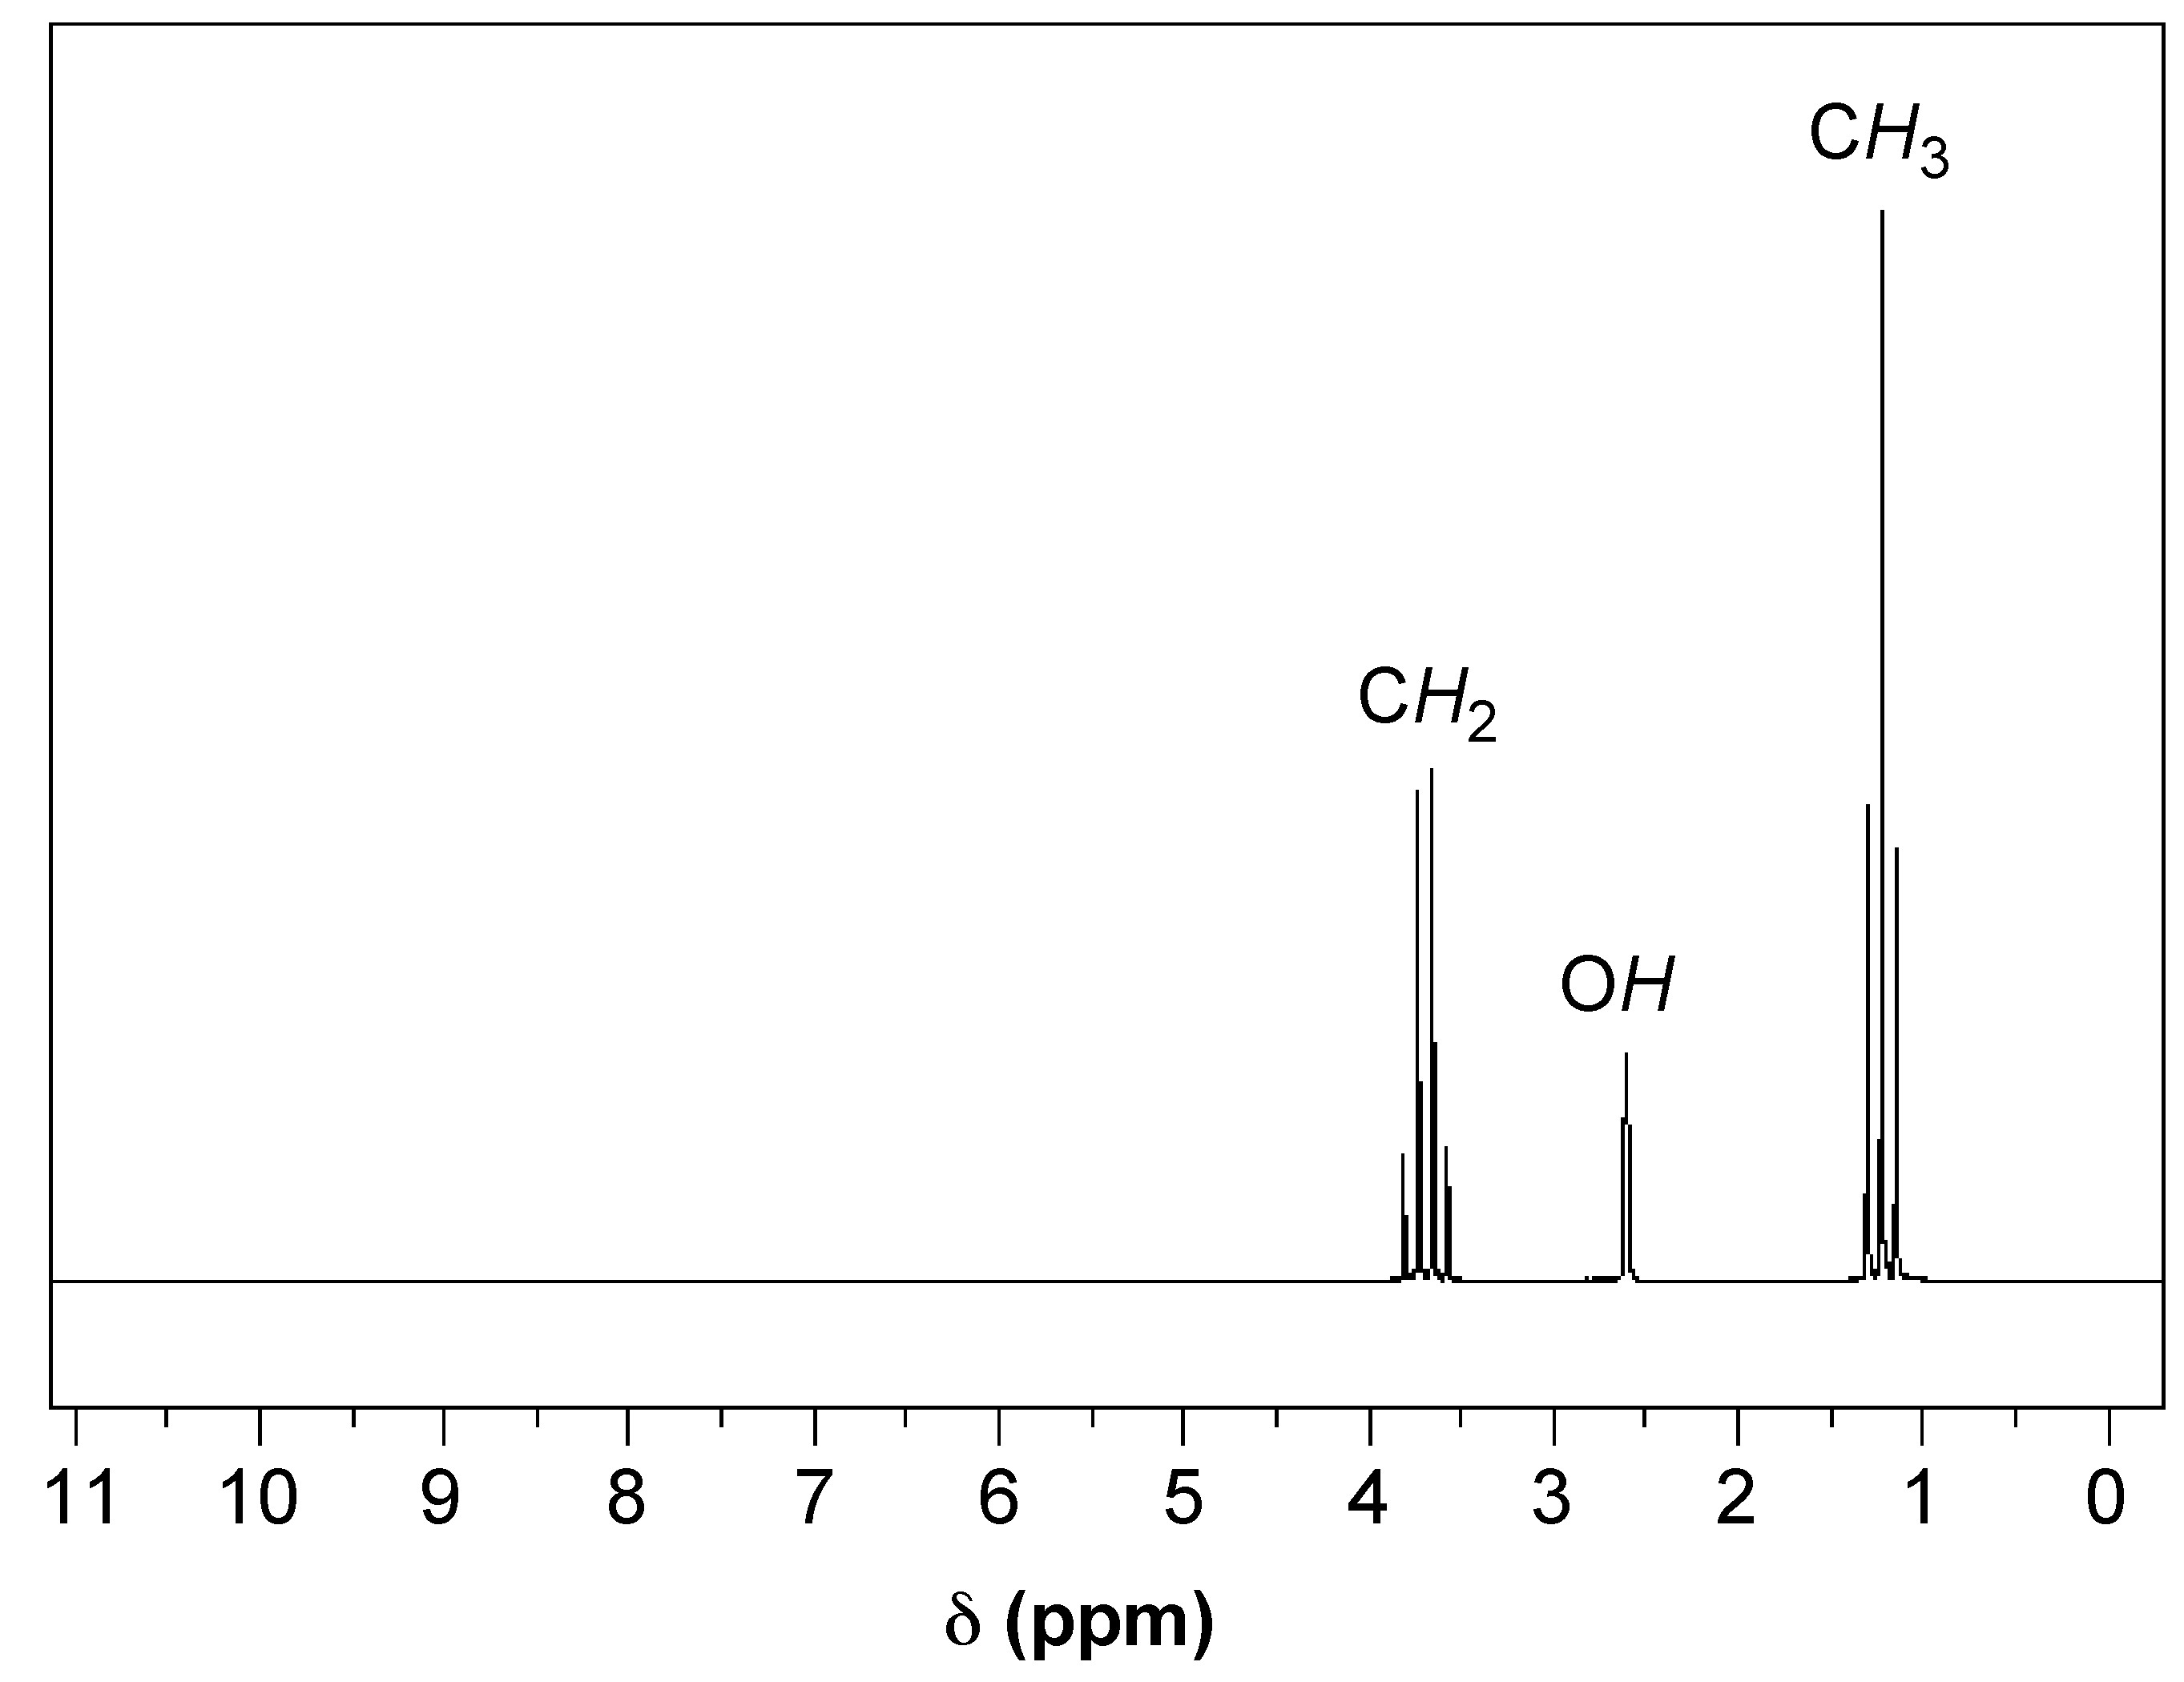
In Figure \(\PageIndex{3}\), an 1H NMR spectra of ethanol, we can see a clear example of chemical shift. There are three sets of peaks that represent the six hydrogens of ethanol (C2H6O). The presence of three sets of peaks means that there are three different chemical environments that the hydrogens can be found in: the terminal methyl (CH3) carbon’s three hydrogens, the two hydrogens on the methylene (CH2) carbon adjacent to the oxygen, and the single hydrogen on the oxygen of the alcohol group (OH). Once we cover spin-spin coupling, we will have the tools available to match these groups of hydrogens to their respective peaks.
Spin-spin Coupling
Another useful property that allows NMR spectra to give structural information is called spin-spin coupling, which is caused by spin coupling between NMR active nuclei that are not chemically identical. Different spin states interact through chemical bonds in a molecule to give rise to this coupling, which occurs when a nuclei being examined is disturbed or influenced by a nearby nuclear spin. In NMR spectra, this effect is shown through peak splitting that can give direct information concerning the connectivity of atoms in a molecule. Nuclei which share the same chemical shift do not form splitting peaks in an NMR spectra.
In general, neighboring NMR active nuclei three or fewer bonds away lead to this splitting. The splitting is described by the relationship where n neighboring nuclei result in n+1 peaks, and the area distribution can be seen in Pascal’s triangle (Figure \(\PageIndex{4}\)). However, being adjacent to a strongly electronegative group such as oxygen can prevent spin-spin coupling. For example a doublet would have two peaks with intensity ratios of 1:1, while a quartet would have four peaks of relative intensities 1:3:3:1. The magnitude of the observed spin splitting depends on many factors and is given by the coupling constant J, which is in units of Hz.

Referring again to Figure \(\PageIndex{4}\), we have a good example of how spin-spin coupling manifests itself in an NMR spectra. In the spectra we have three sets of peaks: a quartet, triplet, and a singlet. If we start with the terminal carbon’s hydrogens in ethanol, using the n+1 rule we see that they have two hydrogens within three bonds (i.e., H-C-C-H), leading us to identify the triplet as the peaks for the terminal carbon’s hydrogens. Looking next at the two central hydrogens, they have four NMR active nuclei within three bonds (i.e., H-C-C-H), but there is no quintet on the spectra as might be expected. This can be explained by the fact that the single hydrogen bonded to the oxygen is shielded from spin-spin coupling, so it must be a singlet and the two central hydrogens form the quartet. We have now interpreted the NMR spectra of ethanol by identifying which nuclei correspond to each peak.
Peak Intensity
Mainly useful for proton NMR, the size of the peaks in the NMR spectra can give information concerning the number of nuclei that gave rise to that peak. This is done by measuring the peak’s area using integration. Yet even without using integration the size of different peaks can still give relative information about the number of nuclei. For example a singlet associated with three hydrogen atoms would be about 3 times larger than a singlet associated with a single hydrogen atom.
This can also be seen in the example in Figure \(\PageIndex{3}\). If we integrated the area under each peak, we would find that the ratios of the areas of the quartet, singlet, and triplet are approximately 2:1:3, respectively.
Limitations of NMR
Despite all of its upsides, there are several limitations that can make NMR analysis difficult or impossible in certain situations. One such issue is that the desired isotope of an element that is needed for NMR analysis may have little or no natural abundance. For example the natural abundance of 13C, the active isotope for carbon NMR, is about 11%, which works well for analysis. However, in the case of oxygen the active isotope for NMR is 17O, which is only 0.035% naturally abundant. This means that there are certain elements that can essentially never be measured through NMR.
Another problem is that some elements have an extremely low magnetic moment, μ. The sensitivity of NMR machines is based on the magnetic moment of the specific element, but if the magnetic moment is too low it can be very difficult to obtain an NMR spectra with enough peak intensity to properly analyze.
NMR Properties of the Element
| Isotope | Natural Abundance (%) | Relative NMR Frequency (MHz) | Relative Receptivity as Compared to 1H |
|---|---|---|---|
| 1H | 99.985 | 100 | 1.00 |
| 3H | - | 106.7 | - |
| 3He | 0.00013 | 76.2 | 5.8 x 10⁻⁷ |
| 13C | 1.11 | 25.1 | 1.8 x 10⁻⁴ |
| 15N | 0.37 | 10.1 | 3.9 x 10⁻⁶ |
| 19F | 100 | 94.1 | 8.3 x 10⁻¹ |
| 29Si | 4.7 | 19.9 | 3.7 x 10⁻⁴ |
| 31P | 100 | 40.5 | 6.6 x 10⁻² |
| 57Fe | 2.2 | 3.2 | 7.4 x 10⁻⁷ |
| 77Se | 7.6 | 19.1 | 5.3 x 10⁻⁴ |
| 89Y | 100 | 4.9 | 1.2 x 10⁻⁴ |
| 103Rh | 100 | 3.2 | 3.2 x 10⁻⁵ |
| 107Ag | 51.8 | 4.0 | 3.5 x 10⁻⁵ |
| 109Ag | 48.2 | 4.7 | 4.9 x 10⁻⁵ |
| 111Cd | 12.8 | 21.2 | 1.2 x 10⁻³ |
| 113Cd | 12.3 | 22.2 | 1.3 x 10⁻³ |
| 117Sna | 7.6 | 35.6 | 3.5 x 10⁻³ |
| 119Sn | 8.6 | 37.3 | 4.5 x 10⁻³ |
| 125Tea | 7.0 | 31.5 | 2.2 x 10⁻³ |
| 129Xe | 26.4 | 27.8 | 5.7 x 10⁻³ |
| 169Tm | 100 | 8.3 | 5.7 x 10⁻⁴ |
| 171Yb | 14.3 | 17.6 | 7.8 x 10⁻⁴ |
| 183W | 14.4 | 4.2 | 1.1 x 10⁻⁵ |
| 187Os | 1.6 | 2.3 | 2.0 x 10⁻⁷ |
| 195Pt | 33.8 | 21.4 | 3.4 x 10⁻³ |
| 199Hg | 16.8 | 17.9 | 9.8 x 10⁻⁴ |
| 203Ti | 29.5 | 57.1 | 5.7 x 10⁻² |
| 205Ti | 70.5 | 57.6 | 1.4 x 10⁻¹ |
| 207Pb | 22.6 | 20.9 | 2.0 x 10⁻¹ |
| Isotope | Spin | Natural Abundance (%) | Relative NMR Frequency (%) | Relative Receptivity as Compared to 1H | Quadropole moment (10-28 m2) |
|---|---|---|---|---|---|
| 2H | 1 | 0.015 | 15.4 | 1.5 x 10⁻⁶ | 2.8 x 10⁻³ |
| 6Li | 1 | 7.4 | 14.7 | 6.3 x 10⁻⁴ | -8 x 10⁻⁴ |
| 7Li | 3/2 | 92.6 | 38.9 | 2.7 x 10⁻¹ | -4 x 10⁻² |
| 9Be | 3/2 | 100 | 14.1 | 1.4 x 10⁻² | 5 x 10⁻² |
| 10B | 3 | 19.6 | 10.7 | 3.9 x 10⁻³ | 8.5 x 10⁻² |
| 11B | 3/2 | 80.4 | 32.1 | 1.3 x 10⁻¹ | 4.1 x 10⁻² |
| 14Na | 1 | 99.6 | 7.2 | 1.0 x 10⁻³ | 1 x 10⁻² |
| 17O | 5/2 | 0.037 | 13.6 | 1.1 x 10⁻⁵ | -2.6 x 10⁻² |
| 23Na | 5/2 | 100 | 26.5 | 9.3 x 10⁻² | 1 x 10⁻¹ |
| 25Mg | 5/2 | 10.1 | 6.1 | 2.7 x 10⁻⁴ | 2.2 x 10⁻¹ |
| 27Al | 5/2 | 100 | 26.1 | 2.1 x 10⁻¹ | 1.5 x 10⁻¹ |
| 33S | 3/2 | 0.76 | 7.7 | 1.7 x 10⁻⁵ | -5.5 x 10⁻² |
| 35Cl | 3/2 | 75.5 | 9.8 | 3.6 x 10⁻³ | -1 x 10⁻¹ |
| 37Cl | 3/2 | 24.5 | 8.2 | 6.7 x 10⁻⁴ | -7.9 x 10⁻² |
| 39Kb | 3/2 | 93.1 | 4.7 | 4.8 x 10⁻⁴ | 4.9 x 10⁻² |
| 43Ca | 7/2 | 0.15 | 6.7 | 8.7 x 10⁻⁶ | 2 x 10⁻¹ |
| 45Sc | 7/2 | 100 | 24.3 | 3 x 10⁻¹ | -2.2 x 10⁻¹ |
| 47Ti | 5/2 | 7.3 | 5.6 | 1.5 x 10⁻⁴ | 2.9 x 10⁻¹ |
| 49Ti | 7/2 | 5.5 | 5.6 | 2.1 x 10⁻⁴ | 2.4 x 10⁻¹ |
| 51Vb | 7/2 | 99.8 | 26.3 | 3.8 x 10⁻¹ | -5 x 10⁻² |
| 53Cr | 3/2 | 9.6 | 5.7 | 8.6 x 10⁻⁵ | 3 x 10⁻² |
| 55Mn | 5/2 | 100 | 24.7 | 1.8 x 10⁻¹ | 4 x 10⁻¹ |
| 59Co | 7/2 | 100 | 23.6 | 2.8 x 10⁻¹ | 3.8 x 10⁻¹ |
| 61Ni | 3/2 | 1.2 | 8.9 | 4.1 x 10⁻¹ | 1.6 x 10⁻¹ |
| 63Cu | 3/2 | 69.1 | 26.5 | 6.5 x 10⁻² | -2.1 x 10⁻¹ |
| 65Cu | 3/2 | 30.9 | 28.4 | 3.6 x 10⁻² | -2.0 x 10⁻¹ |
| 67Zn | 5/2 | 4.1 | 6.3 | 1.2 x 10⁻⁴ | 1.6 x 10⁻¹ |
| 69Ga | 3/2 | 60.4 | 24.0 | 4.2 x 10⁻² | 1.9 x 10⁻¹ |
| 71Ga | 3/2 | 39.6 | 30.6 | 5.7 x 10⁻² | 1.2 x 10⁻¹ |
| 73Ge | 9/2 | 7.8 | 3.5 | 1.1 x 10⁻⁴ | -1.8 x 10⁻¹ |
| 75As | 3/2 | 100 | 17.2 | 2.5 x 10⁻² | 2.9 x 10⁻¹ |
| 79Br | 3/2 | 50.5 | 25.1 | 4.0 x 10⁻² | 3.7 x 10⁻¹ |
| 81Br | 3/2 | 49.5 | 27.1 | 4.9 x 10⁻² | 3.1 x 10⁻¹ |
| 87Rbb | 3/2 | 27.9 | 32.8 | 4.9 x 10⁻² | 1.3 x 10⁻¹ |
| 87Sr | 9/2 | 7.0 | 4.3 | 1.9 x 10⁻⁴ | 3 x 10⁻¹ |
| 91Zr | 5/2 | 11.2 | 9.3 | 1.1 x 10⁻³ | -2.1 x 10⁻¹ |
| 93Nb | 9/2 | 100 | 24.5 | 4.9 x 10⁻¹ | -2.2 x 10⁻¹ |
| 95Mo | 5/2 | 15.7 | 6.5 | 5.1 x 10⁻⁴ | ±1.2 x 10⁻¹ |
| 97Mo | 5/2 | 9.5 | 6.7 | 3.3 x 10⁻⁴ | ±1.1 |
| 99Ru | 5/2 | 12.7 | 4.6 | 1.5 x 10⁻⁴ | 7.6 x 10⁻² |
| 101Ru | 5/2 | 17.1 | 5.2 | 2.8 x 10⁻⁴ | 4.4 x 10⁻¹ |
| 105Pd | 5/2 | 22.2 | 4.6 | 2.5 x 10⁻⁴ | 8 x 10⁻¹ |
| 115Inb | 9/2 | 95.7 | 22.0 | 3.4 x 10⁻¹ | 8.3 x 10⁻¹ |
| 121Sb | 5/2 | 57.3 | 24.0 | 9.3 x 10⁻² | -2.8 x 10⁻¹ |
| 123Sb | 7/2 | 42.7 | 13.0 | 2.0 x 10⁻² | 3.6 x 10⁻¹ |
| 127I | 5/2 | 100 | 20.1 | 9.5 x 10⁻² | -7.9 x 10⁻¹ |
| 131Xea | 3/2 | 21.3 | 8.2 | 5.9 x 10⁻⁴ | -1.2 x 10⁻¹ |
| 133Cs | 7/2 | 100 | 13.2 | 4.8 x 10⁻² | -3 x 10⁻³ |
| 137Bab | 3/2 | 11.3 | 11.1 | 7.9 x 10⁻⁴ | 2.8 x 10⁻¹ |
| 139La | 7/2 | 99.9 | 14.2 | 6.0 x 10⁻² | 2.2 x 10⁻¹ |
| 177Hf | 7/2 | 18.5 | 4.0 | 2.6 x 10⁻⁴ | 4.5 |
| 179Hf | 9/2 | 13.8 | 2.5 | 7.4 x 10⁻⁵ | 5.1 |
| 181Ta | 7/2 | 99.99 | 12.0 | 3.7 x 10⁻² | 3 |
| 185Re | 5/2 | 37.1 | 22.7 | 5.1 x 10⁻² | 2.3 |
| 187Re | 5/2 | 62.9 | 22.9 | 8.8 x 10⁻² | 2.2 |
| 189Osa | 3/2 | 16.1 | 7.8 | 3.9 x 10⁻⁴ | 8 x 10⁻¹ |
| 191Ir | 3/2 | 37.3 | 1.7 | 9.8 x 10⁻⁶ | 1.1 |
| 193Ir | 3/2 | 62.7 | 1.9 | 2.1 x 10⁻⁵ | 1.0 |
| 197Au | 3/2 | 100 | 1.7 | 2.6 x 10⁻⁵ | 5.9 x 10⁻¹ |
| 201Hg | 3/2 | 13.2 | 6.6 | 1.9 x 10⁻⁴ | 4.4 x 10⁻¹ |
| 209Bi | 9/2 | 100 | 16.2 | 1.4 x 10⁻¹ | -3.8 x 10⁻¹ |
NMR Spin Coupling
The Basis of Spin Coupling
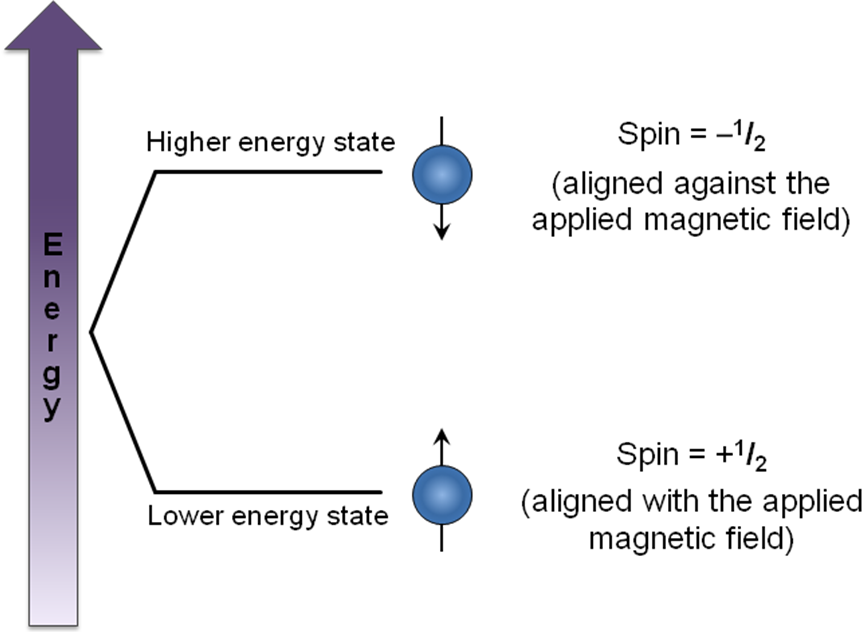
Nuclear magnetic resonance (NMR) signals arise when nuclei absorb a certain radio frequency and are excited from one spin state to another. The exact frequency of electromagnetic radiation that the nucleus absorbs depends on the magnetic environment around the nucleus. This magnetic environment is controlled mostly by the applied field, but is also affected by the magnetic moments of nearby nuclei. Nuclei can be in one of many spin states Figure \(\PageIndex{5}\), giving rise to several possible magnetic environments for the observed nucleus to resonate in. This causes the NMR signal for a nucleus to show up as a multiplet rather than a single peak.
When nuclei have a spin of I = 1/2 (as with protons), they can have two possible magnetic moments and thus split a single expected NMR signal into two signals. When more than one nucleus affects the magnetic environment of the nucleus being examined, complex multiplets form as each nucleus splits the signal into two additional peaks. If those nuclei are magnetically equivalent to each other, then some of the signals overlap to form peaks with different relative intensities. The multiplet pattern can be predicted by Pascal’s triangle (Figure \(\PageIndex{6}\)), looking at the nth row, where n = number of nuclei equivalent to each other but not equivalent to the one being examined. In this case, the number of peaks in the multiplet is equal to n + 1

When there is more than one type of nucleus splitting an NMR signal, then the signal changes from a multiplet to a group of multiplets (Figure \(\PageIndex{7}\)). This is caused by the different coupling constants associated with different types of nuclei. Each nucleus splits the NMR signal by a different width, so the peaks no longer overlap to form peaks with different relative intensities.

When nuclei have I > 1/2, they have more than two possible magnetic moments and thus split NMR signals into more than two peaks. The number of peaks expected is 2I + 1, corresponding to the number of possible orientations of the magnetic moment. In reality however, some of these peaks may be obscured due to quadrupolar relaxation. As a result, most NMR focuses on I = 1/2 nuclei such as 1H, 13C, and 31P.
Multiplets are centered around the chemical shift expected for a nucleus had its signal not been split. The total area of a multiplet corresponds to the number of nuclei resonating at the given frequency.
Spin Coupling in molecules
Looking at actual molecules raises questions about which nuclei can cause splitting to occur. First of all, it is important to realize that only nuclei with I ≠ 0 will show up in an NMR spectrum. When I = 0, there is only one possible spin state and obviously the nucleus cannot flip between states. Since the NMR signal is based on the absorption of radio frequency as a nucleus transitions from one spin state to another, I = 0 nuclei do not show up on NMR. In addition, they do not cause splitting of other NMR signals because they only have one possible magnetic moment. This simplifies NMR spectra, in particular of organic and organometallic compounds, greatly, since the majority of carbon atoms are 12C, which have I = 0.
For a nucleus to cause splitting, it must be close enough to the nucleus being observed to affect its magnetic environment. The splitting technically occurs through bonds, not through space, so as a general rule, only nuclei separated by three or fewer bonds can split each other. However, even if a nucleus is close enough to another, it may not cause splitting. For splitting to occur, the nuclei must also be non-equivalent. To see how these factors affect real NMR spectra, consider the spectrum for chloroethane (Figure \(\PageIndex{8}\)).
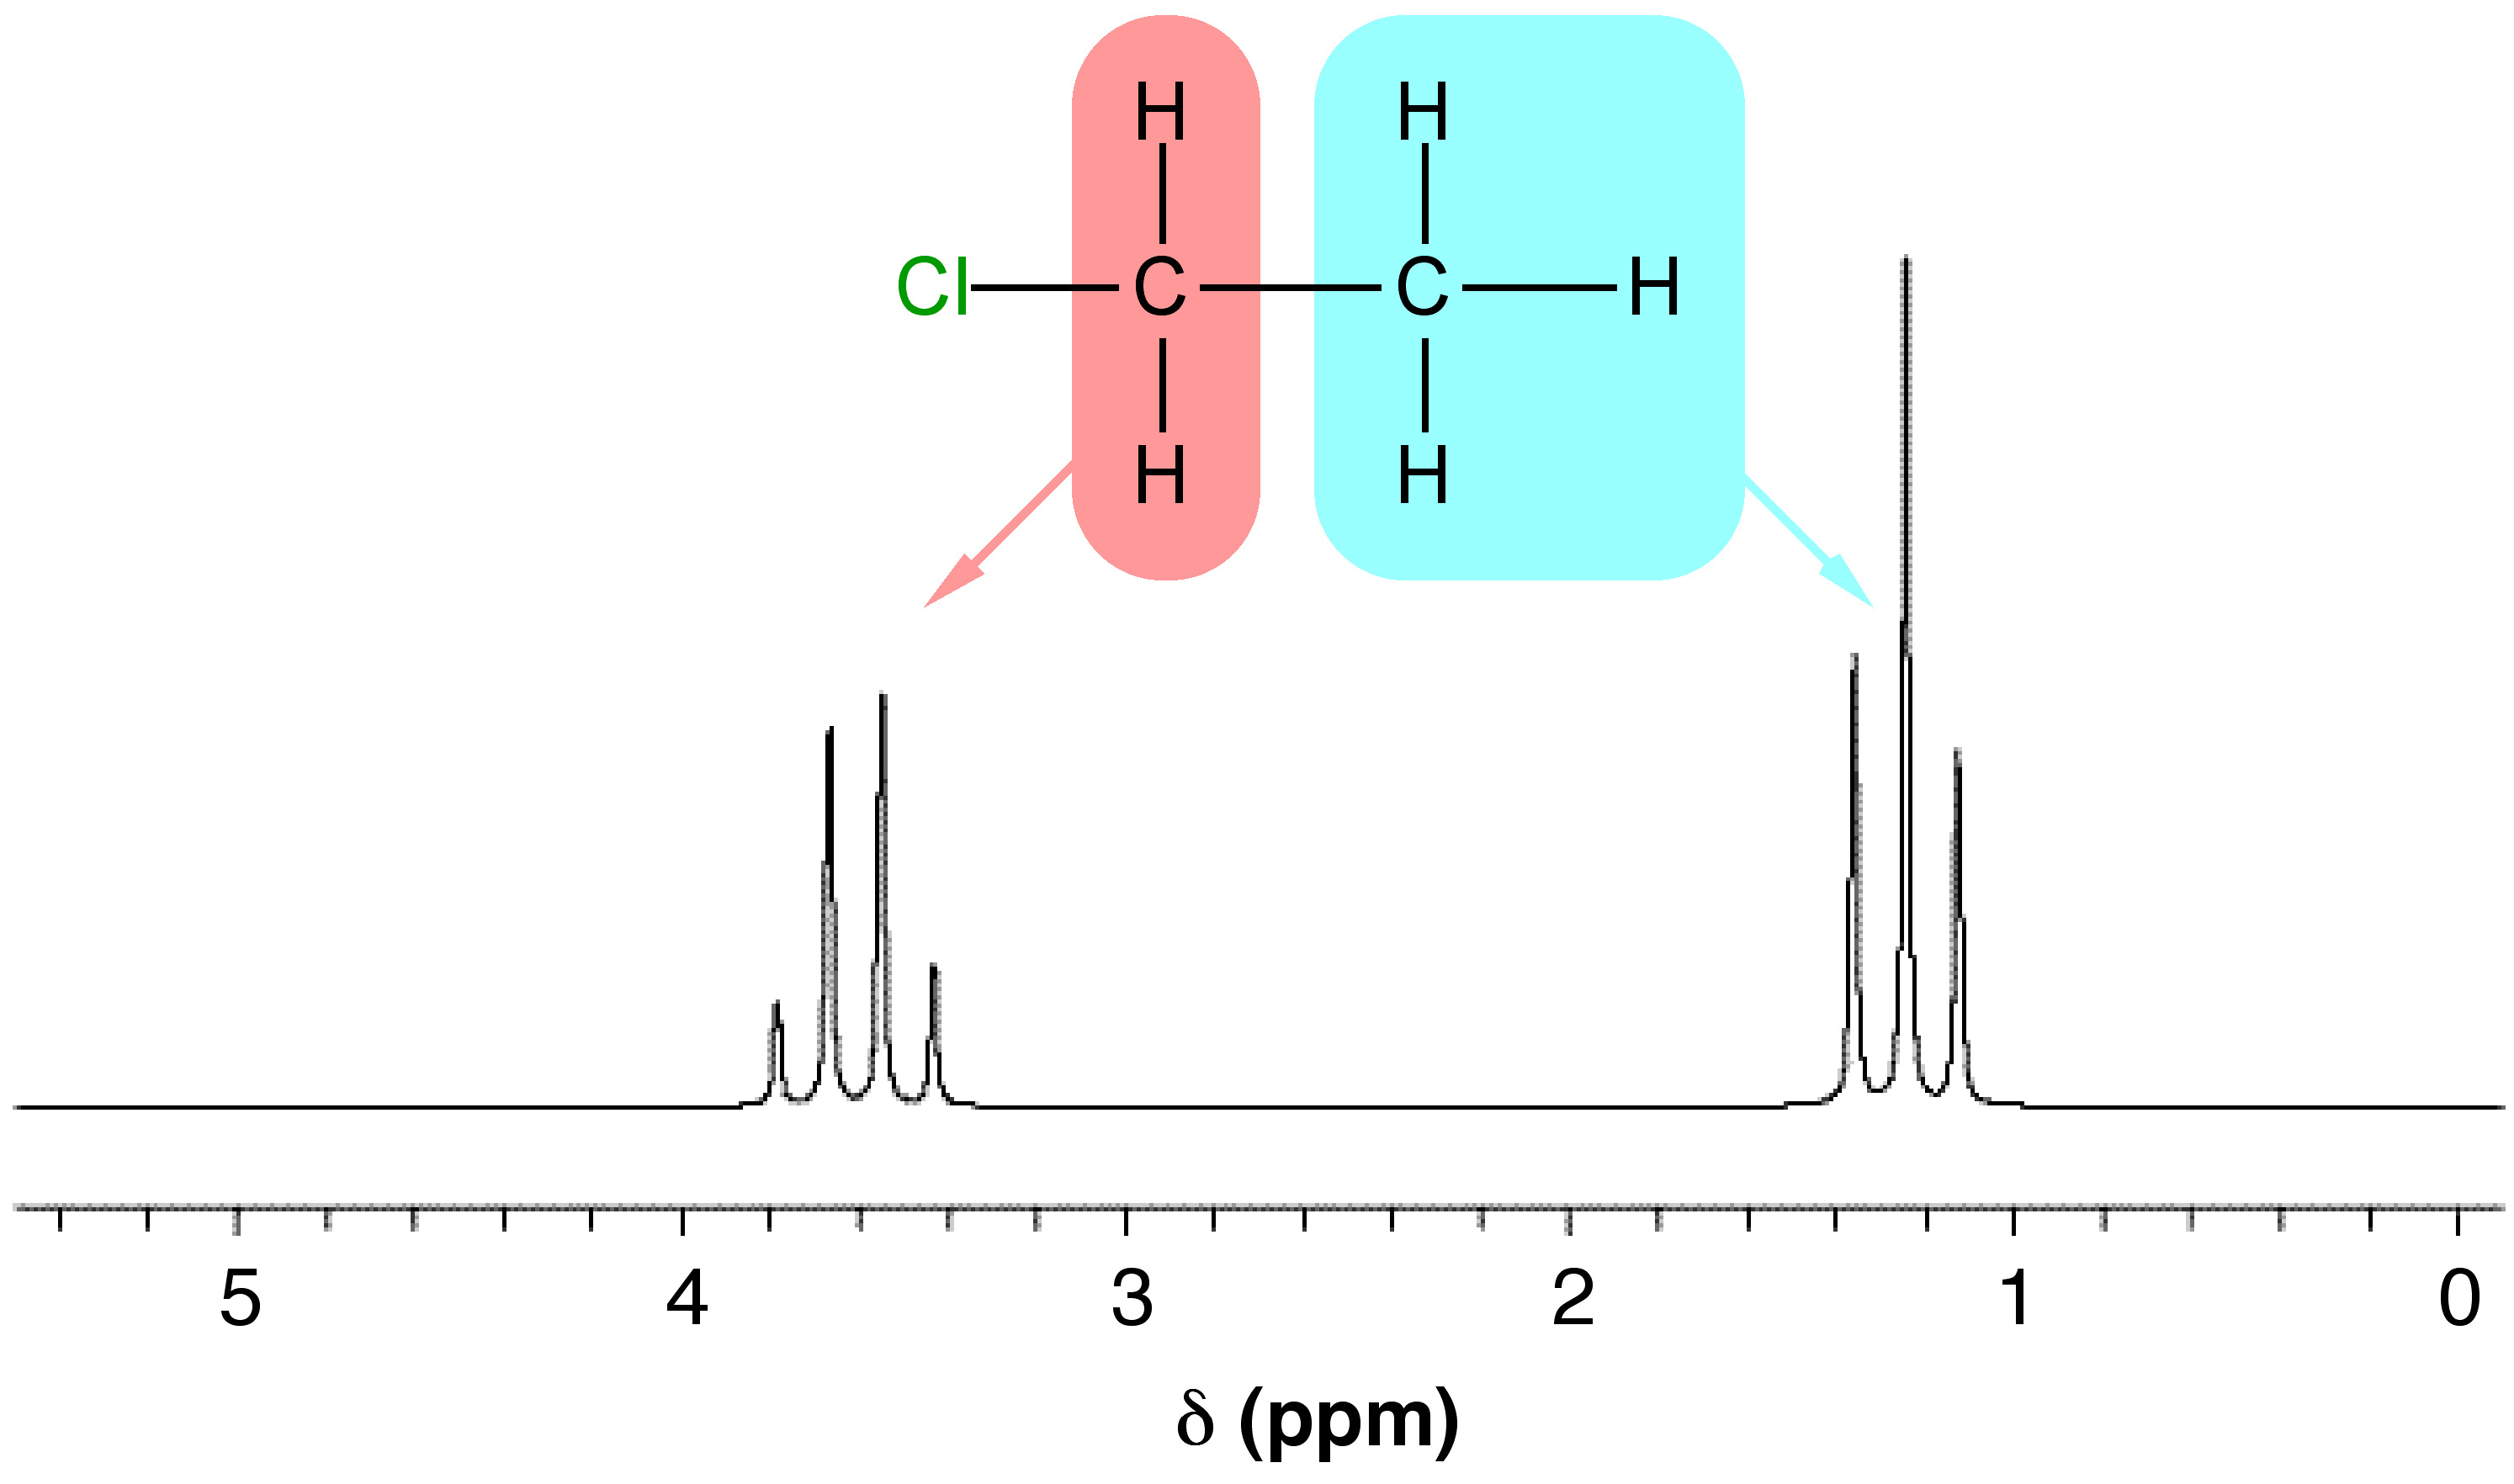
Notice that in Figure \(\PageIndex{8}\) there are two groups of peaks in the spectrum for chloroethane, a triplet and a quartet. These arise from the two different types of I ≠ 0 nuclei in the molecule, the protons on the methyl and methylene groups. The multiplet corresponding to the CH3 protons has a relative integration (peak area) of three (one for each proton) and is split by the two methylene protons (n = 2), which results in n + 1 peaks, i.e., 3 which is a triplet. The multiplet corresponding to the CH2 protons has an integration of two (one for each proton) and is split by the three methyl protons ((n = 3) which results in n + 1 peaks, i.e., 4 which is a quartet. Each group of nuclei splits the other, so in this way, they are coupled.
Coupling Constants
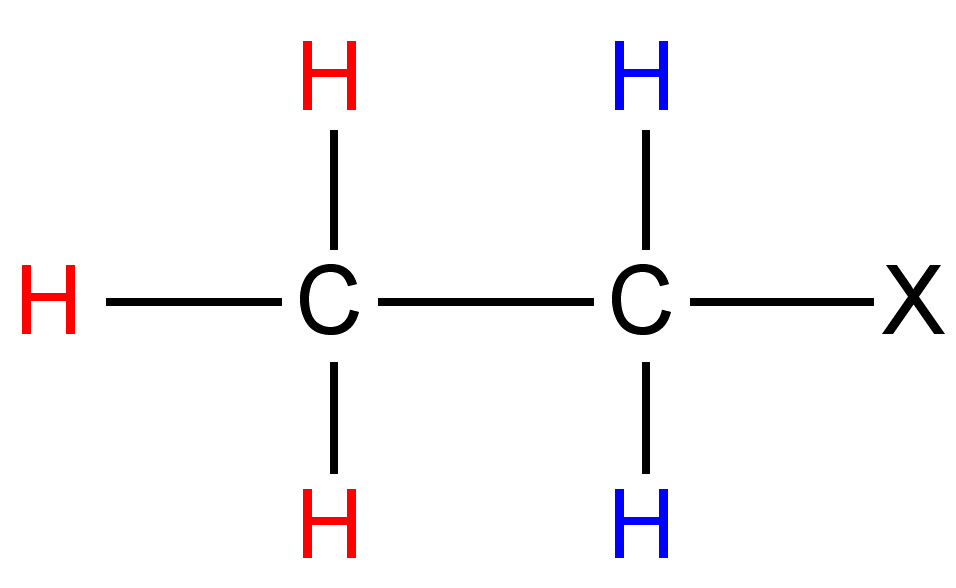
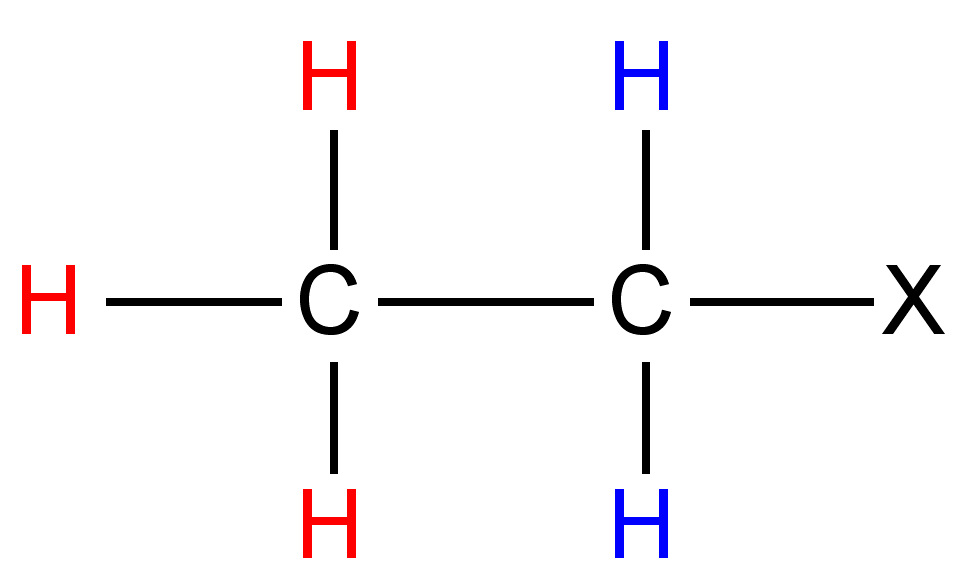
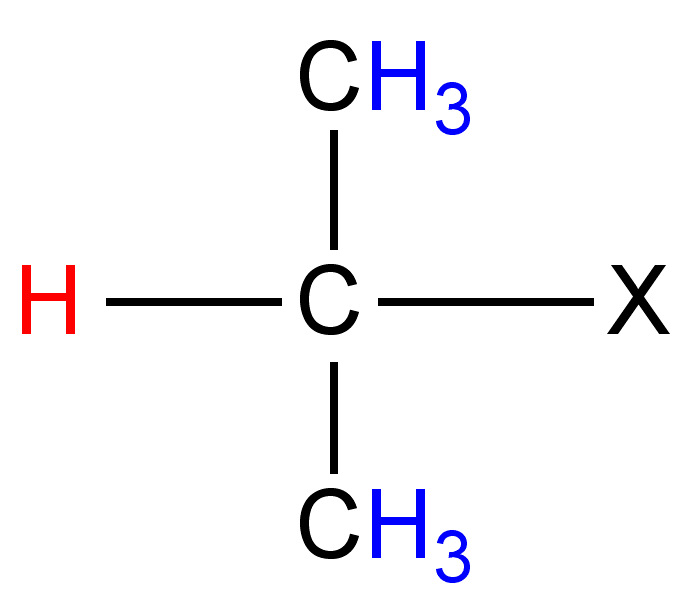
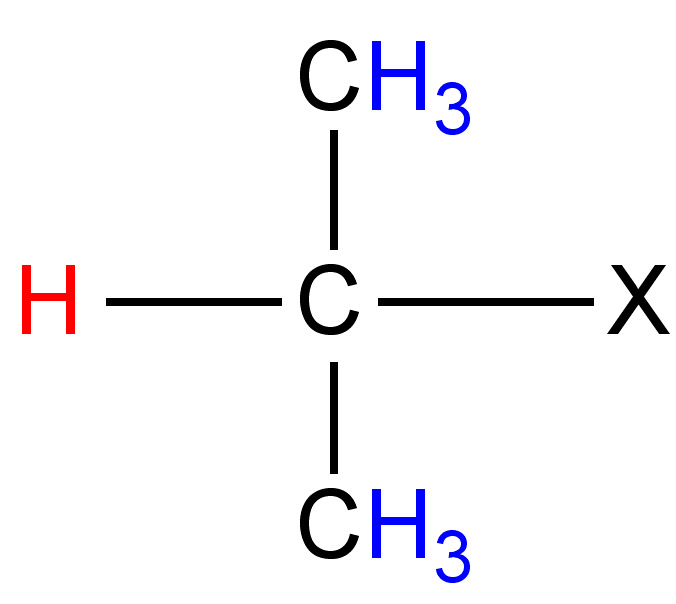
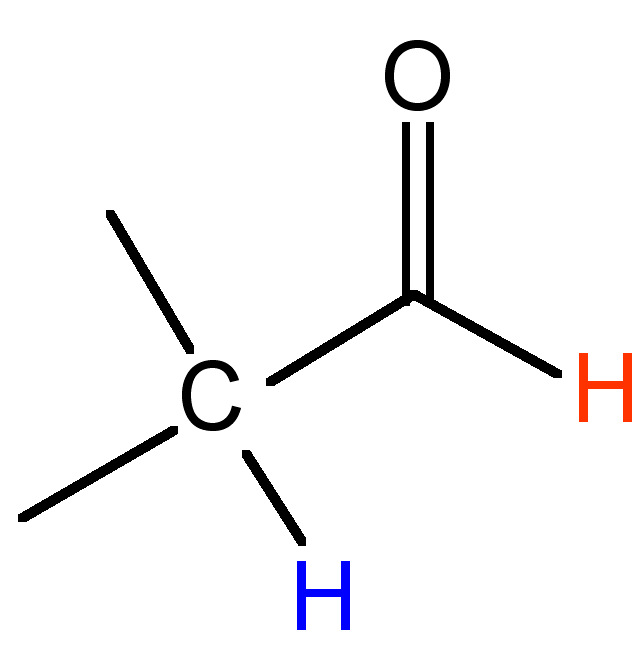
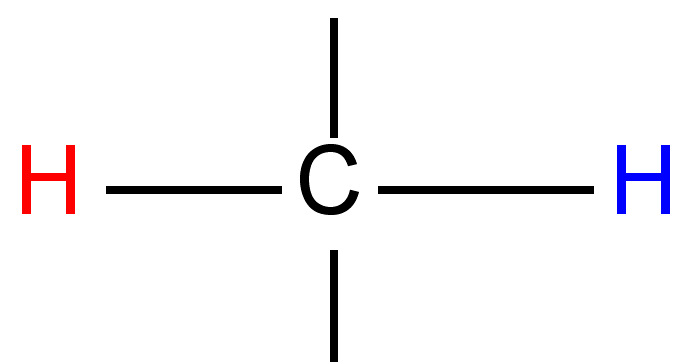
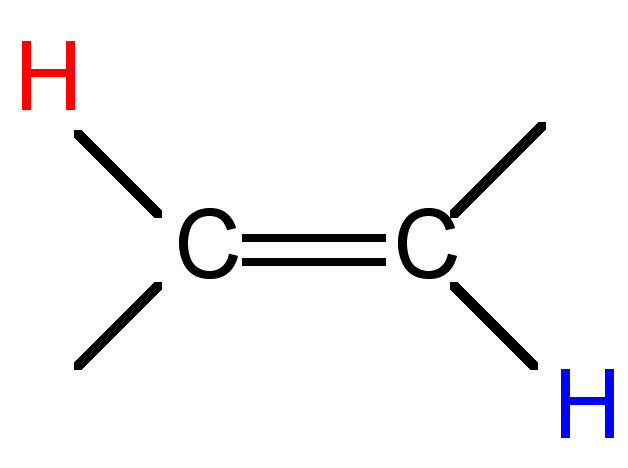
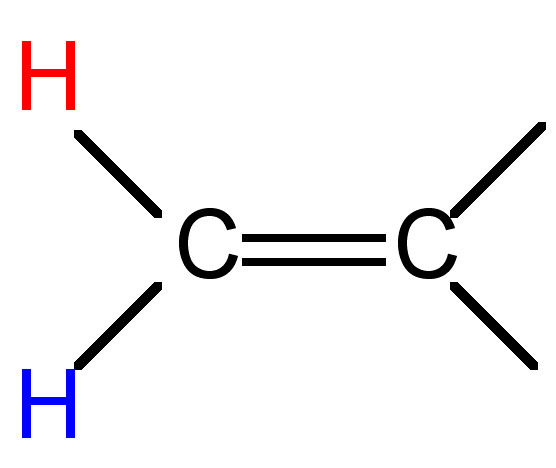
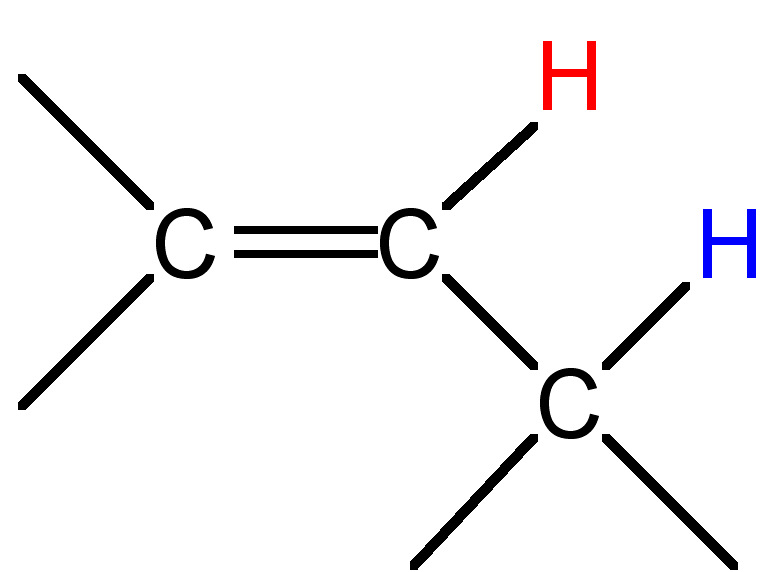
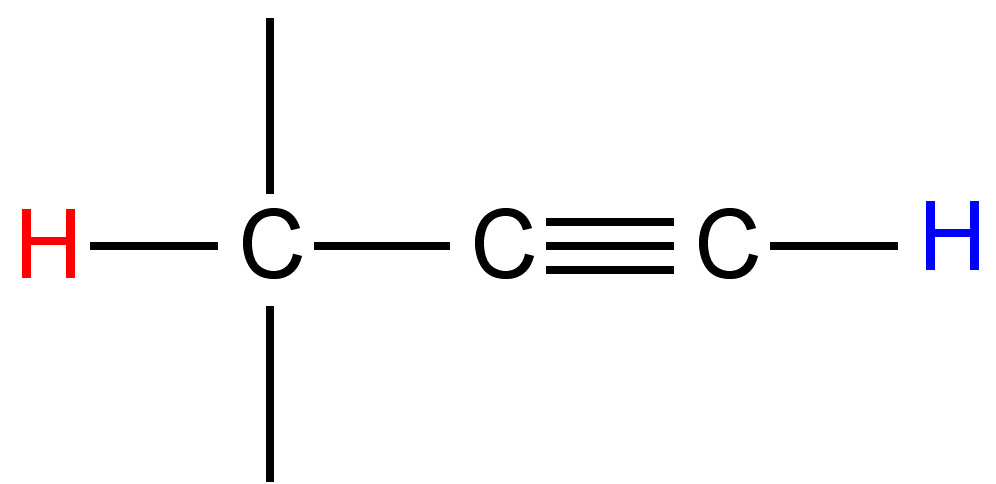
The difference (in Hz) between the peaks of a mulitplet is called the coupling constant. It is particular to the types of nuclei that give rise to the multiplet, and is independent of the field strength of the NMR instrument used. For this reason, the coupling constant is given in Hz, not ppm. The coupling constant for many common pairs of nuclei are known (Table \(\PageIndex{3}\)), and this can help when interpreting spectra.
| Structural Type | |
|---|---|
 |
 |
 |
 |
 |
 |
 |
0.5 - 3 |
 |
12 - 15 |
 |
12 - 18 |
 |
7 - 12 |
 |
0.5 - 3 |
 |
3 - 11 |
 |
2 - 3 |
 |
ortho = 6 - 9; meta = 1 - 3; para = 0 - 1 |
Coupling constants are sometimes written nJ to denote the number of bonds (n) between the coupled nuclei. Alternatively, they are written as J(H-H) or JHH to indicate the coupling is between two hydrogen atoms. Thus, a coupling constant between a phosphorous atom and a hydrogen would be written as J(P-H) or JPH. Coupling constants are calculated empirically by measuring the distance between the peaks of a multiplet, and are expressed in Hz.
Coupling constants may be calculated from spectra using frequency or chemical shift data. Consider the spectrum of chloroethane shown in Figure \(\PageIndex{5}\) and the frequency of the peaks (collected on a 60 MHz spectrometer) give in Table \(\PageIndex{4}\).

| Peak Label | \(\delta\) (ppm) | v (Hz) |
|---|---|---|
| a | 3.7805 | 226.83 |
| b | 3.6628 | 219.77 |
| c | 3.5452 | 212.71 |
| d | 3.4275 | 205.65 |
| e | 1.3646 | 81.88 |
| f | 1.2470 | 74.82 |
| g | 1.1293 | 67.76 |
To determine the coupling constant for a multiplet (in this case, the quartet in Figure \(\PageIndex{3}\), the difference in frequency (ν) between each peak is calculated and the average of this value provides the coupling constant in Hz. For example using the data from Table \(\PageIndex{4}\):
Frequency of peak c - frequency of peak d = 212.71 Hz - 205.65 Hz = 7.06 Hz
Frequency of peak b - frequency of peak c = 219.77 Hz – 212.71 Hz = 7.06 Hz
Frequency of peak a - frequency of peak b = 226.83 Hz – 219.77 Hz = 7.06 Hz
Average: 7.06 Hz
∴ J(H-H) = 7.06 Hz
In this case the difference in frequency between each set of peaks is the same and therefore an average determination is not strictly necessary. In fact for 1st order spectra they should be the same. However, in some cases the peak picking programs used will result in small variations, and thus it is necessary to take the trouble to calculate a true average.
To determine the coupling constant of the same multiplet using chemical shift data (δ), calculate the difference in ppm between each peak and average the values. Then multiply the chemical shift by the spectrometer field strength (in this case 60 MHz), in order to convert the value from ppm to Hz:
Chemical shift of peak c - chemical shift of peak d = 3.5452 ppm – 3.4275 ppm = 0.1177 ppm
Chemical shift of peak b - chemical shift of peak c = 3.6628 ppm – 3.5452 ppm = 0.1176 ppm
Chemical shift of peak a - chemical shift of peak b = 3.7805 ppm – 3.6628 ppm = 0.1177 ppm
Average: 0.1176 ppm
Average difference in ppm x frequency of the NMR spectrometer = 0.1176 ppm x 60 MHz = 7.056 Hz
∴ J(H-H) = 7.06 Hz
Calculate the coupling constant for triplet in the spectrum for chloroethane (Figure \(\PageIndex{6}\)) using the data from Table \(\PageIndex{5}\).
Using frequency data:
Frequency of peak f - frequency of peak g = 74.82 Hz – 67.76 Hz = 7.06 Hz
Frequency of peak e - frequency of peak f = 81.88 Hz – 74.82 Hz = 7.06 Hz
Average = 7.06 Hz
∴ J(H-H) = 7.06 Hz
Alternatively, using chemical shift data:
Chemical shift of peak f - chemical shift of peak g = 1.2470 ppm – 1.1293 ppm = 0.1177 ppm
Chemical shift of peak e - chemical shift of peak f = 1.3646 ppm – 1.2470 ppm = 0.1176 ppm
Average = 0.11765 ppm
0.11765 ppm x 60 MHz = 7.059 Hz
∴ J(H-H) = 7.06 Hz
Notice the coupling constant for this multiplet is the same as that in the example. This is to be expected since the two multiplets are coupled with each other.
Second-Order Coupling
When coupled nuclei have similar chemical shifts (more specifically, when Δν is similar in magnitude to J), second-order coupling or strong coupling can occur. In its most basic form, second-order coupling results in “roofing” (Figure \(\PageIndex{6}\)). The coupled multiplets point to or lean toward each other, and the effect becomes more noticeable as Δν decreases. The multiplets also become off-centered with second-order coupling. The midpoint between the peaks no longer corresponds exactly to the chemical shift.
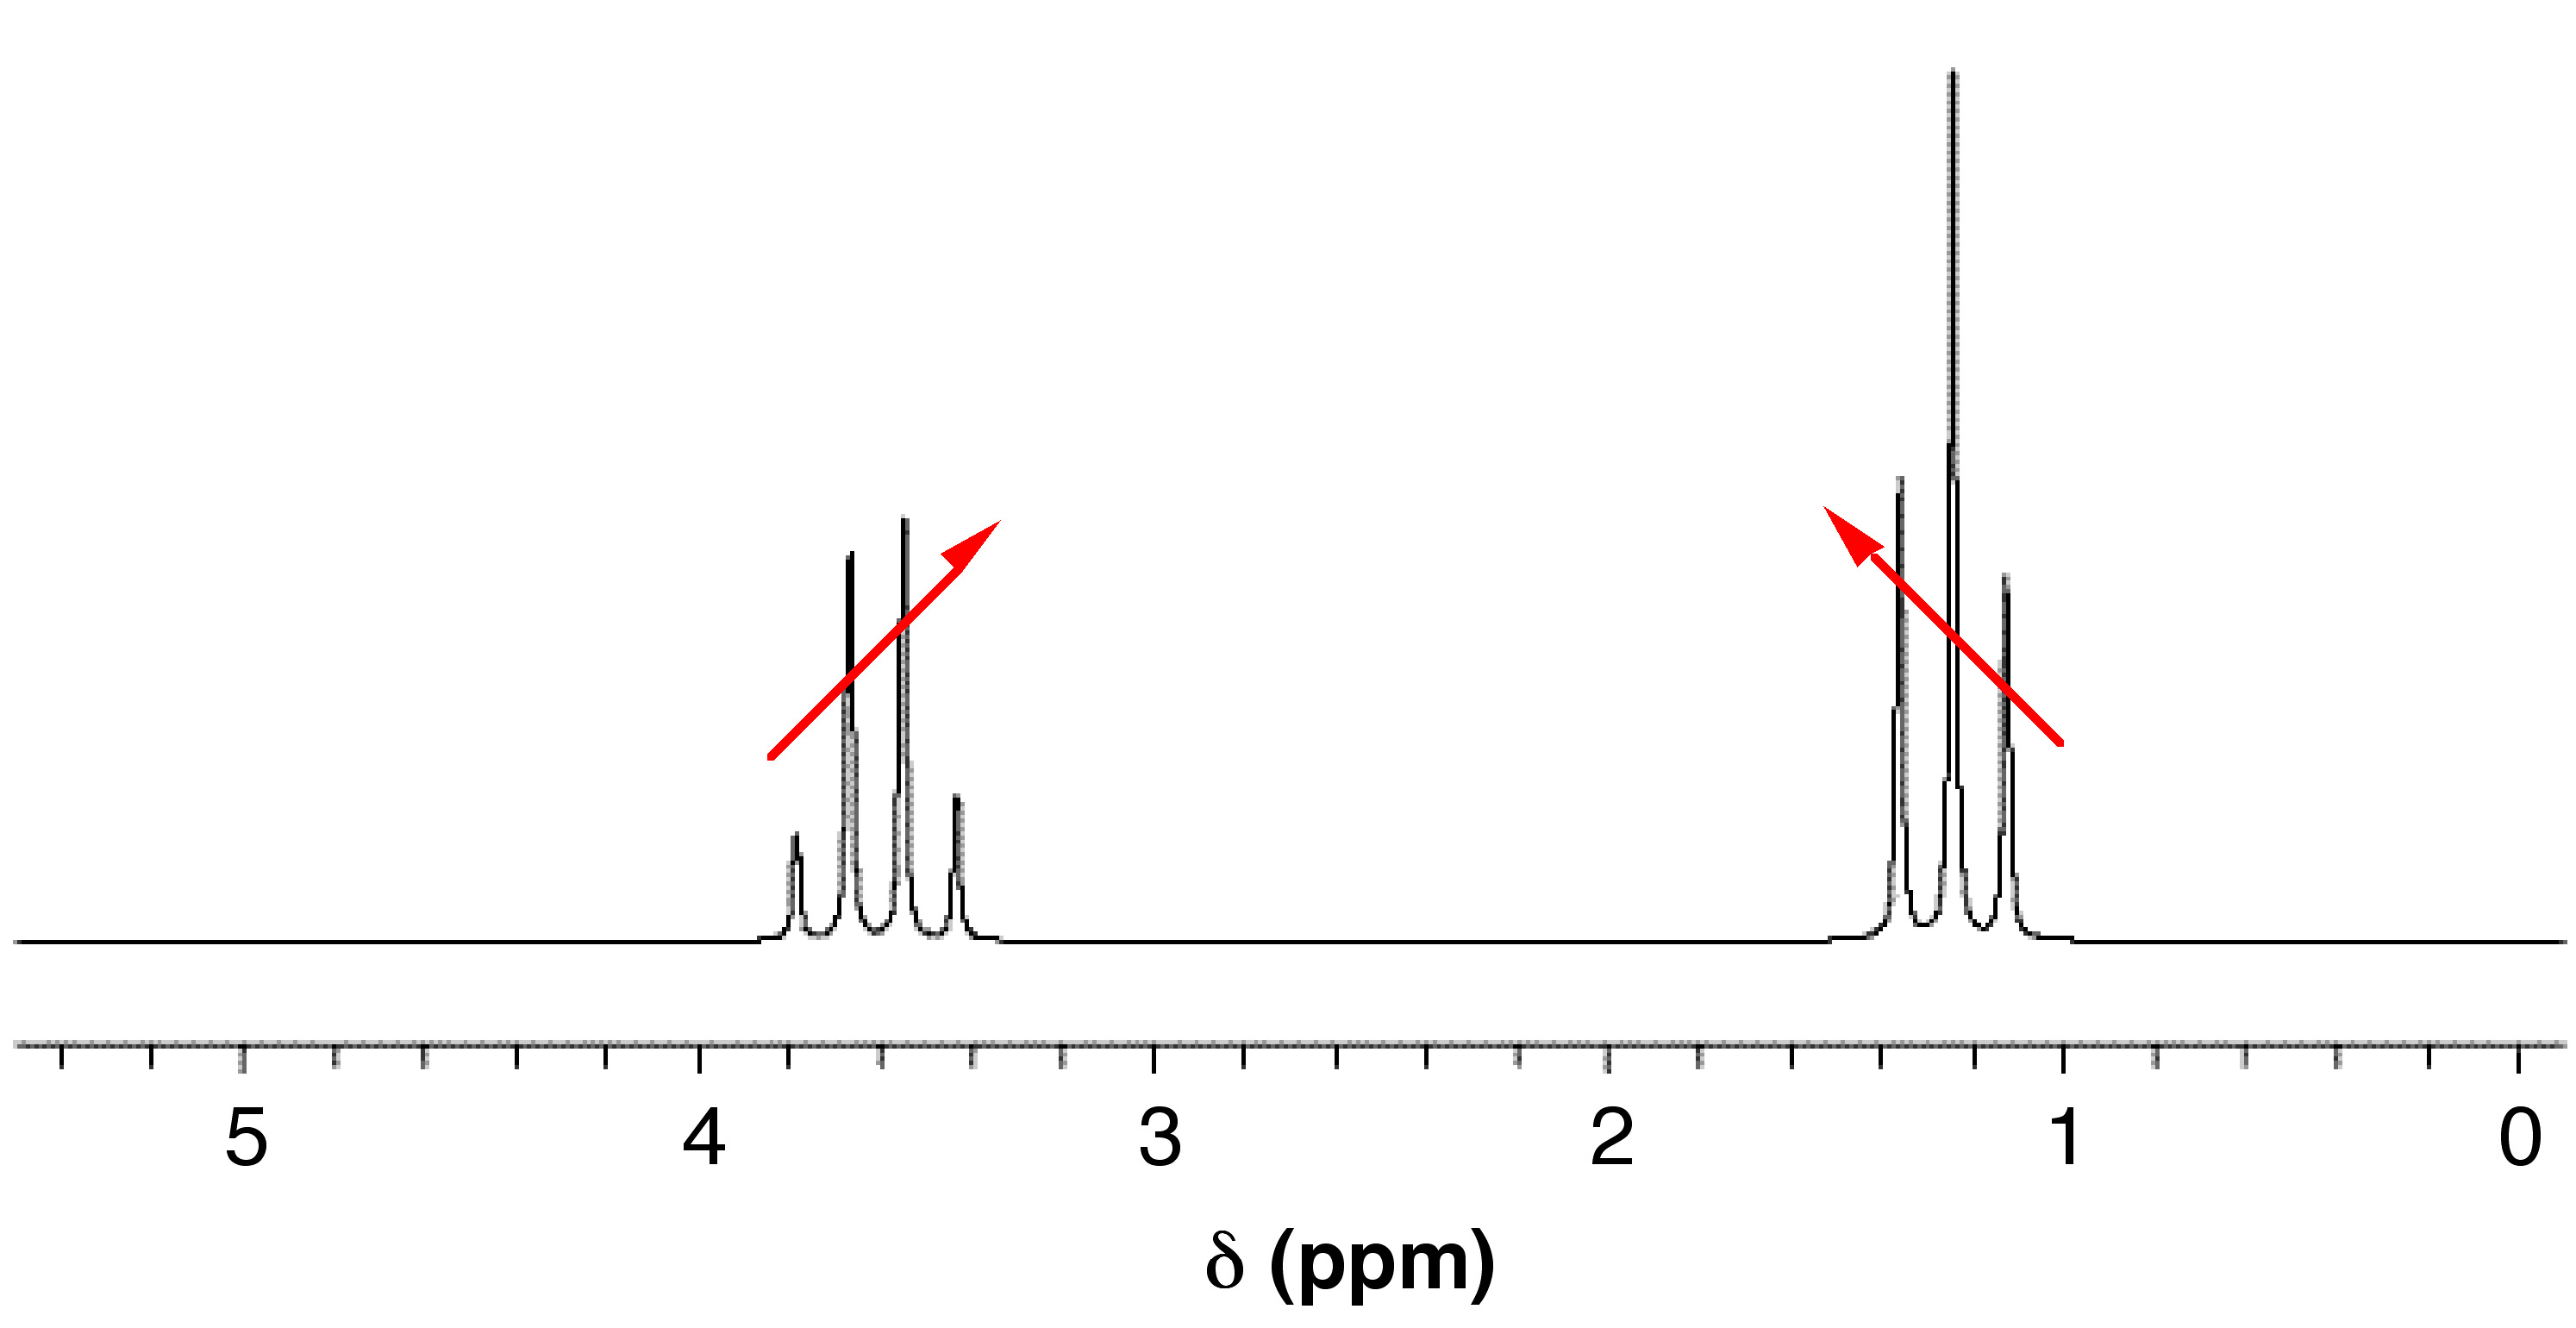
In more drastic cases of strong coupling (when Δν ≈ J), multiplets can merge to create deceptively simple patterns. Or, if more than two spins are involved, entirely new peaks can appear, making it difficult to interpret the spectrum manually. Second-order coupling can often be converted into first-order coupling by using a spectrometer with a higher field strength. This works by altering the Δν (which is dependent on the field strength), while J (which is independent of the field strength) stays the same.
P-31 NMR Spectroscopy
Phosphorus-31 nuclear magnetic resonance (31P NMR) is conceptually the same as proton (1H) NMR. The 31P nucleus is useful in NMR spectroscopy due to its relatively high gyromagnetic ratio (17.235 MHzT-1). For comparison, the gyromagnetic ratios of 1H and 13C are (42.576 MHz T-1) and (10.705 MHz T-1), respectively. Furthermore, 31P has a 100% natural isotopic abundance. Like the 1H nucleus, the 31P nucleus has a nuclear spin of 1/2 which makes spectra relatively easy to interpret. 31P NMR is an excellent technique for studying phosphorus containing compounds, such as organic compounds and metal coordination complexes.
Differences Between 1H and 31P NMR
There are certain significant differences between 1H and 31P NMR. While 1H NMR spectra is referenced to tetramethylsilane [Si(CH3)4], the chemical shifts in 31P NMR are typically reported relative to 85% phosphoric acid (δ = 0 ppm), which is used as an external standard due to its reactivity. However, trimethyl phosphite, P(OCH3)3, is also used since unlike phosphoric acid its shift (δ = 140 ppm) is not dependent on concentration or pH. As in 1H NMR, positive chemical shifts correspond to a downfield shift from the standard. However, prior to the mid-1970s, the convention was the opposite. As a result, older texts and papers report shifts using the opposite sign. Chemical shifts in 31P NMR commonly depend on the concentration of the sample, the solvent used, and the presence of other compounds. This is because the external standard does not take into account the bulk properties of the sample. As a result, reported chemical shifts for the same compound could vary by 1 ppm or more, especially for phosphate groups (P=O). 31P NMR spectra are often recorded with all proton signals decoupled, i.e., 31P-{1H}, as is done with 13C NMR. This gives rise to single, sharp signals per unique 31P nucleus. Herein, we will consider both coupled and decoupled spectra.
Interpreting Spectra
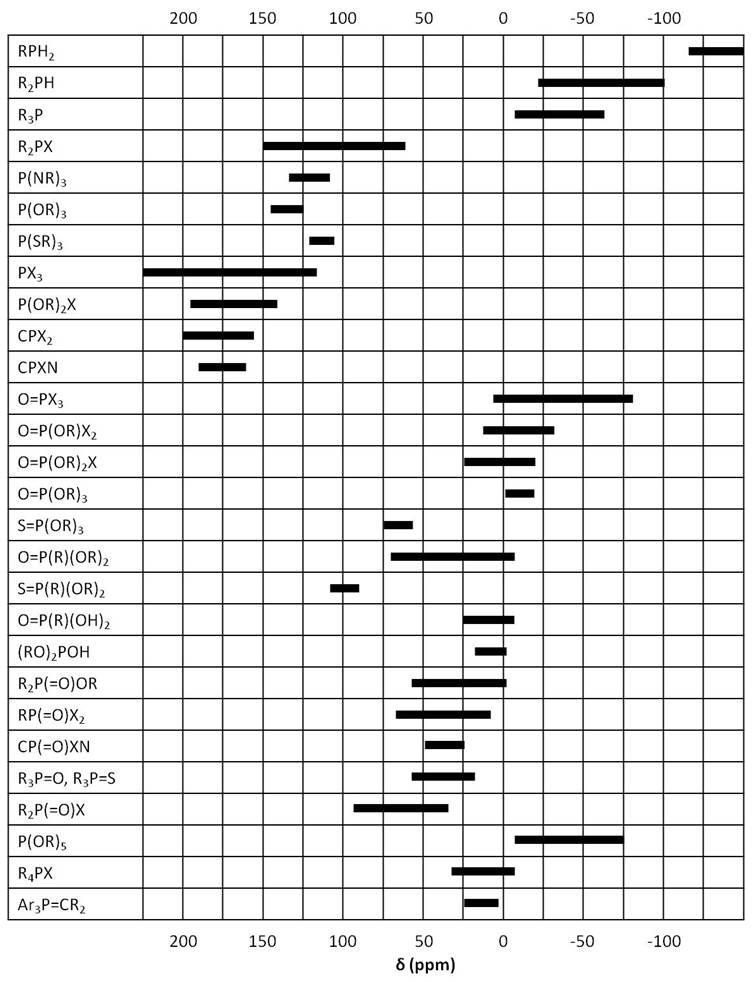
As in 1H NMR, phosphorus signals occur at different frequencies depending on the electron environment of each phosphorus nucleus Figure \(\PageIndex{7}\). In this section we will study a few examples of phosphorus compounds with varying chemical shifts and coupling to other nuclei.
Different Phosphorus Environments and their Coupling to 1H
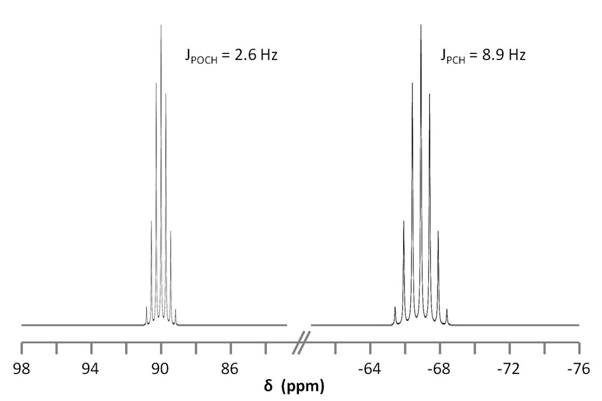
Consider the structure of 2,6,7-trioxa-1,4-diphosphabicyclo[2.2.2]octane [Pα(OCH2)3Pβ] shown in Figure \(\PageIndex{8}\). The subscripts α and β are simply used to differentiate the two phosphorus nuclei. According to Table 1, we expect the shift of Pα to be downfield of the phosphoric acid standard, roughly around 125 ppm to 140 ppm and the shift of Pβ to be upfield of the standard, between -5 ppm and -70 ppm. In the decoupled spectrum shown in Figure \(\PageIndex{8}\), we can assign the phosphorus shift at 90.0 ppm to Pα and the shift at -67.0 ppm to Pβ.
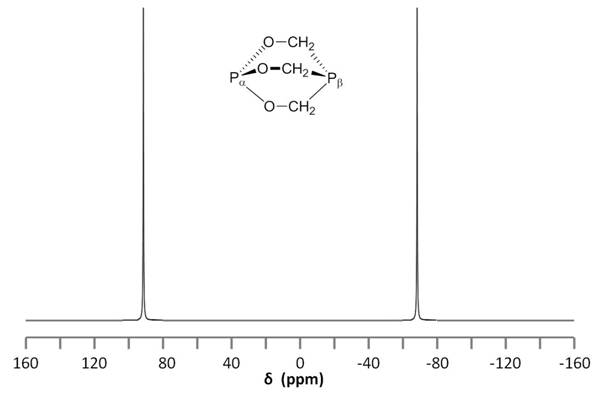
Figure \(\PageIndex{9}\) shows the coupling of the phosphorus signals to the protons in the compound. We expect a stronger coupling for Pβ because there are only two bonds separating Pβ from H, whereas three bonds separate Pαfrom H (JPCH > JPOCH). Indeed, JPCH = 8.9 Hz and JPOCH = 2.6 Hz, corroborating our peak assignments above.
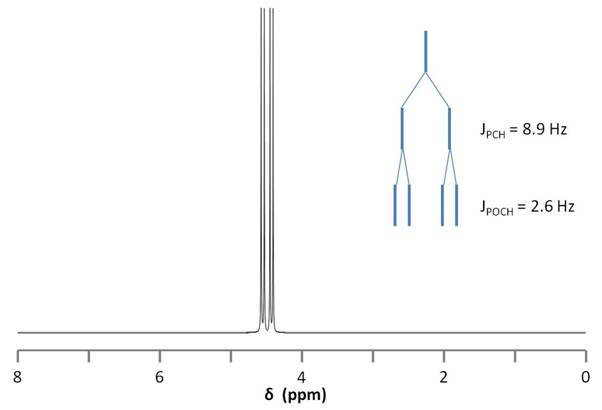
Finally, Figure \(\PageIndex{10}\) shows the 1H spectrum of Pα(OCH2)3Pβ (Figure \(\PageIndex{11}\)), which shows a doublet of doublets for the proton signal due to coupling to the two phosphorus nuclei.
As suggested by the data in Figure \(\PageIndex{7}\) we can predict and observe changes in phosphorus chemical shift by changing the coordination of P. Thus for the series of compounds with the structure shown in Figure \(\PageIndex{11}\) the different chemical shifts corresponding to different phosphorus compounds are shown in Table \(\PageIndex{3}\).

| X | Y | Pα chemical shift (ppm) | Pβ chemical shift (ppm) |
| - | - | 90.0 | -67.0 |
| O | O | -18.1 | 6.4 |
| S | - | 51.8 | -70.6 |
Coupling to Fluorine
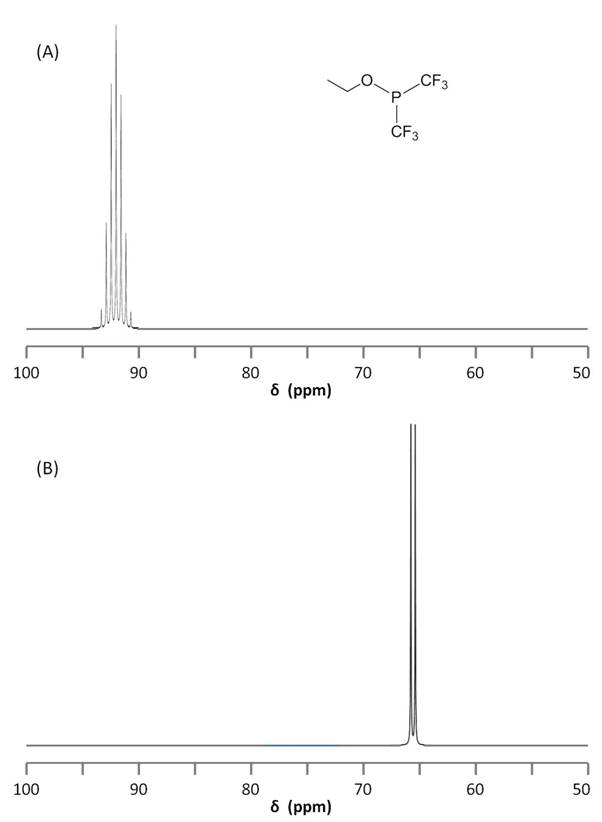
19F NMR is very similar to 31P NMR in that 19F has spin 1/2 and is a 100% abundant isotope. As a result, 19F NMR is a great technique for fluorine-containing compounds and allows observance of P-F coupling. The coupled 31P and 19F NMR spectra of ethoxybis(trifluoromethyl)phosphine, P(CF3)2(OCH2CH3), are shown in Figure \(\PageIndex{11}\). It is worth noting the splitting due to JPCF = 86.6 Hz.
31P - 1H Coupling
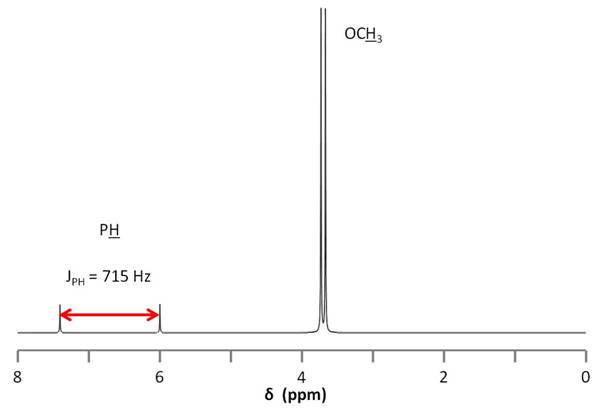
Consider the structure of dimethyl phosphonate, OPH(OCH3)2, shown in Figure \(\PageIndex{12}\). As the phosphorus nucleus is coupled to a hydrogen nucleus bound directly to it, that is, a coupling separated by a single bond, we expect JPH to be very high. Indeed, the separation is so large (715 Hz) that one could easily mistake the split peak for two peaks corresponding to two different phosphorus nuclei.
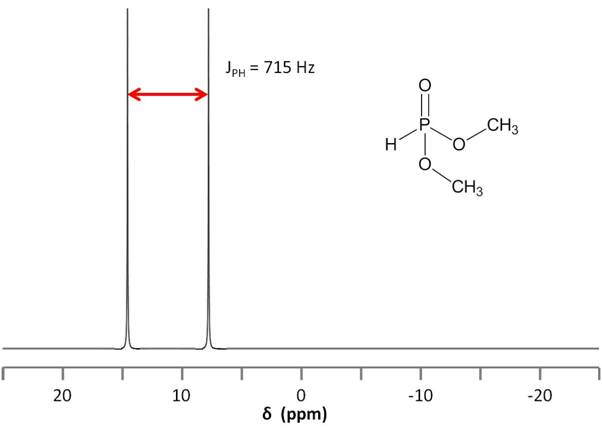
This strong coupling could also lead us astray when we consider the 1H NMR spectrum of dimethyl phosphonate (Figure \(\PageIndex{13}\)). Here we observe two very small peaks corresponding to the phosphine proton. The peaks are separated by such a large distance and are so small relative to the methoxy doublet (ratio of 1:1:12), that it would be easy to confuse them for an impurity. To assign the small doublet, we could decouple the phosphorus signal at 11 ppm, which will cause this peak to collapse into a singlet.
Obtaining 31P Spectra
Sample Preparation
Unlike 13C NMR, which requires high sample concentrations due to the low isotopic abundance of 13C, 31P sample preparation is very similar to 1H sample preparation. As in other NMR experiments, a 31P NMR sample must be free of particulate matter. A reasonable concentration is 2-10 mg of sample dissolved in 0.6-1.0 mL of solvent. If needed, the solution can be filtered through a small glass fiber. Note that the solid will not be analyzed in the NMR experiment. Unlike 1H NMR, however, the sample does not to be dissolved in a deuterated solvent since common solvents do not have 31P nuclei to contribute to spectra. This is true, of course, only if a 1H NMR spectrum is not to be obtained from this sample. Being able to use non-deuterated solvents offers many advantages to 31P NMR, such as the simplicity of assaying purity and monitoring reactions, which will be discussed later.
Instrument Operation
Instrument operation will vary according to instrumentation and software available. However, there are a few important aspects to instrument operation relevant to 31P NMR. The instrument probe, which excites nuclear spins and detects chemical shifts, must be set up appropriately for a 31P NMR experiment. For an instrument with a multinuclear probe, it is a simple matter to access the NMR software and make the switch to a 31P experiment. This will select the appropriate frequency for 31P. For an instrument which has separate probes for different nuclei, it is imperative that one be trained by an expert user in changing the probes on the spectrometer.
Before running the NMR experiment, consider whether the 31P spectrum should include coupling to protons. Note that 31P spectra are typically reported with all protons decoupled, i.e., 311P-{1H}. This is usually the default setting for a 31P NMR experiment. To change the coupling setting, follow the instructions specific to your NMR instrument software.
As mentioned previously, chemical shifts in 31P NMR are reported relative to 85% phosphoric acid. This must be an external standard due to the high reactivity of phosphoric acid. One method for standardizing an experiment uses a coaxial tube inserted into the sample NMR tube (Figure \(\PageIndex{14}\)). The 85% H3PO4 signal will appear as part of the sample NMR spectrum and can thus be set to 0 ppm.

Another way to reference an NMR spectrum is to use a 85% H3PO4 standard sample. These can be prepared in the laboratory or purchased commercially. To allow for long term use, these samples are typically vacuum sealed, as opposed to capped the way NMR samples typically are. The procedure for using a separate reference is as follows.
- Insert NMR sample tube into spectrometer.
- Tune the 31P probe and shim the magnetic field according to your individual instrument procedure.
- Remove NMR sample tube and insert H3PO4 reference tube into spectrometer.
- Begin NMR experiment. As scans proceed, perform a fourier transform and set the phosphorus signal to 0 ppm. Continue to reference spectrum until the shift stops changing.
- Stop experiment.
- Remove H3PO4 reference tube and insert NMR sample into spectrometer.
- Run NMR experiment without changing the referencing of the spectrum.
31P NMR Applications
Assaying Sample Purity
31P NMR spectroscopy gives rise to single sharp peaks that facilitate differentiating phosphorus-containing species, such as starting materials from products. For this reason, 31P NMR is a quick and simple technique for assaying sample purity. Beware, however, that a “clean” 31P spectrum does not necessarily suggest a pure compound, only a mixture free of phosphorus-containing contaminants.
31P NMR can also be used to determine the optical purity of a chiral sample. Adding an enantiomer to the chiral mixture to form two different diastereomers will give rise to two unique chemical shifts in the 31P spectrum. The ratio of these peaks can then be compared to determine optical purity.
Monitoring Reactions
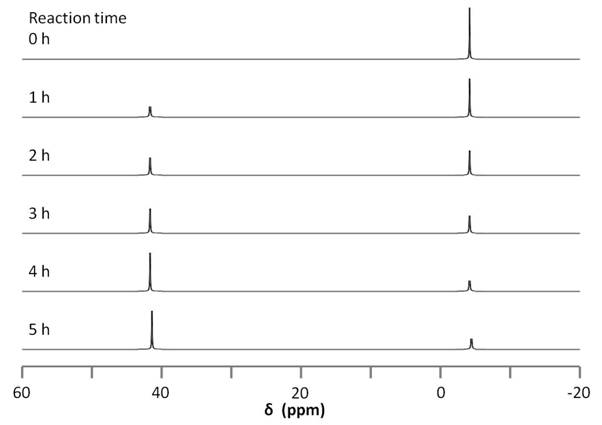
As suggested in the previous section, 31P NMR can be used to monitor a reaction involving phosphorus compounds. Consider the reaction between a slight excess of organic diphosphine ligand and a nickel(0) bis-cyclooctadiene, Figure \(\PageIndex{15}\).

The reaction can be followed by 31P NMR by simply taking a small aliquot from the reaction mixture and adding it to an NMR tube, filtering as needed. The sample is then used to acquire a 31P NMR spectrum and the procedure can be repeated at different reaction times. The data acquired for these experiments is found in Figure \(\PageIndex{16}\). The changing in 31P peak intensity can be used to monitor the reaction, which begins with a single signal at -4.40 ppm, corresponding to the free diphosphine ligand. After an hour, a new signal appears at 41.05 ppm, corresponding the the diphosphine nickel complex. The downfield peak grows as the reaction proceeds relative to the upfield peak. No change is observed between four and five hours, suggesting the conclusion of the reaction.
There are a number of advantages for using 31P for reaction monitoring when available as compared to 1H NMR:
- There is no need for a deuterated solvent, which simplifies sample preparation and saves time and resources.
- The 31P spectrum is simple and can be analyzed quickly. The corresponding 1H NMR spectra for the above reaction would include a number of overlapping peaks for the two phosphorus species as well as peaks for both free and bound cyclooctadiene ligand.
- Purification of product is also easy assayed.
31P NMR does not eliminate the need for 1H NMR chacterization, as impurities lacking phosphorus will not appear in a 31P experiment. However, at the completion of the reaction, both the crude and purified products can be easily analyzed by both 1H and 31P NMR spectroscopy.
Measuring Epoxide Content of Carbon Nanomaterials
One can measure the amount of epoxide on nanomaterials such as carbon nanotubes and fullerenes by monitoring a reaction involving phosphorus compounds in a similar manner to that described above. This technique uses the catalytic reaction of methyltrioxorhenium (Figure \(\PageIndex{17}\)). An epoxide reacts with methyltrioxorhenium to form a five membered ring. In the presence of triphenylphosphine (PPH3), the catalyst is regenerated, forming an alkene and triphenylphosphine oxide (OPPh3). The same reaction can be applied to carbon nanostructures and used to quantify the amount of epoxide on the nanomaterial. Figure \(\PageIndex{18}\) illustrates the quantification of epoxide on a carbon nanotube.


Because the amount of initial PPh3 used in the reaction is known, the relative amounts of PPh3 and OPPh3can be used to stoichiometrically determine the amount of epoxide on the nanotube. 31P NMR spectroscopy is used to determine the relative amounts of PPh3 and OPPh3 (Figure \(\PageIndex{19}\)).
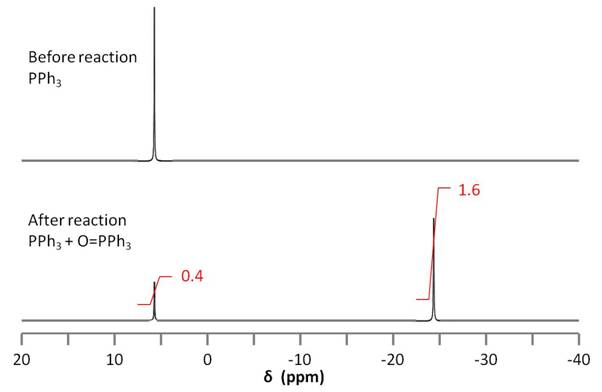
The integration of the two 31P signals is used to quantify the amount of epoxide on the nanotube according to \ref{4}.
\[ Moles\ of\ Epoxide\ =\ \frac{area\ of\ OPPH_{3}\ peak}{area\ of\ PPh_{3}\ peak} \times \ moles\ PPh_{3} \label{4} \]
Thus, from a known quantity of PPh3, one can find the amount of OPPh3 formed and relate it stoichiometrically to the amount of epoxide on the nanotube. Not only does this experiment allow for such quantification, it is also unaffected by the presence of the many different species present in the experiment. This is because the compounds of interest, PPh3 and OPPh3, are the only ones that are characterized by 31P NMR spectroscopy.
Conclusion
31P NMR spectroscopy is a simple technique that can be used alongside 1H NMR to characterize phosphorus-containing compounds. When used on its own, the biggest difference from 1H NMR is that there is no need to utilize deuterated solvents. This advantage leads to many different applications of 31P NMR, such as assaying purity and monitoring reactions.
NMR Spectroscopy of Stereoisomers
Nuclear magnetic resonance (NMR) spectroscopy is a very useful tool used widely in modern organic chemistry. It exploits the differences in the magnetic properties of different nuclei in a molecule to yield information about the chemical environment of the nuclei, and subsequently the molecule, in question. NMR analysis lends itself to scientists more easily than say the more cryptic data achieved form ultraviolet or infared spectra because the differences in magnetic properties lend themselves to scientists very well. The chemical shifts that are characteristic of different chemical environments and the multiplicity of the peaks fit well with our conception of the way molecules are structured.
Using NMR spectroscopy, we can differentiate between constitutional isomers, stereoisomers, and enantiomers. The later two of these three classifications require close examination of the differences in NMR spectra associated with changes in chemical environment due to symmetry differences; however, the differentiation of constitutional isomers can be easily obtained.
Constitutional Isomerism
Nuclei both posses charge and spin, or angular momentum, and from basic physics we know that a spinning charge generates a magnetic moment. The specific nature of this magnetic moment is the main concern of NMR spectroscopy.
For proton NMR, the local chemical environment makes different protons in a molecule resonate at different frequencies. This difference in resonance frequencies can be converted into a chemical shift (δ) for each nucleus being studied. Because each chemical environment results in a different chemical shift, one can easily assign peaks in the NMR data to specific functional groups based upon president. Presidents for chemical shifts can be found in any number of basic NMR text. For example, Figure \(\PageIndex{20}\) shows the spectra of ethyl formate and benzyl acetate. In the lower spectra, benzyl acetate, notice peaks at δ = 1.3, 4.2, and 8.0 ppm characteristic of the primary, secondary, and aromatic protons, respectively, present in the molecule. In the spectra of ethyl formate (Figure \(\PageIndex{20}\) b), notice that the number of peaks is is the same as that of benzyl acetate (Figure \(\PageIndex{20}\) a); however, the multiplicity of peaks and their shifts is very different.
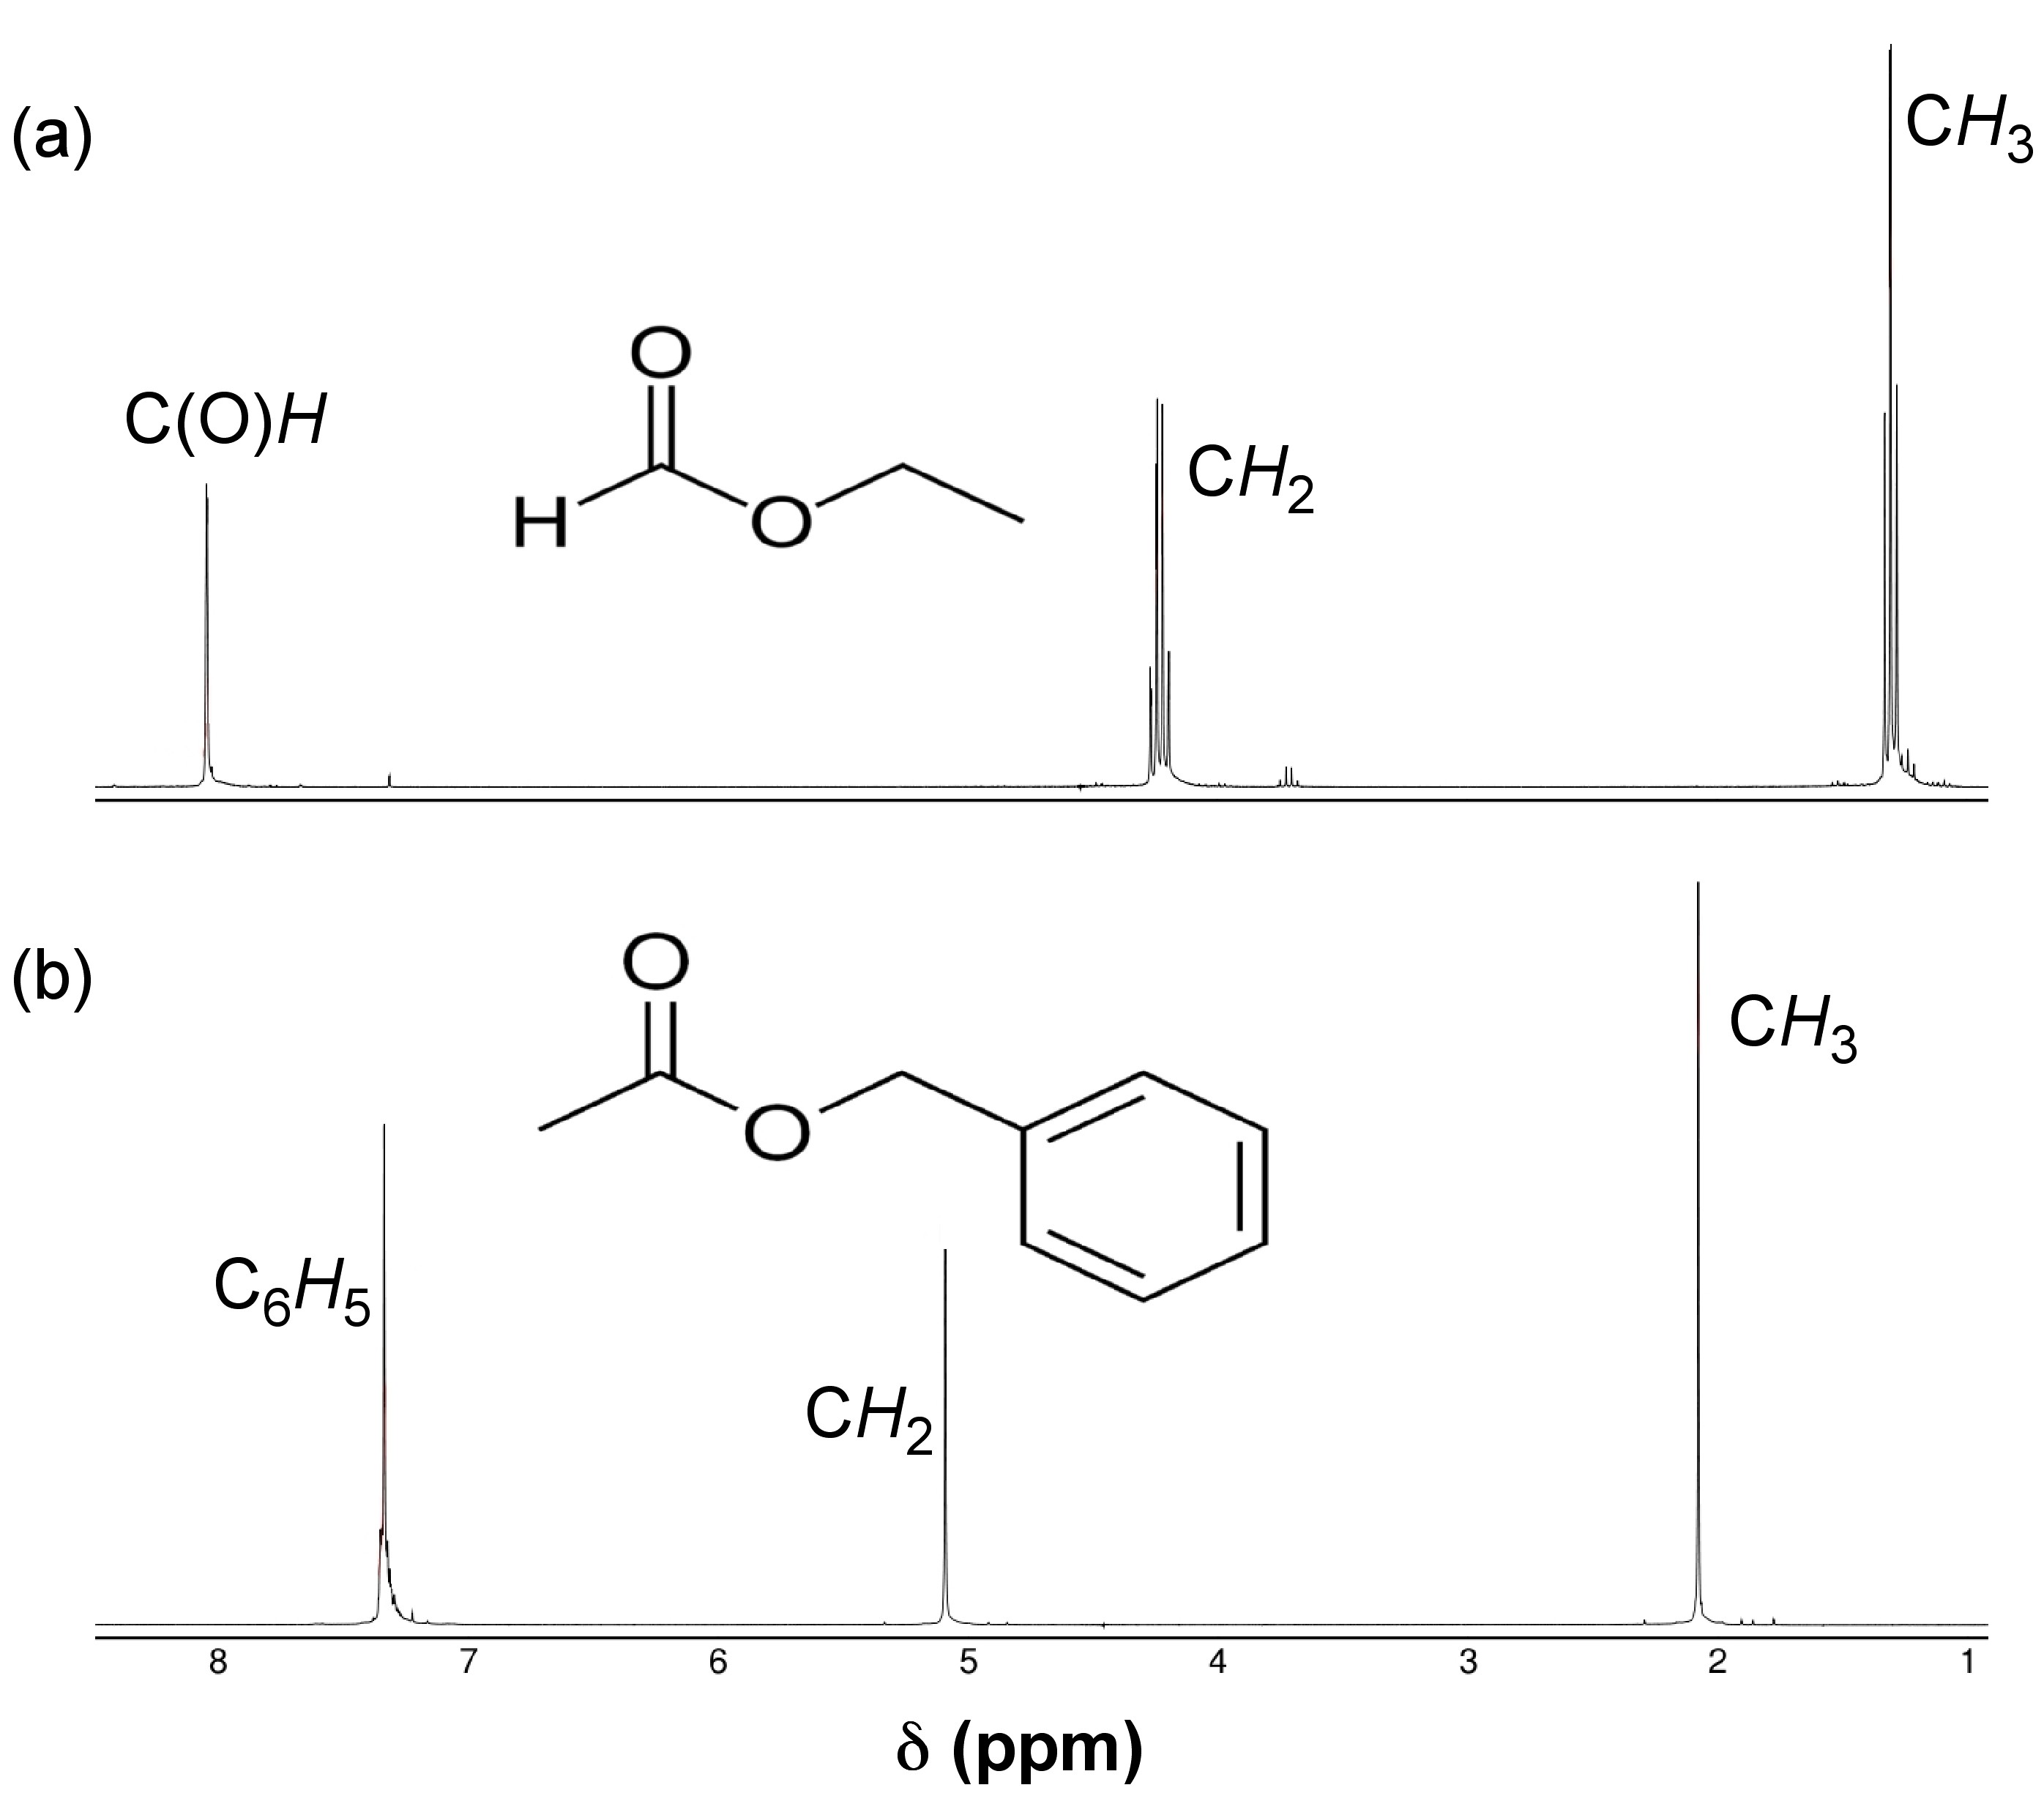
The difference between these two spectra is due to geminal spin-spin coupling. Spin-spin coupling is the result of magnetic interaction between individual protons transmitted by the bonding electrons between the protons. This spin-spin coupling results in the speak splitting we see in the NMR data. One of the benefits of NMR spectroscopy is the sensitivity to very slight changes in chemical environment.
Stereoisomerism
Diastereomers
Based on their definition, diastereomers are stereoisomers that are not mirror images of each other and are not superimposable. In general, diastereomers have differing reactivity and physical properties. One common example is the difference between threose and erythrose (Figure \(\PageIndex{21}\).
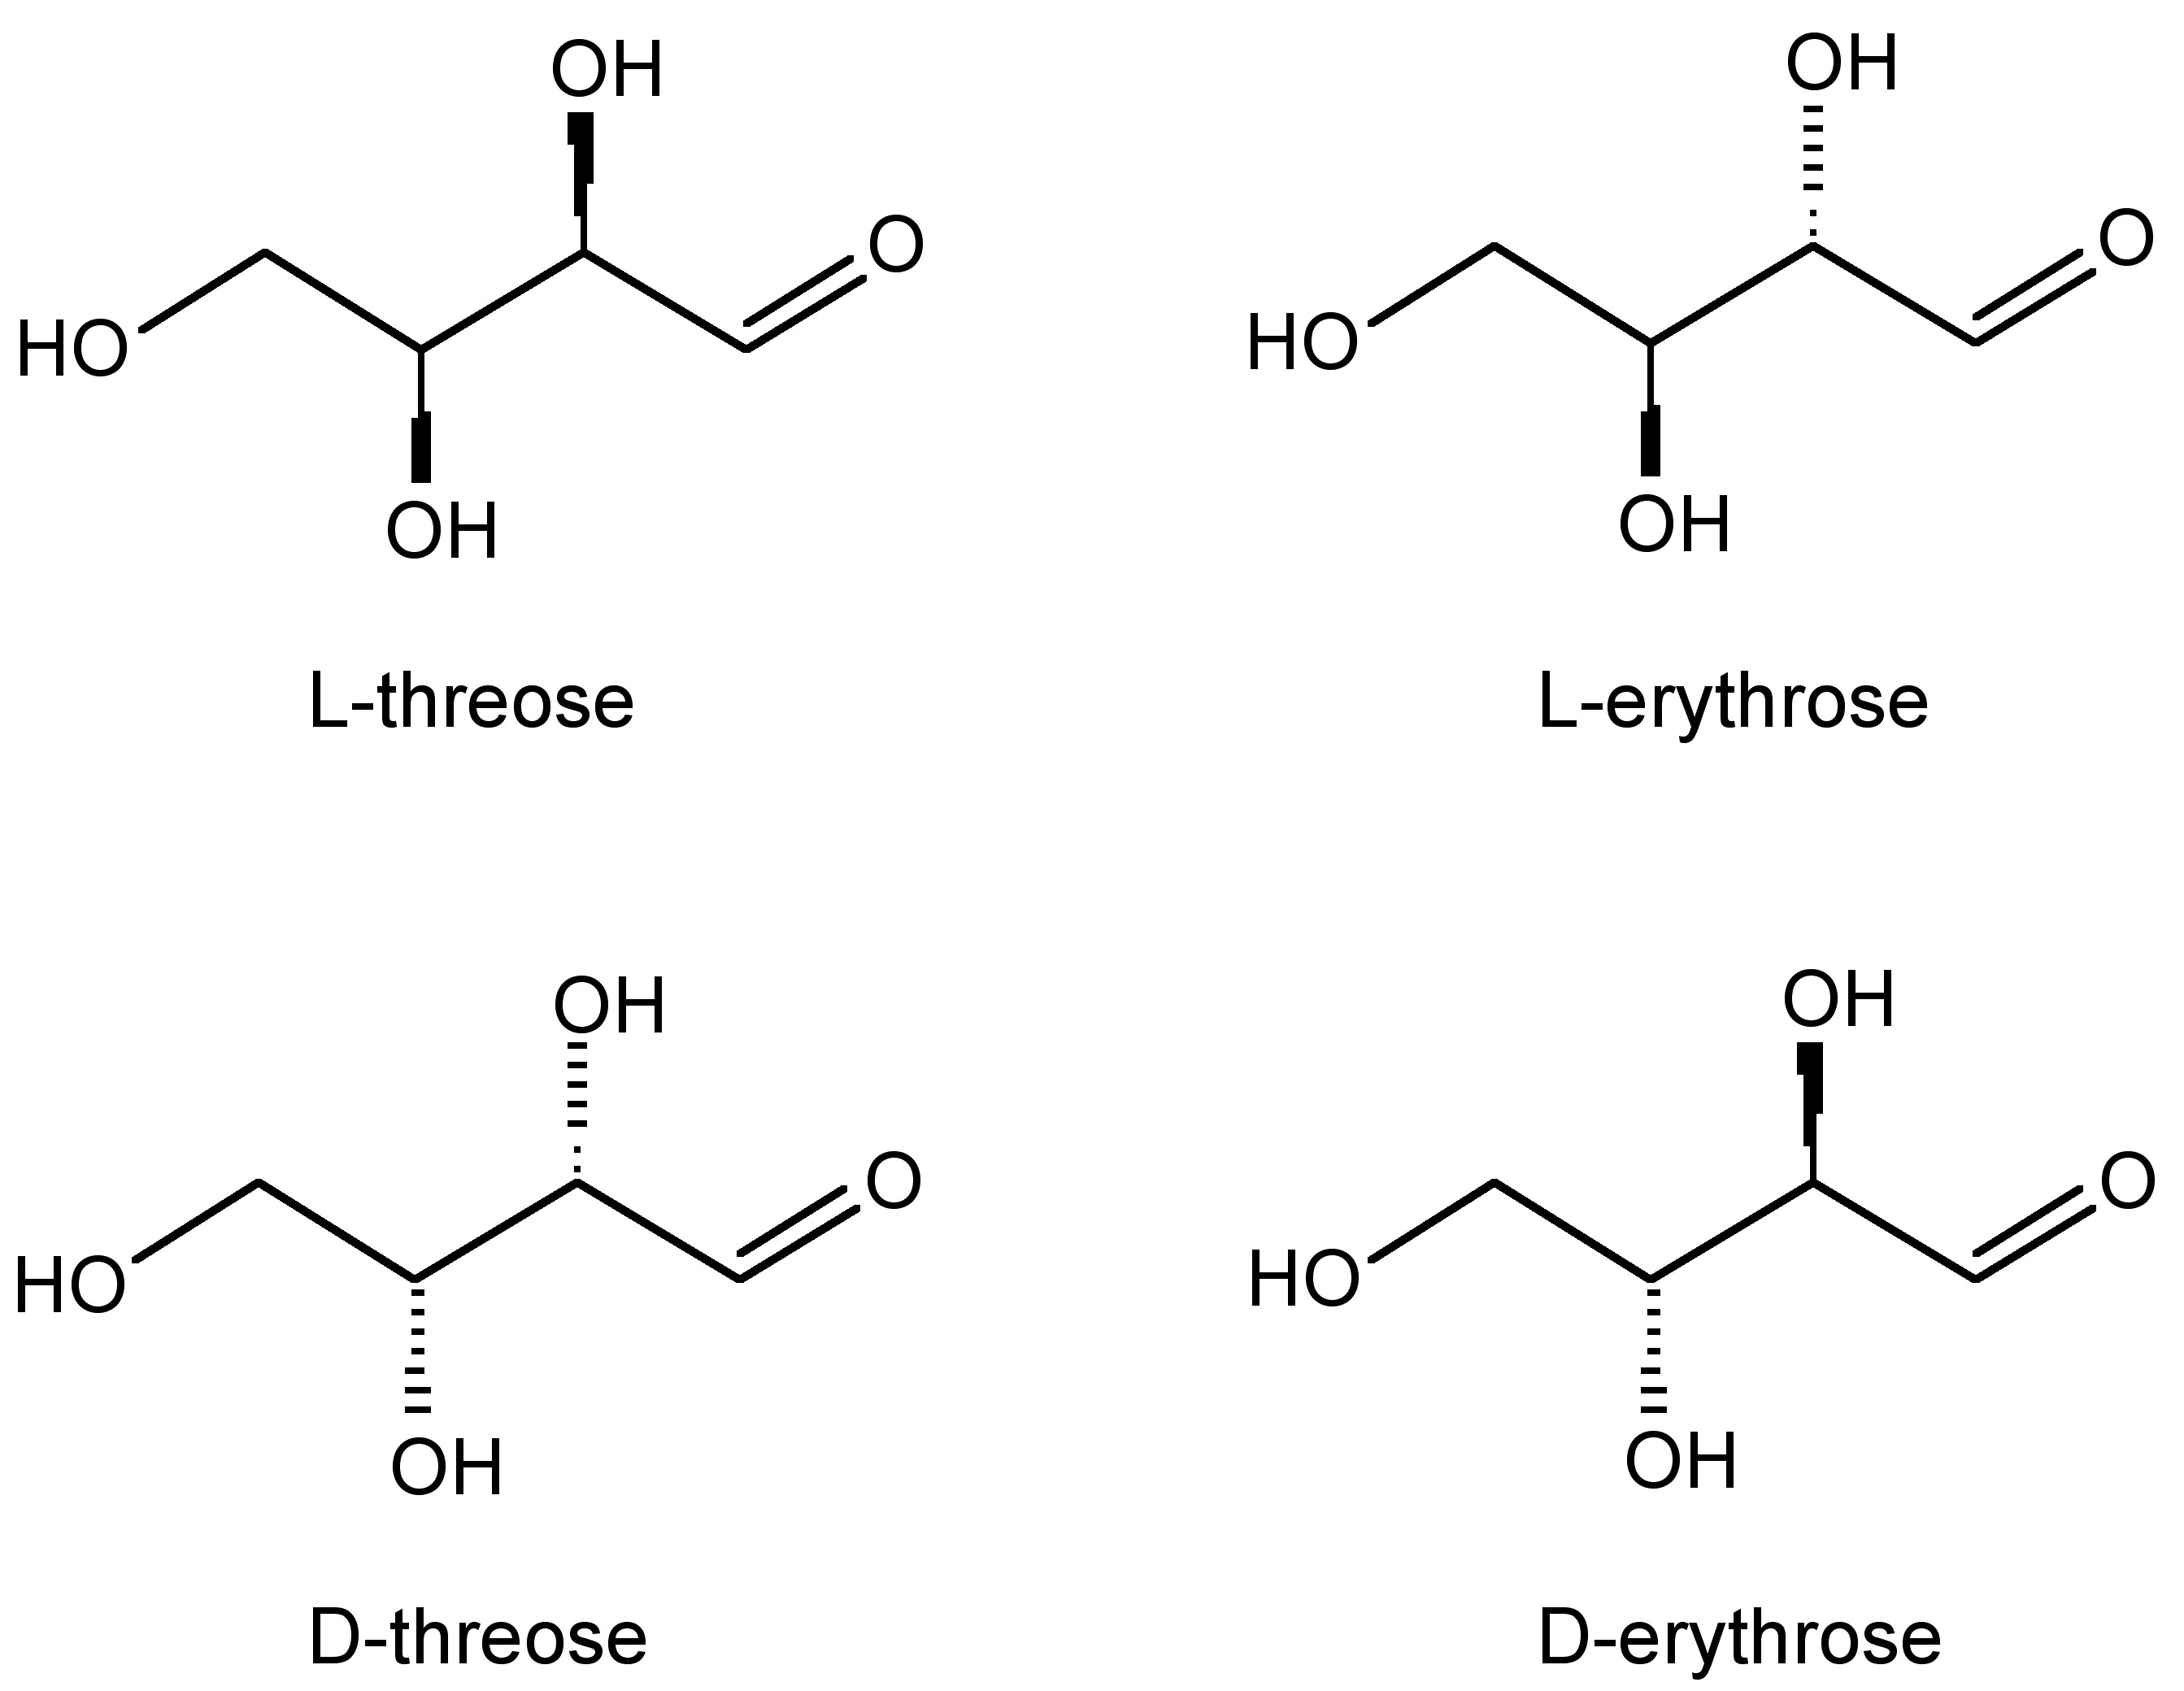
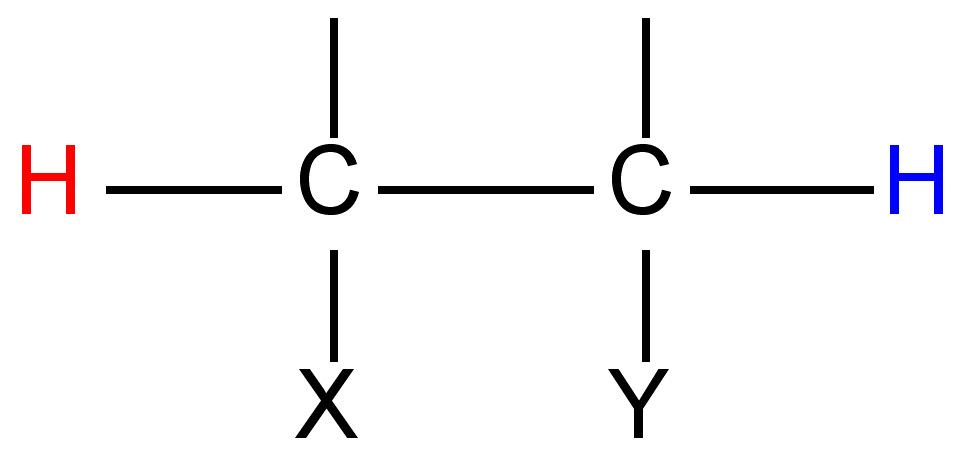
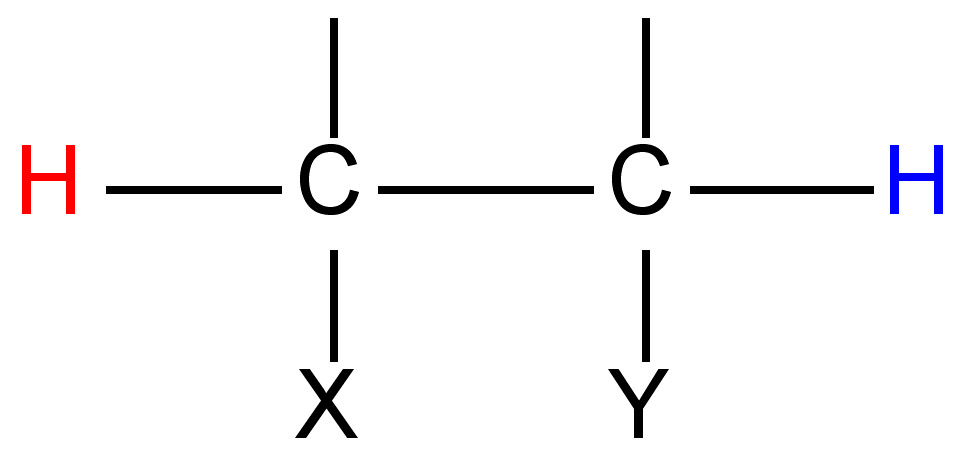
As one can see from Figure \(\PageIndex{22}\), these chemicals are very similar each having the empirical formula of C4H7O4. One may wonder: how are these slight differences in chemical structure represented in NMR? To answer this question, we must look at the Newman projections for a molecule of the general structure Figure \(\PageIndex{22}\).
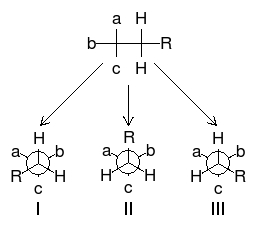
One can easily notice that the two protons represented are always located in different chemical environments. This is true because the R group makes the proton resonance frequencies v1(I) ≠ v2(III), v2(I) ≠ v1(II), and v2(II) ≠ v1(III). Thus, diastereomers have different vicinal proton-proton couplings and the resulting chemical shifts can be used to identify the isomeric makeup of the sample.
Enantiomers
Enantiomers are compounds with a chiral center. In other words, they are non-superimposable mirror images. Unlike diastereomers, the only difference between enantiomers is their interaction with polarized light. Unfortunately, this indistinguishability of racemates includes NMR spectra. Thus, in order to differentiate between enantiomers, we must make use of an optically active solvent also called a chiral derivatizing agent (CDA). The first CDA was (α-methoxy-α-(trifluoromethyl)phenylacetic acid) (MTPA also known as Mosher's acid) (Figure \(\PageIndex{23}\)).
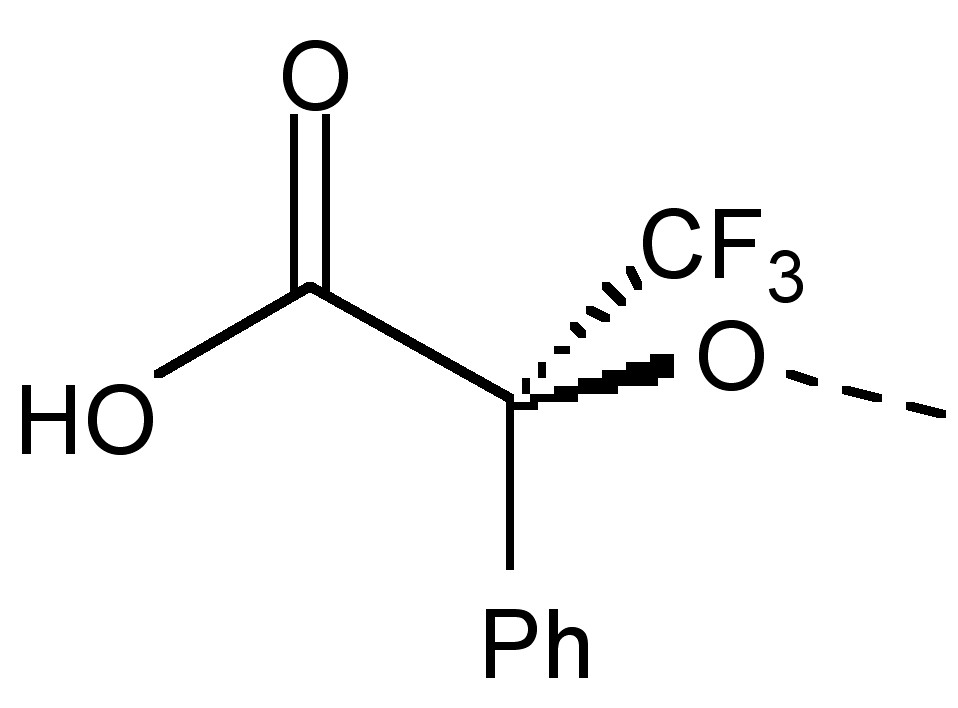
Now, many CDAs exist and are readily available. It should also be noted that CDA development is a current area of active research. In simple terms, one can think of the CDA turning an enantiomeric mixture into a mixture of diastereomeric complexes, producing doublets where each half of the doublet corresponds to each diastereomer, which we already know how to analyze. The resultant peak splitting in the NMR spectra due to diastereomeric interaction can easily determine optical purity. In order to do this, one may simply integrate the peaks corresponding to the different enantiomers thus yielding optical purity of incompletely resolved racemates. One thing of note when performing this experiment is that this interaction between the enantiomeric compounds and the solvent, and thus the magnitude of the splitting, depends upon the asymmetry or chirality of the solvent, the intermolecular interaction between the compound and the solvent, and thus the temperature. Thus, it is helpful to compare the spectra of the enantiomer-CDA mixture with that of the pure enantiomer so that changes in chemical shift can be easily noted.
Basics of Solid-State NMR
NMR stands for nuclear magnetic resonance and functions as a powerful tool for chemical characterization. Even though NMR is used mainly for liquids and solutions, technology has progressed to where NMR of solids can be obtained with ease. Aptly named as solid state NMR, the expansion of usable phases has invariably increased our ability to identify chemical compounds. The reason behind difficulties using the solid state lie in the fact that solids are never uniform. When put through a standard NMR, line broadening interactions cannot be removed by rapid molecular motions, which results in unwieldy wide lines which provide little to no useful information. The difference is so staggering that lines broaden by hundreds to thousands of hertz as opposed to less than 0.1 Hz in solution when using an I = 1/2 spin nucleus.
A process known as magic angle spinning (MAS), where the sample is tilted at a specific angle, is used in order to overcome line broadening interactions and achieve usable peak resolutions. In order to understand solid state NMR, its history, operating chemical and mathematical principles, and distinctions from gas phase/solution NMR will be explained.
History
The first notable contribution to what we know today as NMR was Wolfgang Pauli’s (Figure \(\PageIndex{24}\)) prediction of nuclear spin in 1926. In 1932 Otto Stern (Figure \(\PageIndex{25}\)) used molecular beams and detected nuclear magnetic moments.

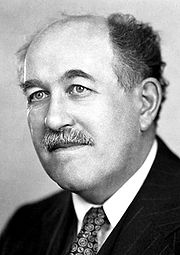
Four years later, Gorter performed the first NMR experiment with lithium fluoride (LiF) and hydrated potassium alum (K[Al(SO4)2]•12H2O) at low temperatures. Unfortunately, he was unable to characterize the molecules and the first successful NMR for a solution of water was taken in 1945 by Felix Bloch (Figure \(\PageIndex{27}\)). In the same year, Edward Mills Purcell (Figure \(\PageIndex{27}\)) managed the first successful NMR for the solid paraffin. Continuing their research, Bloch obtained the 1H NMR of ethanol and Purcell obtained that of paraffin in 1949. In the same year, the chemical significance of chemical shifts was discovered. Finally, high resolution solid state NMR was made possible in 1958 by the discovery of magic angle spinning.


How it Works: From Machine to Graph
NMR spectroscopy works by measuring the nuclear shielding, which can also be seen as the electron density, of a particular element. Nuclear shielding is affected by the chemical environment, as different neighboring atoms will have different effects on nuclear shielding, as electronegative atoms will tend to decrease shielding and vice versa. NMR requires the elements analyzed to have a spin state greater than zero. Commonly used elements are 1H, 13C, and 29Si. Once inside the NMR machine, the presence of a magnetic field splits the spin states (Figure \(\PageIndex{29}\)).
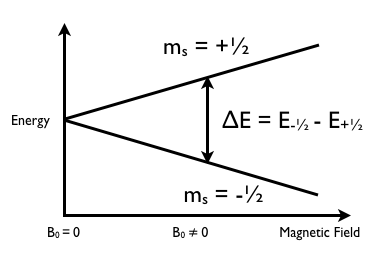
From (Figure \(\PageIndex{29}\) we see that a spin state of 1/2 is split into two spin states. As spin state value increases, so does the number of spin states. A spin of 1 will have three spin states, 3/2 will have four spin states, and so on. However, higher spin states increases the difficulty to accurately read NMR results due to confounding peaks and decreased resolution, so spin states of ½ are generally preferred. The E, or radiofrequency shown in (Figure \(\PageIndex{29}\) can be described by \ref{5}, where µ is the magnetic moment, a property intrinsic to each particular element. This constant can be derived from \ref{6}, where ϒ is the gyromagnetic ratio, another element dependent quantity, h is Planck’s constant, and I is the spin.
\[ E\ =\ \mu B_{0}H_{0} \label{5} \]
\[ \mu \ =\ \gamma h (I(I + 1))^{1/2} \label{6} \]
In \ref{5} can have E substituted for hν, leading to \ref{7}, which can solve for the NMR resonance frequency (v).
\[ h \nu \ =\ \mu B_{0}H_{0} \label{7} \]
Using the frequency (v), the δ, or expected chemical shift may be computed using \ref{8}.
\[ \delta \ =\ \frac{(\nu _{observed} - \nu _{reference})}{\nu _{spectrometer}} \label{8} \]
Delta (δ) is observed in ppm and gives the distance from a set reference. Delta is directly related to the chemical environment of the particular atom. For a low field, or high delta, an atom is in an environment which produces induces less shielding than in a high field, or low delta.
NMR Instrument
An NMR can be divided into three main components: the workstation computer where one operates the NMR instrument, the NMR spectrometer console, and the NMR magnet. A standard sample is inserted through the bore tube and pneumatically lowered into the magnet and NMR probe (Figure \(\PageIndex{30}\)).
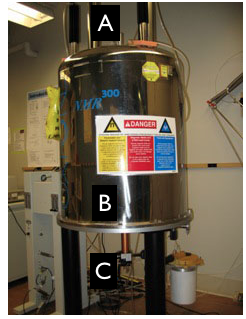
The first layer inside the NMR (Figure \(\PageIndex{31}\) is the liquid nitrogen jacket. Normally, this space is filled with liquid nitrogen at 77 K. The liquid nitrogen reservoir space is mostly above the magnet so that it can act as a less expensive refrigerant to block infrared radiation from reaching the liquid helium jacket.
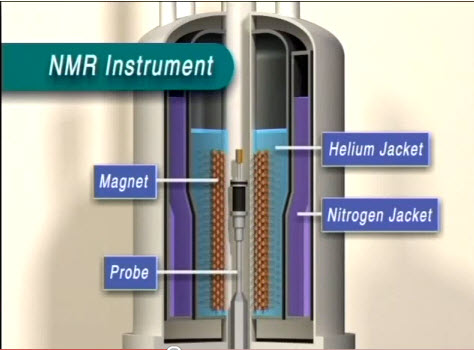
The layer following the liquid nitrogen jacket is a 20 K radiation shield made of aluminum wrapped with alternating layers of aluminum foil and open weave gauze. Its purpose is to block infrared radiation which the 77 K liquid nitrogen vessel was unable to eliminate, which increases the ability for liquid helium to remain in the liquid phase due to its very low boiling point. The liquid helium vessel itself, the next layer, is made of stainless steel wrapped in a single layer of aluminum foil, acting once again as an infrared radiation shield. It is about 1.6 mm thick and kept at 4.2 K.
Inside the vessel and around the magnet is the aluminum baffle, which acts as another degree of infrared radiation protection as well as a layer of protection for the superconducting magnet from liquid helium reservoir fluctuations, especially during liquid helium refills. The significance is that superconducting magnets at low fields are not fully submerged in liquid helium, but higher field superconducting magnets must maintain the superconducting solenoid fully immersed in liquid helium The vapor above the liquid itself is actually enough to maintain superconductivity of most magnets, but if it reaches a temperature above 10 K, the magnet quenches. During a quench, the solenoid exceeds its critical temperature for superconductivity and becomes resistive, generating heat. This heat, in turn, boils off the liquid helium. Therefore, a small opening at the very base of the baffle exists as a path for the liquid helium to reach the magnet surface so that during refills the magnet is protected from accidental quenching.
Problems with Solid State NMR
The most notable difference between solid samples and solution/gas in terms of NMR spectroscopy is that molecules in solution rotate rapidly while those in a solid are fixed in a lattice. Different peak readings will be produced depending on how the molecules are oriented in the magnetic field because chemical shielding depends upon the orientation of a molecule, causing chemical shift anisotropy. Therefore, the effect of chemical shielding also depends upon the orientation of the molecule with respect to the spectrometer. These counteracting forces are balanced out in gases and solutions because of their randomized molecular movement, but become a serious issue with fixed molecules observed in solid samples. If the chemical shielding isn’t determined accurately, neither will the chemical shifts (δ).
Another issue with solid samples are dipolar interactions which can be very large in solid samples causing linewidths of tens to hundreds of kilohertz to be generated. Dipolar interactions are tensor quantities, which demonstrate values dependent on the orientation and placement of a molecule in reference to its surroundings. Once again the issue goes back to the lattice structure of solids, which are in a fixed location. Even though the molecules are fixed, this does not mean that nuclei are evenly spread apart. Closer nuclei display greater dipolar interactions and vice versa, creating the noise seen in spectra of NMR not adapted for solid samples. Dipolar interactions are averaged out in solution states because of randomized movement. Spin state repulsions are averaged out by molecular motion of solutions and gases. However, in solid state, these interactions are not averaged and become a third source of line broadening.
Magic Angle Spinning
In order to counteract chemical shift anisotropy and dipolar interactions, magic angle spinning was developed. As discussed above, describing dipolar splitting and chemical shift aniostoropy interactions respectively, it becomes evident that both depend on the geometric factor (3cos2θ-1).
\[ Dipolar\ splitting \ =\ C(\mu _{0}/8 \pi )(\gamma _{a} \gamma _{x} / r^{2}_{ax})(3 cos^{2} \theta _{iz} - 1) \label{9} \]
\[ \sigma _{zz} \ =\ \bar{\sigma } + 1/3 \Sigma \sigma_{ii} (3 cos^{2} \theta _{iz} - 1) \label{10} \]
If this factor is decreased to 0, then line broadening due to chemical shift anisotropy and dipolar interactions will disappear. Therefore, solid samples are rotated at an angle of 54.74˚, effectively allowing solid samples to behave similarly to solutions/gases in NMR spectroscopy. Standard spinning rates range from 12 kHz to an upper limit of 35 kHz, where higher spin rates are necessary to remove higher intermolecular interactions.
Application of Solid State NMR
The development of solid state NMR is a technique necessary to understand and classify compounds that would not work well in solutions, such as powders and complex proteins, or study crystals too small for a different characterization method.
Solid state NMR gives information about local environment of silicon, aluminum, phosphorus, etc. in the structures, and is therefore an important tool in determining structure of molecular sieves. The main issue frequently encountered is that crystals large enough for X-Ray crystallography cannot be grown, so NMR is used since it determines the local environments of these elements. Additionally, by using 13C and 15N, solid state NMR helps study amyloid fibrils, filamentous insoluble protein aggregates related to neurodegenerative diseases such as Alzheimer’s disease, type II diabetes, Huntington’s disease, and prion diseases.
Using 13-C NMR to Study Carbon Nanomaterials
Carbon Nanomaterial
There are several types of carbon nanomaterial. Members of this family are graphene, single-walled carbon nanotubes (SWNT), multi-walled carbon nanotubes (MWNT), and fullerenes such as C60. Nano materials have been subject to various modification and functionalizations, and it has been of interest to develop methods that could observe these changes. Herein we discuss selected applications of 13C NMR in studying graphene and SWNTs. In addition, a discussion of how 13C NMR could be used to analyze a thin film of amorphous carbon during a low-temperature annealing process will be presented.
13C NMR vs. 1H NMR
Since carbon is found in any organic molecule NMR that can analyze carbon could be very helpful, unfortunately the major isotope, 12C, is not NMR active. Fortunately, 13C with a natural abundance of 1.1% is NMR active. This low natural abundance along with lower gyromagnetic ratio for 13C causes sensitivity to decrease. Due to this lower sensitivity, obtaining a 13C NMR spectrum with a specific signal-to-noise ratio requires averaging more spectra than the number of spectra that would be required to average in order to get the same signal to noise ratio for a 1H NMR spectrum. Although it has a lower sensitivity, it is still highly used as it discloses valuable information.
Peaks in a 1H NMR spectrum are split to n + 1 peak, where n is the number of hydrogen atoms on the adjacent carbon atom. The splitting pattern in 13C NMR is different. First of all, C-C splitting is not observed, because the probability of having two adjacent 13C is about 0.01%. Observed splitting patterns, which is due to the hydrogen atoms on the same carbon atom not on the adjacent carbon atom, is governed by the same n + 1 rule.
In 1H NMR, the integral of the peaks are used for quantitative analysis, whereas this is problematic in 13C NMR. The long relaxation process for carbon atoms takes longer comparing to that of hydrogen atoms, which also depends on the order of carbon (i.e., 1°, 2°, etc.). This causes the peak heights to not be related to the quantity of the corresponding carbon atoms.
Another difference between 13C NMR and 1H NMR is the chemical shift range. The range of the chemical shifts in a typical NMR represents the different between the minimum and maximum amount of electron density around that specific nucleus. Since hydrogen is surrounded by fewer electrons in comparison to carbon, the maximum change in the electron density for hydrogen is less than that for carbon. Thus, the range of chemical shift in 1H NMR is narrower than that of 13C NMR.
Solid State NMR
13C NMR spectra could also be recorded for solid samples. The peaks for solid samples are very broad because the sample, being solid, cannot have all anisotropic, or orientation-dependent, interactions canceled due to rapid random tumbling. However, it is still possible to do high resolution solid state NMR by spinning the sample at 54.74° with respect to the applied magnetic field, which is called the magic angle. In other words, the sample can be spun to artificially cancel the orientation-dependent interaction. In general, the spinning frequency has a considerable effect on the spectrum.
13C NMR of Carbon Nanotubes
Single-walled carbon nanotubes contain sp2 carbons. Derivatives of SWNTs contain sp3 carbons in addition. There are several factors that affect the 13C NMR spectrum of a SWNT sample, three of which will be reviewed in this module: 13C percentage, diameter of the nanotube, and functionalization.
13C Percentage
For sp2 carbons, there is a slight dependence of 13C NMR peaks on the percentage of 13C in the sample. Samples with lower 13C percentage are slighted shifted downfield (higher ppm). Data are shown in Table \(\PageIndex{4}\). Please note that these peaks are for the sp2 carbons.
| Sample | \(\delta \) (ppm) |
| SWNTs(100%) | 116±1 |
| SWNTs(1%) | 118±1 |
Diameter of the Nanotubes
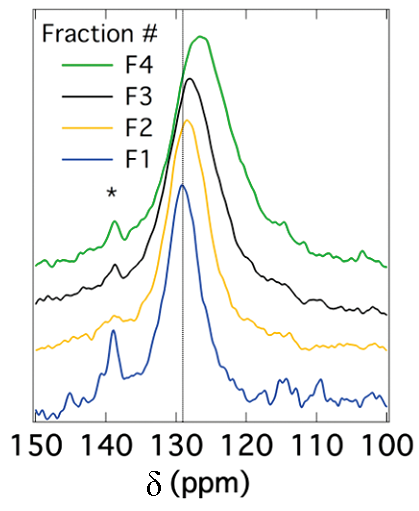
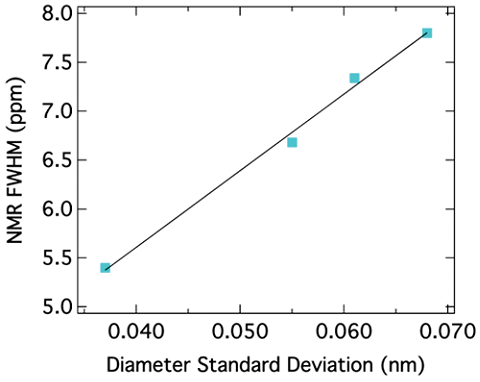
The peak position for SWNTs also depends on the diameter of the nanotubes. It has been reported that the chemical shift for sp2 carbons decreases as the diameter of the nanotubes increases. Figure \(\PageIndex{32}\) shows this correlation. Since the peak position depends on the diameter of nanotubes, the peak broadening can be related to the diameter distribution. In other words, the narrower the peak is, the smaller the diameter distribution of SWNTs is. This correlation is shown in Figure \(\PageIndex{33}\).
Functionalization
Solid stated 13C NMR can also be used to analyze functionalized nanotubes. As a result of functionalizing SWNTs with groups containing a carbonyl group, a slight shift toward higher fields (lower ppm) for the sp2carbons is observed. This shift is explained by the perturbation applied to the electronic structure of the whole nanotube as a result of the modifications on only a fraction of the nanotube. At the same time, a new peak emerges at around 172 ppm, which is assigned to the carboxyl group of the substituent. The peak intensities could also be used to quantify the level of functionalization. Figure \(\PageIndex{34}\) shows these changes, in which the substituents are –(CH2)3COOH, –(CH2)2COOH, and –(CH2)2CONH(CH2)2NH2 for the spectra Figure \(\PageIndex{34}\) b, Figure \(\PageIndex{34}\) c, and Figure \(\PageIndex{34}\) d, respectively. Note that the bond between the nanotube and the substituent is a C-C bond. Due to low sensitivity, the peak for the sp3 carbons of the nanotube, which does not have a high quantity, is not detected. There is a small peak around 35 ppm in Figure \(\PageIndex{34}\), can be assigned to the aliphatic carbons of the substituent.
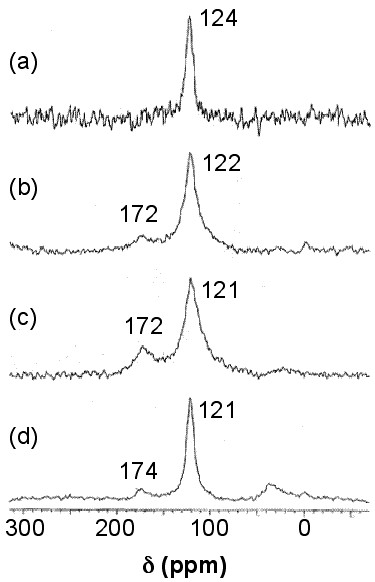
For substituents containing aliphatic carbons, a new peak around 35 ppm emerges, as was shown in Figure \(\PageIndex{34}\), which is due to the aliphatic carbons. Since the quantity for the substituent carbons is low, the peak cannot be detected. Small substituents on the sidewall of SWNTs can be chemically modified to contain more carbons, so the signal due to those carbons could be detected. This idea, as a strategy for enhancing the signal from the substituents, can be used to analyze certain types of sidewall modifications. For example, when Gly (–NH2CH2CO2H) was added to F-SWNTs (fluorinated SWNTs) to substitute the fluorine atoms, the 13C NMR spectrum for the Gly-SWNTs was showing one peak for the sp2 carbons. When the aliphatic substituent was changed to 6-aminohexanoic acid with five aliphatic carbons, the peak was detectable, and using 11-aminoundecanoic acid (ten aliphatic carbons) the peak intensity was in the order of the size of the peak for sp2 carbons. In order to use 13C NMR to enhance the substituent peak (for modification quantification purposes as an example), Gly-SWNTs was treated with 1-dodecanol to modify Gly to an amino ester. This modification resulted in enhancing the aliphatic carbon peak at around 30 ppm. Similar to the results in Figure \(\PageIndex{34}\), a peak at around 170 emerged which was assigned to the carbonyl carbon. The sp3 carbon of the SWNTs, which was attached to nitrogen, produced a small peak at around 80 ppm, which is detected in a cross-polarization magic angle spinning (CP-MAS) experiment.
F-SWNTs (fluorinated SWNTs) are reported to have a peak at around 90 ppm for the sp3 carbon of nanotube that is attached to the fluorine. The results of this part are summarized in Figure \(\PageIndex{34}\) (approximate values).
| Group | \(\delta \)(ppm) | Intensity |
| sp2 carbons of SWNTs | 120 | Strong |
| –NH2(CH2)nCO2H (aliphatic carbon, n=1,5, 10) | 20-40 | Depends on ‘n’ |
| –NH2(CH2)nCO2H (carboxyl carbon, n=1,5, 10) | 170 | Weak |
| sp3 carbon attached to nitrogen | 80 | Weak |
| sp3 carbon attached to fluorine | 90 | Weak |
The peak intensities that are weak in Figure \(\PageIndex{34}\) depend on the level of functionalization and for highly functionalized SWNTs, those peaks are not weak. The peak intensity for aliphatic carbons can be enhanced as the substituents get modified by attaching to other molecules with aliphatic carbons. Thus, the peak intensities can be used to quantify the level of functionalization.
13C NMR of Functionalized Graphene
Graphene is a single layer of sp2 carbons, which exhibits a benzene-like structure. Functionalization of graphene sheets results in converting some of the sp2 carbons to sp3. The peak for the sp2 carbons of graphene shows a peak at around 140 ppm. It has been reported that fluorinated graphene produces an sp3peak at around 82 ppm. It has also been reported for graphite oxide (GO), which contains –OH and epoxy substituents, to have peaks at around 60 and 70 ppm for the epoxy and the –OH substituents, respectively. There are chances for similar peaks to appear for graphene oxide. Table \(\PageIndex{6}\) summarizes these results.
| Type of Carbon | \(\delta \)(ppm) |
| sp2 | 140 |
| sp3 attached to fluorine | 80 |
| sp3 attached to -OH (for GO) | 70 |
| sp3 attached to epoxide (for GO) | 60 |
Analyzing Annealing Process Using 13C NMR
13C NMR spectroscopy has been used to study the effects of low-temperature annealing (at 650 °C) on thin films of amorphous carbon. The thin films were synthesized from a 13C enriched carbon source (99%). There were two peaks in the 13C NMR spectrum at about 69 and 142 ppm which were assigned to sp3 and sp2carbons, respectively Figure \(\PageIndex{35}\). The intensity of each peak was used to find the percentage of each type of hybridization in the whole sample, and the broadening of the peaks was used to estimate the distribution of different types of carbons in the sample. It was found that while the composition of the sample didn’t change during the annealing process (peak intensities didn’t change, see Figure \(\PageIndex{35}\)b), the full width at half maximum (FWHM) did change (Figure \(\PageIndex{35}\)a). The latter suggested that the structure became more ordered, i.e., the distribution of sp2 and sp3carbons within the sample became more homogeneous. Thus, it was concluded that the sample turned into a more homogenous one in terms of the distribution of carbons with different hybridization, while the fraction of sp2 and sp3 carbons remained unchanged.
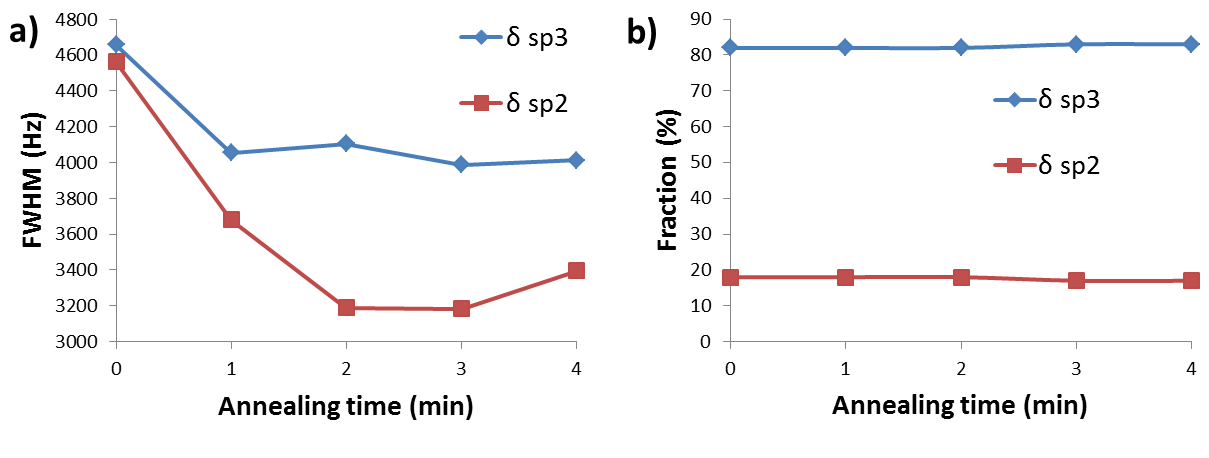
Aside from the reported results from the paper, it can be concluded that 13C NMR is a good technique to study annealing, and possibly other similar processes, in real time, if the kinetics of the process is slow enough. For these purposes, the peak intensity and FWHM can be used to find or estimate the fraction and distribution of each type of carbon respectively.
Summary
13C NMR can reveal important information about the structure of SWNTs and graphene. 13C NMR chemical shifts and FWHM can be used to estimate the diameter size and diameter distribution. Though there are some limitations, it can be used to contain some information about the substituent type, as well as be used to quantify the level of functionalization. Modifications on the substituent can result in enhancing the substituent signal. Similar type of information can be achieved for graphene. It can also be employed to track changes during annealing and possibly during other modifications with similar time scales. Due to low natural abundance of 13C it might be necessary to synthesize 13C-enhanced samples in order to obtain suitable spectra with a sufficient signal-to-noise ratio. Similar principles could be used to follow the annealing process of carbon nano materials. C60will not be discussed herein.
Lanthanide Shift Reagents
Nuclear magnetic resonance spectroscopy (NMR) is the most powerful tool for organic and organometallic compound determination. Even structures can be determined just using this technique. In general NMR gives information about the number of magnetically distinct atoms of the specific nuclei under study, as well as information regarding the nature of the immediate environment surrounding each nuclei. Because hydrogen and carbon are the major components of organic and organometallic compounds, proton (1H) NMR and carbon-13 (13C) NMR are the most useful nuclei to observe.
Not all the protons experience resonance at the same frequency in a 1H NMR, and thus it is possible to differentiate between them. The diversity is due to the existence of a different electronic environment around chemically different nuclei. Under an external magnetic field (B0), the electrons in the valence shell are affected; they start to circulate generating a magnetic field, which is apposite to the applied magnetic field. This effect is called diamagnetic shielding or diamagnetic anisotropy Figure \(\PageIndex{36}\).
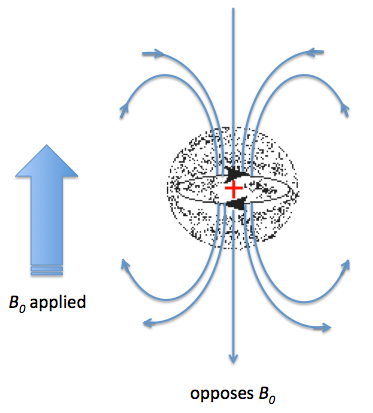
The greater the electron density around one specific nucleus, the greater will be the induced field that opposes the applied field, and this will result in a different resonance frequency. The identification of protons sounds simple, however, the NMR technique has a relatively low sensitivity of proton chemical shifts to changes in the chemical and stereochemical environment; as a consequence the resonance of chemically similar proton overlap. There are several methods that have been used to resolve this problem, such as: the use of higher frequency spectrometers or by the use of shift reagents as aromatic solvents or lanthanide complexes. The main issue with high frequency spectrometers is that they are very expensive, which reduces the number of institutions that can have access to them. In contrast, shift reagents work by reducing the equivalence of nuclei by altering their magnetic environment, and can be used on any NMR instrument. The simplest shift reagent is the one of different solvents, however problems with some solvents is that they can react with the compound under study, and also that these solvents usually just alter the magnetic environment of a small part of the molecule. Consequently, although there are several methods, most of the work has been done with lanthanide complexes.
The History of Lanthanide Shift Reagents
The first significant induced chemical shift using paramagnetic ions was reported in 1969 by Conrad Hinckley (Figure \(\PageIndex{37}\)), where he used bispyridine adduct of tris(2,2,6,6-tetramethylhepta-3,5-dionato)europium(III) (Eu(tmhd)3), better known as Eu(dpm)3, where dpm is the abbreviation of dipivaloyl- methanato, the chemical structure is shown in Figure \(\PageIndex{38}\). Hinckley used Eu(tmhd)3 on the 1H NMR spectrum of cholesterol from 347 – 2 Hz. The development of this new chemical method to improve the resolution of the NMR spectrum was the stepping-stone for the work of Jeremy Sanders and Dudley Williams, Figure \(\PageIndex{39}\) and Figure \(\PageIndex{40}\) respectively. They observed a significant increase in the magnitude of the induced shift after using just the lanthanide chelate without the pyridine complex. Sugesting that the pyridine donor ligands are in competition for the active sides of the lanthanide complex. The efficiency of Eu(tmhd)3 as a shift reagent was published by Sanders and Williams in 1970, where they showed a significant difference in the 1H NMR spectrum of n-pentanol using the shift reagent, see Figure \(\PageIndex{41}\).



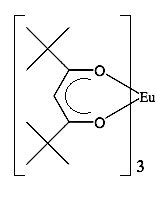
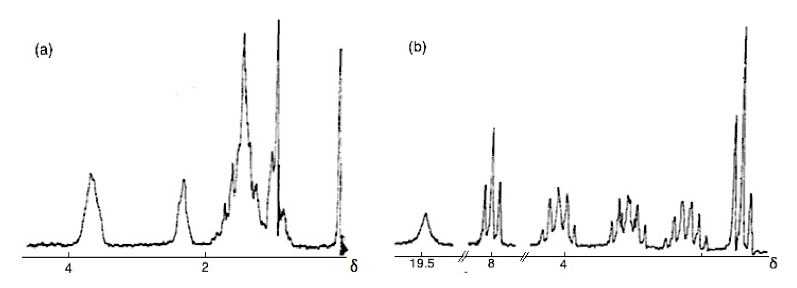
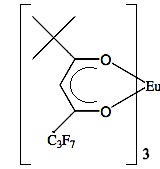
Analyzing the spectra in Figure \(\PageIndex{41}\) it is easy to see that with the use of Eu(tmhd)3 there is any overlap between peaks. Instead, the multiplets of each proton are perfectly clear. After these two publications the potential of lanthanide as shift reagents for NMR studies became a popular topic. Other example is the fluorinate version of Eu(dpm)3; (tris(7,7,-dimethyl-1,1,2,2,2,3,3-heptafluoroocta-7,7-dimethyl-4,6-dionato)europium(III), best known as Eu(fod)3, which was synthesized in 1971 by Rondeau and Sievers. This LSR presents better solubility and greater Lewis acid character, the chemical structure is show in Figure \(\PageIndex{42}\).
Mechanism of Inducement of Chemical Shift
Lanthanide atoms are Lewis acids, and because of that, they have the ability to cause chemical shift by the interaction with the basic sites in the molecules. Lanthanide metals are especially effective over other metals because there is a significant delocalization of the unpaired f electrons onto the substrate as a consequence of unpaired electrons in the f shell of the lanthanide. The lanthanide metal in the complexes interacts with the relatively basic lone pair of electrons of aldehydes, alcohols, ketones, amines and other functional groups within the molecule that have a relative basic lone pair of electrons, resulting in a NMR spectral simplification.
There are two possible mechanisms by which a shift can occur: shifts by contact and shifts by pseudocontact. The first one is a result of the transfer of electron spin density via covalent bond formation from the lanthanide metal ion to the associated nuclei. While the magnetic effects of the unpaired electron magnetic moment causes the pseudocontact shift. Lanthanide complexes give shifts primarily by the pseudocontact mechanism. Under this mechanism, there are several factors that influence the shift of a specific NMR peak. The principal factor is the distance between the metal ion and the proton; the shorter the distance, the greater the shift obtained. On the other hand, the direction of the shift depends on the lanthanide complex used. The complexes that produce a shift to a lower field (downfield) are the ones containing erbium, europium, thulium and ytterbium, while complexes with cerium, neodymium, holmium, praseodymium, samarium and terbium, shift resonances to higher field. Figure 6 shows the difference betwen an NMR spectrum without the use of shift reagent versus the same spectrum in the present of a europium complex (downfield shift) and a praseodymium complex (high-field shift).
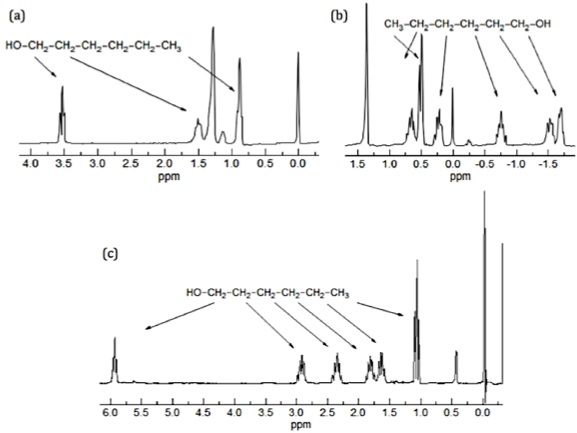
Linewidth broadening is not desired because of loss of resolution, and lanthanide complexes unfortunately contribute extremely to this effect when they are used in high concentrations due to their mechanism that shortens the relaxation times (T2), which in turn increases the bandwidth. However europium and praseodymium are an extraordinary exception giving a very low shift broadening, 0.003 and 0.005 Hz/Hz respectively. Europium specially is the most used lanthanide as shift reagent because of its inefficient nuclear spin-lattice ratio properties. It has low angular momentum quantum numbers and a diamagnetic 7F0 ground state. These two properties contribute to a very small separation of the highest and lowest occupied metal orbitals leading to an inefficient relaxation and a very little broadening in the NMR spectra. The excited 7F1 state will then contribute to the pseudocontact shift.
We have mentioned above that lanthanide complexes have a mechanism that influences relaxation times, and this is certainly because paramagnetic ions have an influence in both: chemical shifts and relaxation rates. The relaxation times are of great significant because they depend on the width of a specific resonance (peak). Changes in relaxation time could also be related with the geometry of the complex.
Measuring the Shift
The easiest and more practical way to measure the lanthanide-induced shift (LIS) is to add aliquots of the lanthanide shift reagent (LSR or Δvi) to the sample that has the compound of interest (substrate), and take an NMR spectra after each addition. Because the shift of each proton will change after each addition of the LSR to lower or upper field, the LIS can me measured. With the data collected, a plot of the LIS against the ratio of LSR: substrate will generate a straight line where the slope is representative of the compound that is being studied. The identification of the compound by the use of chiral lanthanide shift reagents can be so precise that it is possible to estimate the composition of enantiomers in the solution under study, see Figure \(\PageIndex{44}\).
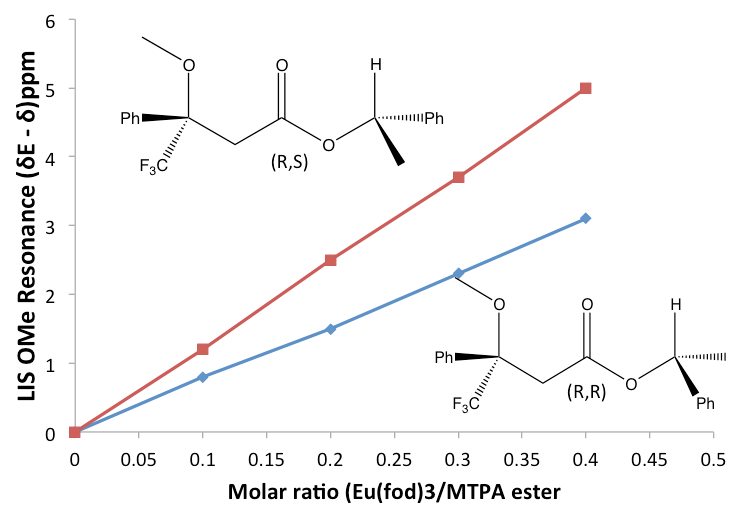
Now, what is the mechanism that is actually happening between the LSR and the compound under study? The LSR is a metal complex of six coordinate sides. The LSR, in presence of substrate that contains heteroatoms with Lewis basicity character, expands its coordination sides in solution in order to accept additional ligands. An equilibrium mixture is formed between the substrate and the LSR. \ref{11} and \ref{12} show the equilibrium, where L is LSR, S is the substrate, and LS is the concentration of the complex formed is solution.
\[ L\ +\ S \mathrel{\mathop{\rightleftarrows}^{\mathrm{K_{1}}}} \ [LS] \label{11} \]
\[ [LS] \ +\ S \mathrel{\mathop{\rightleftarrows}^{\mathrm{K_{2}}}} [LS_{2}] \label{12} \]
The abundance of these species depends on K1 and K2, which are the binding constant. The binding constant is a special case of equilibrium constant, but it refers with the binding and unbinding mechanism of two species. In most of the cases like, K2 is assumed to be negligible and therefore just the first complex [LS] is assumed to be formed. The equilibrium between L + S and LS in solution is faster than the NMR timescale, consequently a single average signal will be recorded for each nucleus.
Determination of Enantiomeric Purity
Besides the great potential of lanthanide shift reagents to improve the resolution of NMR spectrums, these complexes also have been used to identify enantiomeric mixtures in solution. To make this possible the substrate must meet certain properties. The fist one is that the organic compounds in the enantiomeric composition must to have a hard organic base as functional group. The shift reagents are not effective with most of the soft bases. Though hundreds of chelates have been synthesized after Eu(dcm)3, this one is the LSR that resulted in the most effective reagent for the resolution of enantiotopic resonances. Basically if you take an NMR of an enantiomeric mixture sample, a big variety of peaks will appear and the hard part is to identify which of those peaks correspond to which specific enantiomer. The differences in chemical shifts observed for enantiomeric mixtures in solution containing LSR might arise from at least two sources: the equilibrium constants of the formation of the possible diastereometic complexes between the substrate and the LSR, and the geometries of these complexes, which might be distinct. The enantiomeric shift differences sometimes are defined as ΔΔδ.
In solution the exchange between substrate coordinated to the europium ion and the free substrate in solution is very fast. To be sure that the europium complexes are binding with one or two substrate molecules, an excess of substrate is usually added.
Determination of Relaxation Parameters of Contrast Agents
Magnetic resonance imaging (MRI) (also known as nuclear magnetic resonance imaging (NMRI) or magnetic resonance tomography (MRT)) is a powerful noninvasive diagnostic technique, which is used to generate magnetic field (B0) and interacts with spin angular momentum of the nucleus in the tissue. Spin angular momentum depends on number of protons and neutrons of nucleus. Nuclei with even number of protons plus neutrons are insensitive to magnetic field, so cannot be viewed by MRI.
Each nucleus can be considered as an arrow with arbitrary direction in absence of external magnetic field (Figure \(\PageIndex{46}\)). And we consider them to get oriented in the same direction once magnetic field applied (Figure \(\PageIndex{47}\)). In order to get nuclei orient in specific direction, energy is supplied, and to bring it to original position energy is emitted. All this transitions eventually lead to changes in angular velocity, which is defined as Larmor frequency and the expression \ref{13}, where ω is the Larmor frequency, γ is the gyromagnetic ratio, and B0 is the magnetic field. It is not easy to detect energy, which is involved in such a transition, that’s why use of high resolution spectrometers required, those which are developed by nowadays as a most powerful MRI are close to 9 Tesla with mass approaching forty five tons. Unfortunately it is expensive tool to purchase and to operate. That’s why new techniques should be developed, so most of the MRI spectrometers can be involved in imaging. Fortunately presence of huge amount of nuclei in analyzed sample or body can provide with some information.
\[ \omega \ =\ \gamma B_{0} \label{13} \]
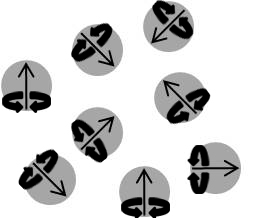
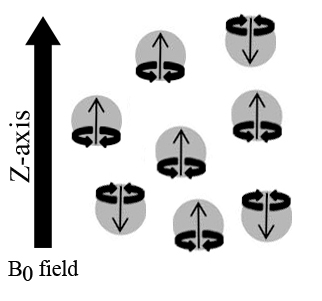
Nuclear Magnetic Resonance Relaxometer
Each nucleus possesses microscopic magnetic spins of x, y and z. Presence of randomly distributed atoms with varying x and y spins will lead to zero upon summation of x and y planes. But in case of z, summation of magnetic spins will not lead to cancellation. According to Currie’s law, \ref{14}, (Mzis the resulting magnetization of z axis, C is a material specific Curie constant, B0 is the magnetic field, and T is absolute temperature), magnetization of z axis proportional to magnetic field applied from outside. Basically, excitation happens by passing current through coil which leads to magnetization of x, y and z axis. It is the way of changing magnetism from z axis to x and y axis. Once external current supply is turned off, magnetization will eventually quench. This means a change of magnetization from x and y axis to z axis, were it eventually become equilibrated and device no more can detect the signals. Energy which is emitted from excited spin leads to development of new current inside of the same coil recorded by detector; hence same coil can be used as detector and source of magnetic field. This process called as a relaxation and that's why, return of magnetization to z axis called as spin-lattice relaxation or T1 relaxation (time required for magnetization to align on z axis). Eventual result of zero magnetization on x and y axis called as spin-spin relaxation or T2 relaxation (Figure \(\PageIndex{48}\)).
\[ M_{z}\ =\ CB_{0}/T \label{14} \]
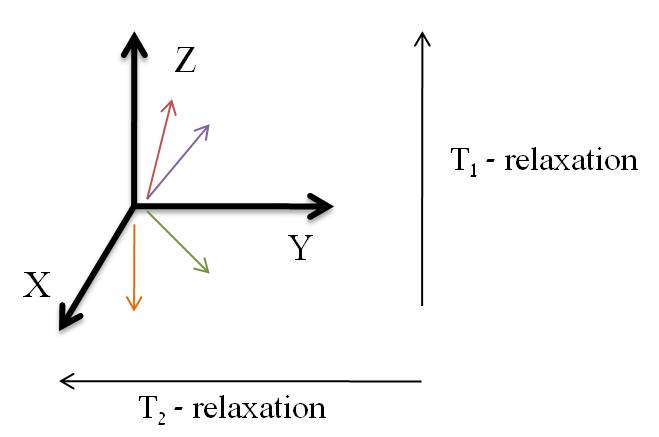
Contrast Agents for MRI
In MRI imaging contrast is determined according to T1, T2 or the proton density parameter. Therefor we can obtain three different images. By changing intervals between radio frequency (RF) 90° pulses and RF 180° pulses, the desired type of image can be obtained. There are few computational techniques available to improve contrast of image; those are repetitive scans and different mathematical computations. Repetitive scans take a long time, therefore cannot be applied in MRI. Mathematical computation on their own, do not provide with desired results. For that reason, in order to obtain high resolution images, contrast agents (CA) are important part of medical imaging.
Types of Contrast Agents
There are different types of contrast agents available in markets which reduce the supremacy of T1or T2, and differentiate according to relaxivity1 (r1) and relaxivity2 (r2) values. The relaxivity (ri) can be described as 1/Ti (s-1) of water molecules per mM concentration of CA. Contrast agents are paramagnetic and can interact with dipole moments of water molecules, causing fluctuations in molecules. This theory is known as Solomon-Bloembergen-Morgan (SBM) theory. Those which are efficient were derivatives of gadolinium (e.g., gadobenic acid (Figure \(\PageIndex{49}\) a) and gadoxetic acid (Figure \(\PageIndex{49}\) b), iron (e.g., superparamagnetic iron oxide and ultrasmall superparamagnetic iron oxide) and manganese (e.g., manganese dipyridoxal diphosphate). Fundamentally the role of contrast agents can be played by any paramagnetic species.
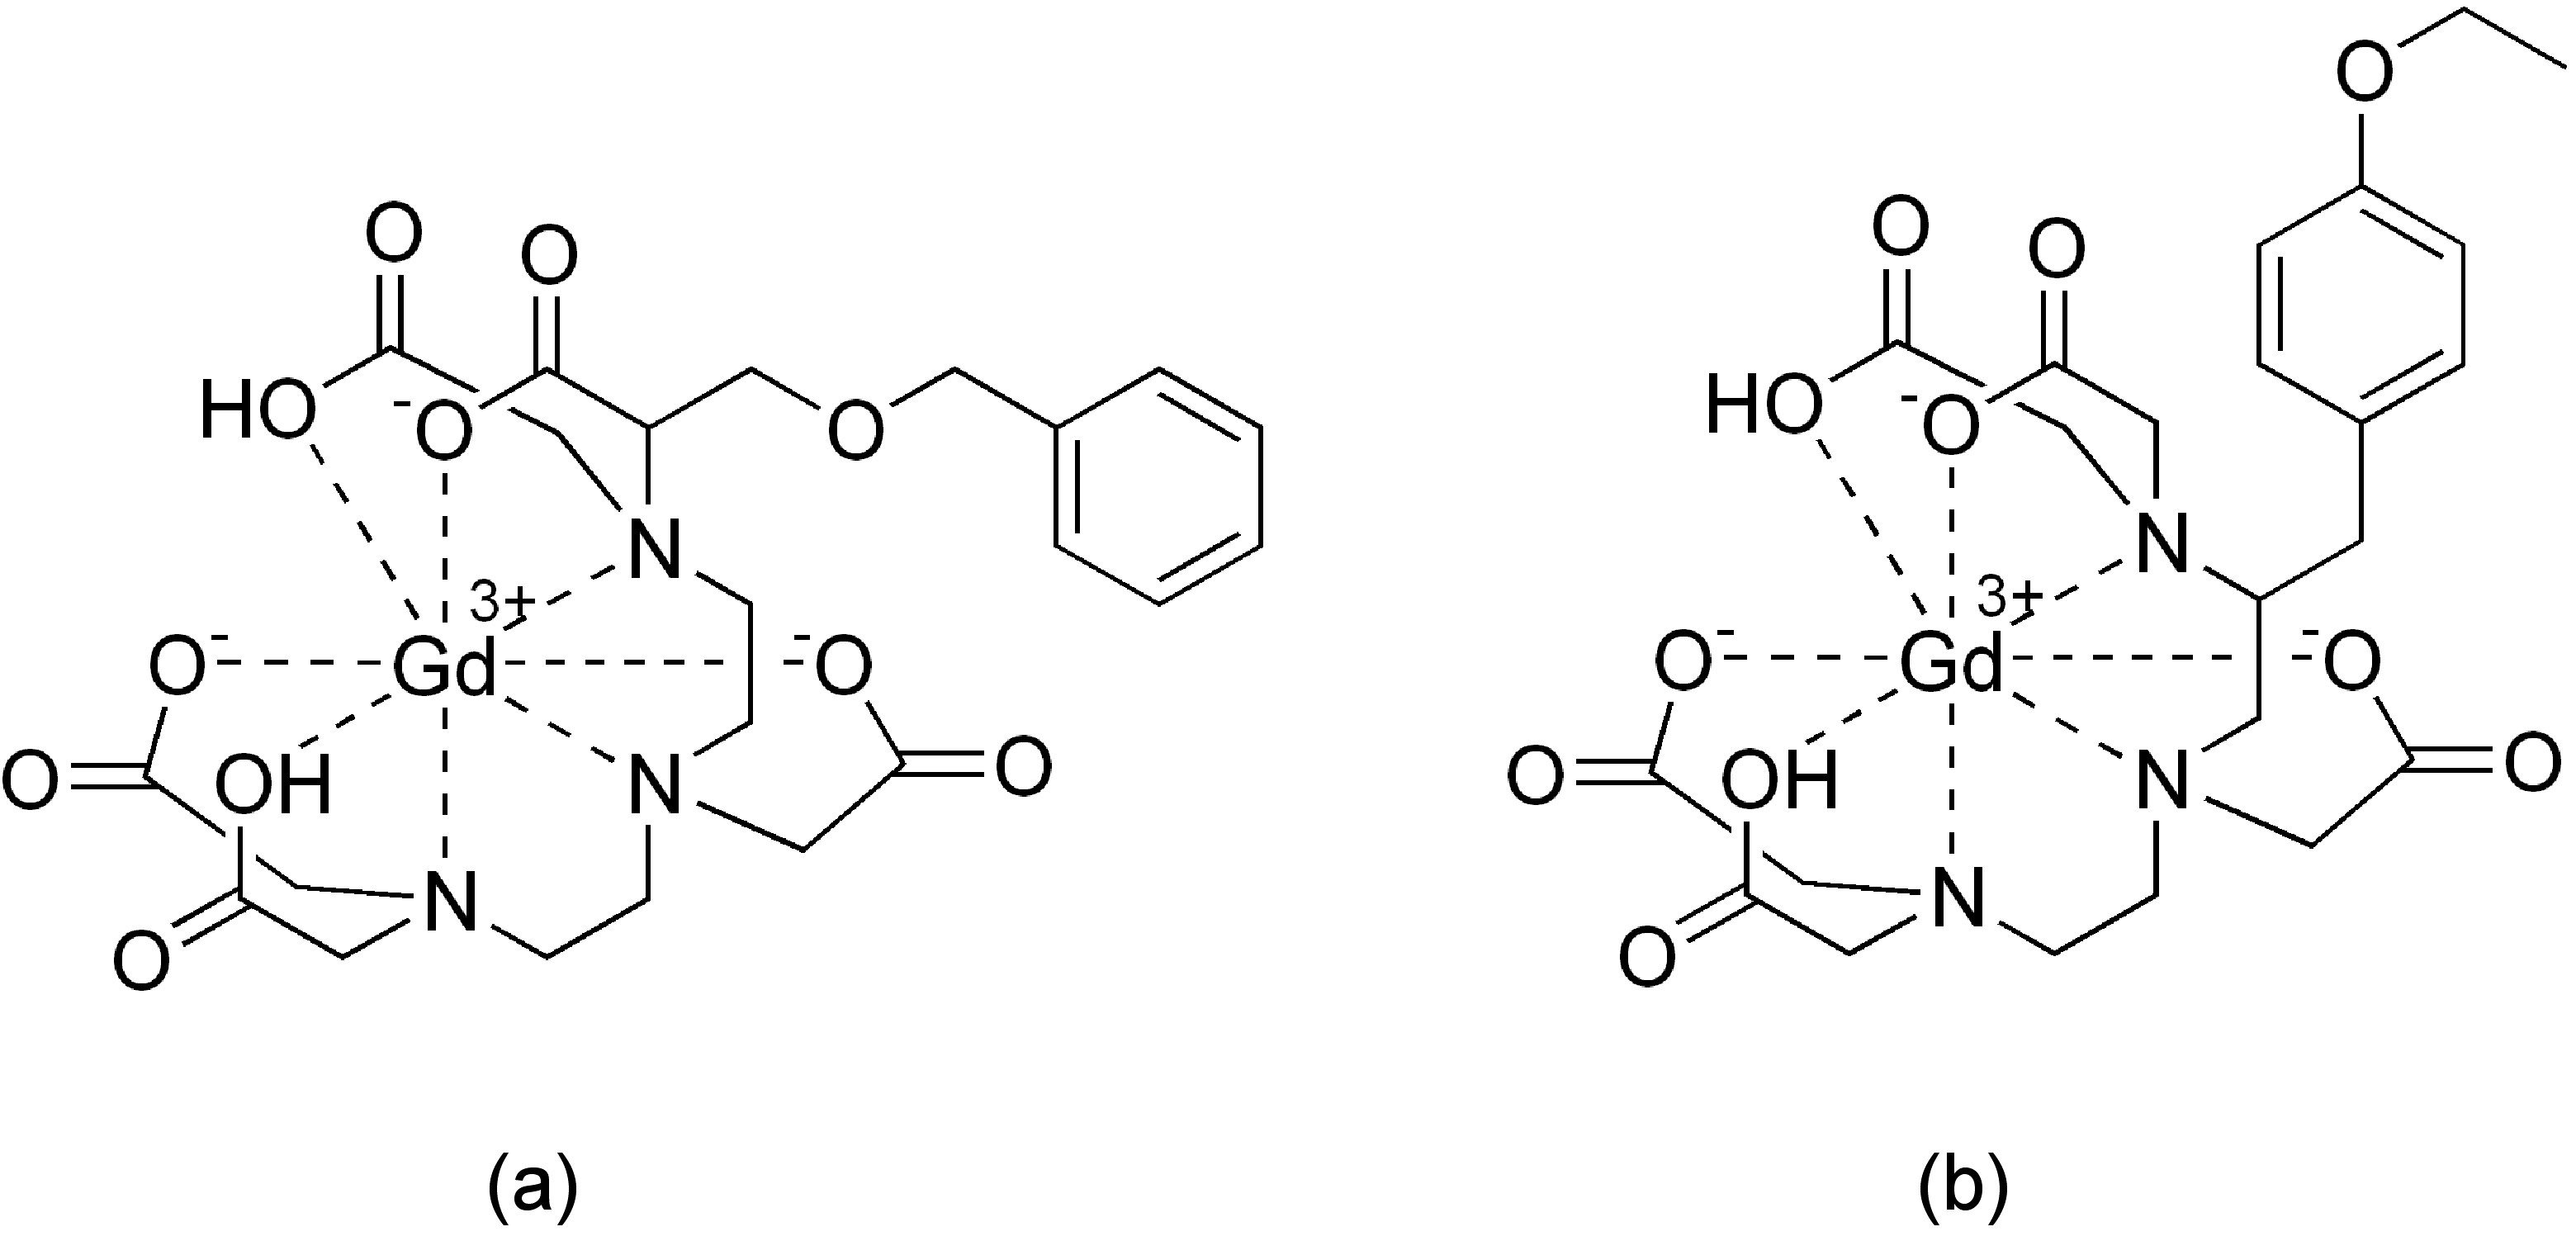
Principal of Interactions of CA with Surrounding Media
There are two main principles of interactions of contrast agents with water molecules. One is direct interaction, which is called inner sphere relaxation, and the other mechanism that happens in the absence of direct interaction with water molecule which is outer sphere relaxation. If we have water molecules in the first coordination sphere of metal ion, we can consider them as the inner sphere, and if diffusion of protons from outside happens randomly we define them as outer sphere relaxation. Another type of relaxivity comes from already affected water molecules, which transfers their relaxivity to protons of close proximity, this type of relaxivity called second sphere and is usually neglected or contributed as outer sphere. In inner sphere proton relaxivity there are two main mechanisms involved in relaxation. One is dipole-dipole interactions between metal and proton and another is scalar mechanism. Dipole-dipole interaction affects electron spin vectors and scalar mechanism usually controls water exchange. Effect of contrast agents on T1 relaxation is much larger than on T2, since T1 is much larger for tissues than T2.
Determination of Relaxivity
Determination of relaxivity became very easy with the advancements of NMR and computer technology, where you need just to load your sample and read values from the screen. But let’s consider in more detail what are the precautions should be taken during sample preparation and data acquisition.
Sample Preparation
The sample to be analyzed is dissolved in water or another solvent. Generally water is used since contrast agents for medical MRI are used in aqueous media. The amount of solution used is determined according to the internal standard volume, which is used for calibration purposes of device and is usually provided by company producing device. A suitable sample holder is a NMR tube. It is important to degas solvent prior measurements by bubbling gas through it (nitrogen or argon works well), so no any traces of oxygen remains in solution, since oxygen is paramagnetic.
Data Acquisition
Before collecting data it is better to keep the sample in the device compartment for few minutes, so temperature of magnet and your solution equilibrates. The relaxivity (ri) calculated according to (\ref{15} ), where Ti is the relaxation time in the presence of CAs, Tid is the relaxation time in the absence of CAs, and CA is the concentration of paramagnetic CAs (mM). Having the relaxivity values allows for a comparison of a particular compound to other known contrast agents.
\[ r_{i} \ =\ (1/T_{i} \ -\ 1/T_{id})/[CA] \label{15} \]
Two-Dimensional NMR
General Principles of Two-Dimensional Nuclear Magnetic Resonance Spectroscopy
History
Jean Jeener (Figure \(\PageIndex{50}\) from the Université Libre de Bruxelles first proposed 2D NMR in 1971. In 1975 Walter P. Aue, Enrico Bartholdi, and Richard R. Ernst (Figure \(\PageIndex{51}\) first used Jeener’s ideas of 2D NMR to produce 2D spectra, which they published in their paper “Two-dimensional spectroscopy, application to nuclear magnetic resonance”. Since this first publication, 2D NMR has increasing been utilized for structure determination and elucidation of natural products, protein structure, polymers, and inorganic compounds. With the improvement of computer hardware and stronger magnets, newly developed 2D NMR techniques can easily become routine procedures. In 1991 Richard R. Ernst won the Nobel Prize in Chemistry for his contributions to Fourier Transform NMR. Looking back on the development of NMR techniques, it is amazing that 2D NMR took so long to be developed considering the large number of similarities that it has with the simpler 1D experiments.


Why do We Need 2D NMR?
2D NMR was developed in order to address two major issues with 1D NMR. The first issue is the limited scope of a 1D spectrum. A 2D NMR spectrum can be used to resolve peaks in a 1D spectrum and remove any overlap present. With a 1D spectrum, this is typically performed using an NMR with higher field strength, but there is a limit to the resolution of peaks that can be obtained. This is especially important for large molecules that result in numerous peaks as well as for molecules that have similar structural motifs in the same molecule. The second major issue addressed is the need for more information. This could include structural or stereochemical information. Usually to overcome this problem, 1D NMR spectra are obtained studying specific nuclei present in the molecule (for example, this could include fluorine or phosphorus). Of course this task is limited to only nuclei that have active spin states/spin states other than zero and it requires the use of specialized NMR probes.
2D NMR can address both of these issues in several different ways. The following four techniques are just few of the methods that can be used for this task. The use of J-resolved spectroscopy is used to resolve highly overlapping resonances, usually seen as complex multiplicative splitting patterns. Homonuclear correlation spectroscopy can identify spin-coupled pairs of nuclei that overlap in 1D spectra. Heteronuclear shift-correlation spectroscopy can identify all directly bonded carbon-proton pairs, or other combinations of nuclei pairs. Lastly, Nuclear Overhauser Effect (NOE) interactions can be used to obtain information about through-space interactions (rather than through-bond). This technique is often used to determine stereochemistry or protein/peptide interactions.
One-dimensional vs. Two-dimensional NMR
Similarities
The concept of 2D NMR can be considered as an extension of the concept of 1D NMR. As such there are many similarities between the two. Since the acquisition of a 2D spectrum is almost always preceded by the acquisition of a 1D spectrum, the standard used for reference Since 2D NMR is a more complicated experiment than 1D NMR, there are also some differences between the two. One of the differences is in the complexity of the data obtained. A 2D spectrum often results from a change in pulse time; therefore, it is important to set up the experiment correctly in order to obtain meaningful information. Another difference arises from the fact that one spectrum is 1D while the other is 2D. As such interpreting a 2D spectrum requires a much greater understanding of the experiment parameters. For example, one 2D experiment might investigate the specific coupling of two protons or carbons, rather than focusing on the molecule as a whole (which is generally the target of a 1D experiment). The specific pulse sequence used is often very helpful in interpreting the information obtained. The software used for 1D spectra is not always compatible with 2D spectra. This is due to the fact that a 2D spectrum requires more complex processing, and the 2D spectra generated often look quite different than 1D spectra. Some software that is commonly used to interpret 2D spectra is either Sparky or Bruker’s TopSpin. Lastly the NMR instrument used to obtain a 2D spectrum typically generates a much larger magnetic field (700-1000 MHz). Due to the increased cost of buying and maintaining such an instrument, 2D NMR is usually reserved for rather complex molecules.(TMS) and the solvent used (typically CDCl3 or other deuterated solvent) are the same for both experiments. Furthermore, 2D NMR is most often used to reveal any obscurity in a 1D spectrum (whether that is peak overlap, splitting overlap, or something else), so the nuclei studied are the same. Most often these are 1H and 13C, but other nuclei could also be studied.
Differences
Since 2D NMR is a more complicated experiment than 1D NMR, there are also some differences between the two. One of the differences is in the complexity of the data obtained. A 2D spectrum often results from a change in pulse time; therefore, it is important to set up the experiment correctly in order to obtain meaningful information. Another difference arises from the fact that one spectrum is 1D while the other is 2D. As such interpreting a 2D spectrum requires a much greater understanding of the experiment parameters. For example, one 2D experiment might investigate the specific coupling of two protons or carbons, rather than focusing on the molecule as a whole (which is generally the target of a 1D experiment). The specific pulse sequence used is often very helpful in interpreting the information obtained. The software used for 1D spectra is not always compatible with 2D spectra. This is due to the fact that a 2D spectrum requires more complex processing, and the 2D spectra generated often look quite different than 1D spectra. Some software that is commonly used to interpret 2D spectra is either Sparky or Bruker’s TopSpin. Lastly the NMR instrument used to obtain a 2D spectrum typically generates a much larger magnetic field (700-1000 MHz). Due to the increased cost of buying and maintaining such an instrument, 2D NMR is usually reserved for rather complex molecules.
The Rotating Frame and Fourier Transform
One of the central ideas that is associated with 2D NMR is the rotating frame, because it helps to visualize the changes that take place in dimensions. Our ordinary “laboratory” frame consists of three axes (the Cartesian x, y, and z). This frame can be visualized if one pictures the corner of a room. The intersections of the floor and the walls are the x and the y dimensions, while the intersection of the walls is the z axis. This is usually considered the “fixed frame.” When an NMR experiment is carried out, the frame still consists of the Cartesian coordinate system, but the x and ycoordinates rotate around the z axis. The speed with which the x-y coordinate system rotates is directly dependent on the frequency of the NMR instrument.
When any NMR experiment is carried out, a majority of the spin states of the nucleus of interest line up with one of these three coordinates (which we can pick to be z). Once an equilibrium of this alignment is achieved, a magnetic pulse can be exerted at a certain angle to the z axis (usually 90° or 180°) which temporarily disrupts the equilibrium alignment of the nuclei. As the pulse is removed, the nuclei are allowed to relax back to this equilibrium alignment with the magnetic field of the instrument. When this relaxation takes place, the progression of the nuclei back to the equilibrium orientation is detected by a computer as a free induction decay (FID). When a sample has different nuclei or the same nucleus in different environments, different FID can be recorded for each individual relaxation to the equilibrium position. The FIDs of all of the individual nuclei can be recorded and superimposed. The complex FID signal obtained can be converted to a recording of the NMR spectrum obtained by a Fourier transform(FT). The FT is a complex mathematical concept that can be described by \ref{16}, where ω is the angular frequency.
\[ z(t)\ =\ \sum^{\infty }_{k \rightarrow \infty} c_{i}e^{ik\omega t} \label{16} \]
This concept of the FT is similar for both 1D and 2D NMR. In 2D NMR a FID is obtained in one dimension first, then through the application of a pulse a FID can be obtained in a second dimension. Both FIDs can be converted to a series of NMR spectra through a Fourier transform, resulting in a spectrum that can be interpreted. The coupling of the two FID's in 2D NMR usually reveals a lot more information about the specific connectivity between two atoms.
Four Phases and Pulse Sequence of 2D NMR
There are four general stages or time periods that are present for any 2D NMR experiment. These are preparation, evolution, mixing, and detection. A general schematic representation is seen in Figure \(\PageIndex{53}\). The preparation period defines the system at the first time phase. The evolution period allows the nuclei to precess (or move relative to the magnetic field). The mixing period introduces a change in the way the spectra is obtained. The detection period records the FID. In obtaining a spectrum, the pulse sequence is the most important factor that determines what data will be obtained. In general 2D experiments are a combination of 1D experiments collected by varying the timing and pulsing.

Preparation
This is the first step in any 2D NMR experiment. It is a way to start all experiments from the same state. This state is typically either thermal equilibrium, obeying Boltzmann statistics, or it could be a state where the spins of one nucleus are randomized in orientation and the spins of another nucleus are in thermal equilibrium. At the end of the preparation period, the magnetizations are usually placed perpendicular, or at a specific angle, to the magnetic field axis. This phase creates magnetizations in the x-y plane.
Evolution
The nuclei are then allowed to precess around the direction of the magnetic field. This concept is very similar to the precession of a top in the gravitational field of the Earth. In this phase of the experiment, the rates at which different nuclei precess, as shown in Figure \(\PageIndex{54}\) determine how the nuclei are reacting based on their environment. The magnetizations that are created at the end of the preparation step are allowed to evolve or change for a certain amount of time (t1) in the environment defined by the magnetic and radio frequency (RF) fields. In this phase, the chemical shifts of the nuclei are measured similarly to a 1D experiment, by letting the nucleus magnetization rotate in the x-y plane. This experiment is carried out a large number of times, and then the recorded FID is used to determine the chemical shifts.
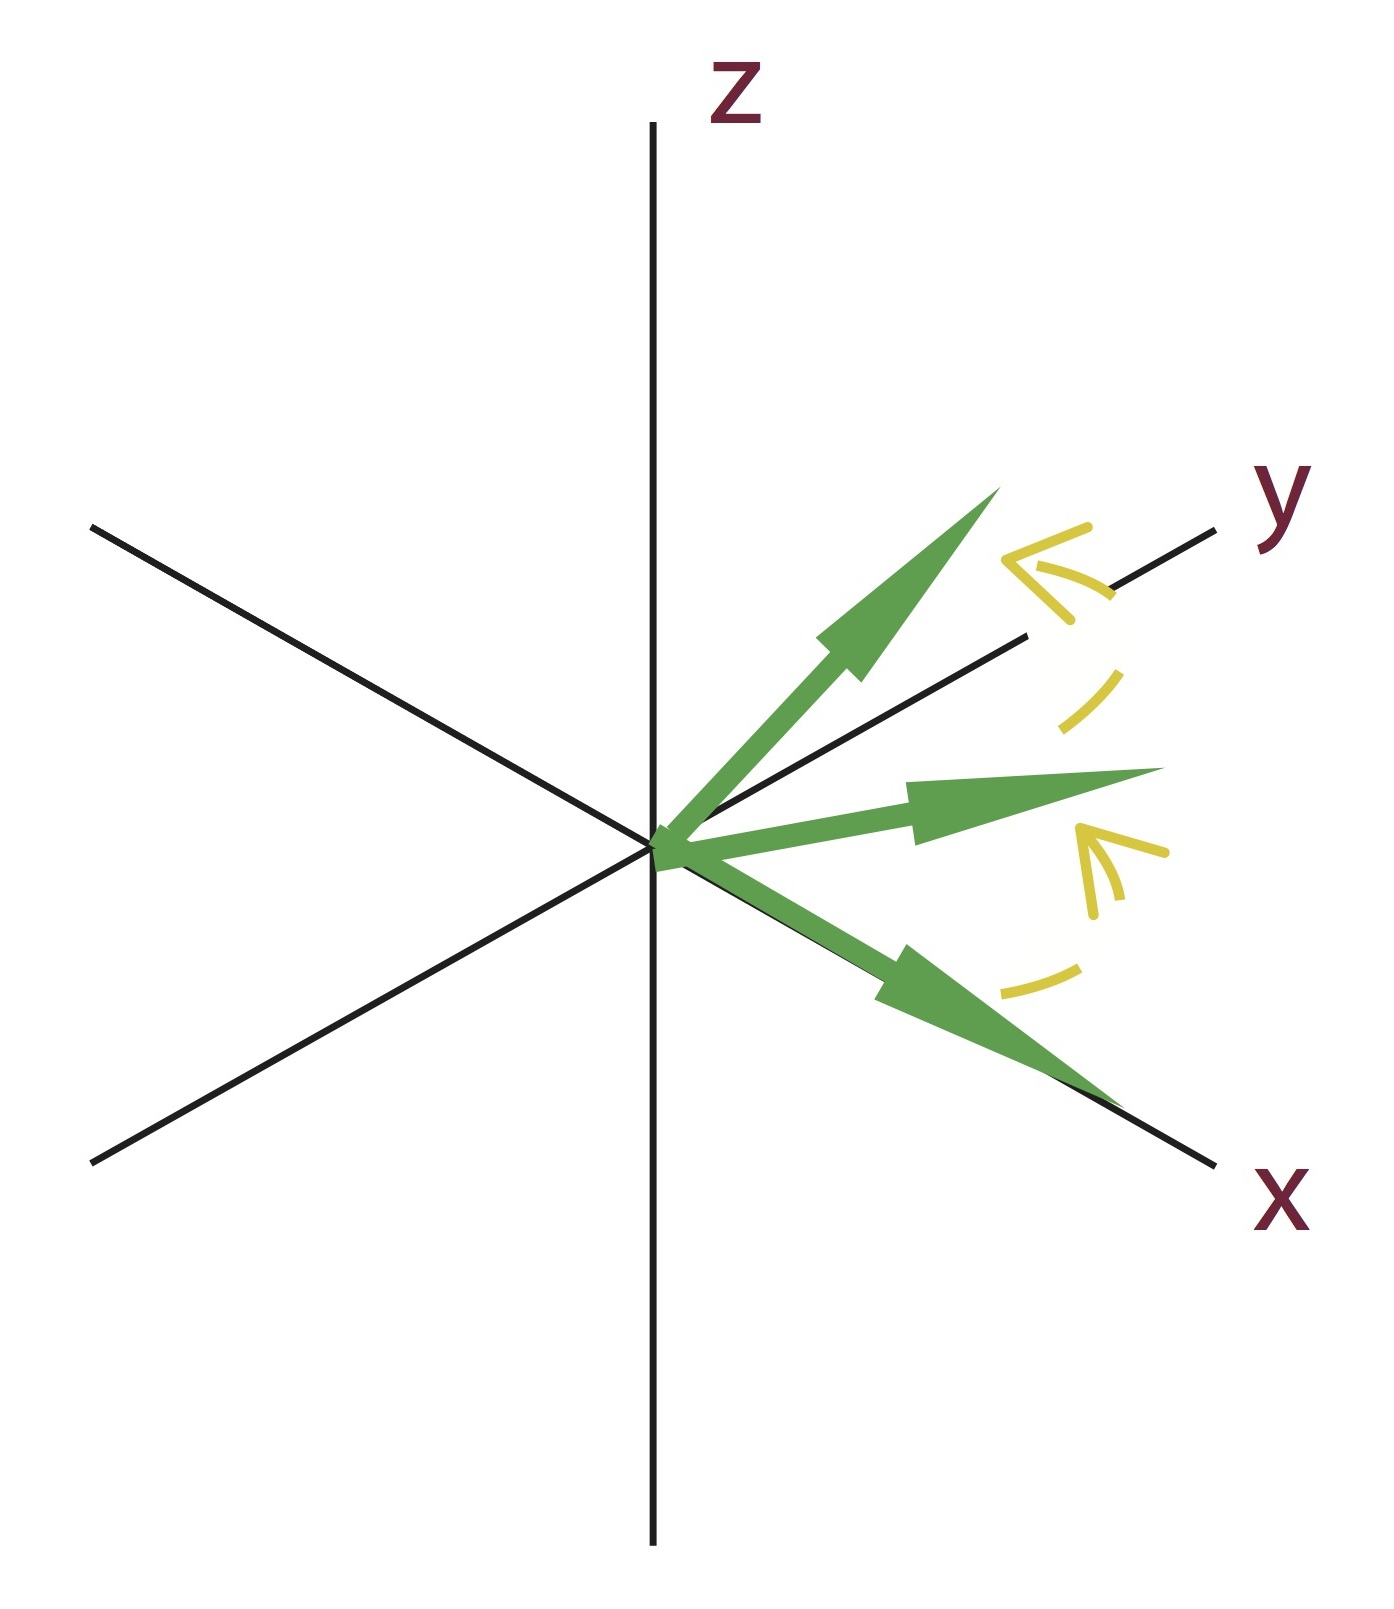
Mixing
Once the evolution period is over, the nuclear magnetization is distributed among the spins. The spins are allowed to communicate for a fixed period of time. This typically occurs using either magnetic pulses and/or variation in the time periods. The magnetic pulses typically consist of a change in the rotating frame of reference relative to the original "fixed frame" that was introduced in the preparation period, as seen in Figure \(\PageIndex{55}\). Experiments that only use time periods are often tailored to look at the effect of the RF field intensity. Using either the bonds connecting the different nuclei (J-coupling) or using the small space between them (NOE interaction), the magnetization is allowed to move from one nucleus to another. Depending on the exact experiment performed, these changes in magnetizations are going to differ based on what information is desired. This is the step in the experiment that determines exactly what new information would be obtained by the experiment. Depending on which chemical interactions require suppression and which need to be intensified to reveal new information, the specific "mixing technique" can be adjusted for the experiment.
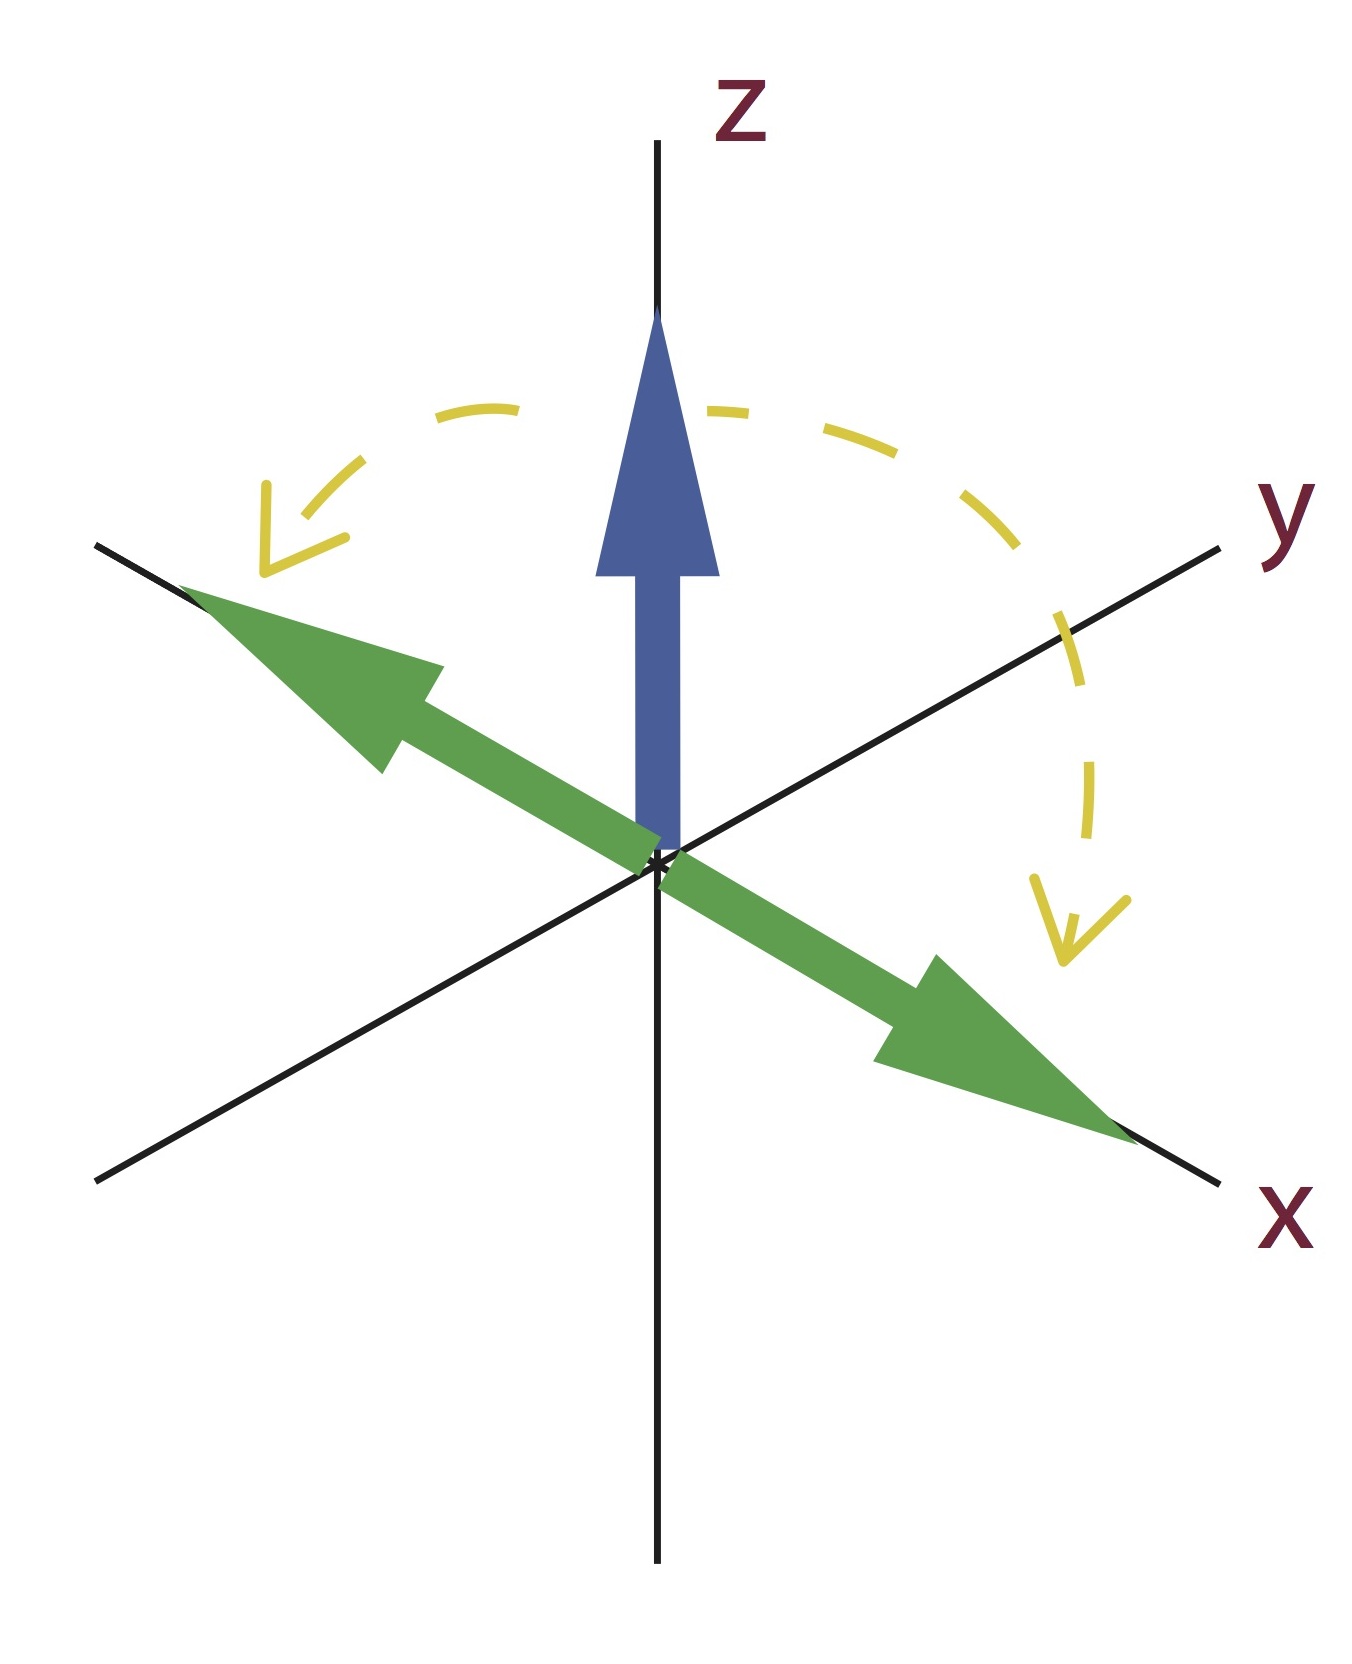
Detection
This is always the last period of the experiment, and it is the recording of the FID of the second nucleus studied. This phase records the second acquisition time (t2) resulting in a spectrum, similar to the first spectrum, but typically with differences in intensity and phase. These differences can give us information about the exact chemical and magnetic environment of the nuclei that are present. The two different Fourier transforms are used to generate the 2D spectrum, which consists of two frequency dimensions. These two frequencies are independent of each other, but when plotted on a single spectrum the frequency of the signal obtained in time t1 has been converted in another coherence affected by the frequency in time t2. While the first dimension represents the chemical shifts of the nucleus in question, the second dimension reveals new information. The overall spectrum, Figure \(\PageIndex{56}\), is the result of a matrix in the two frequency domains obtained during the experiment.
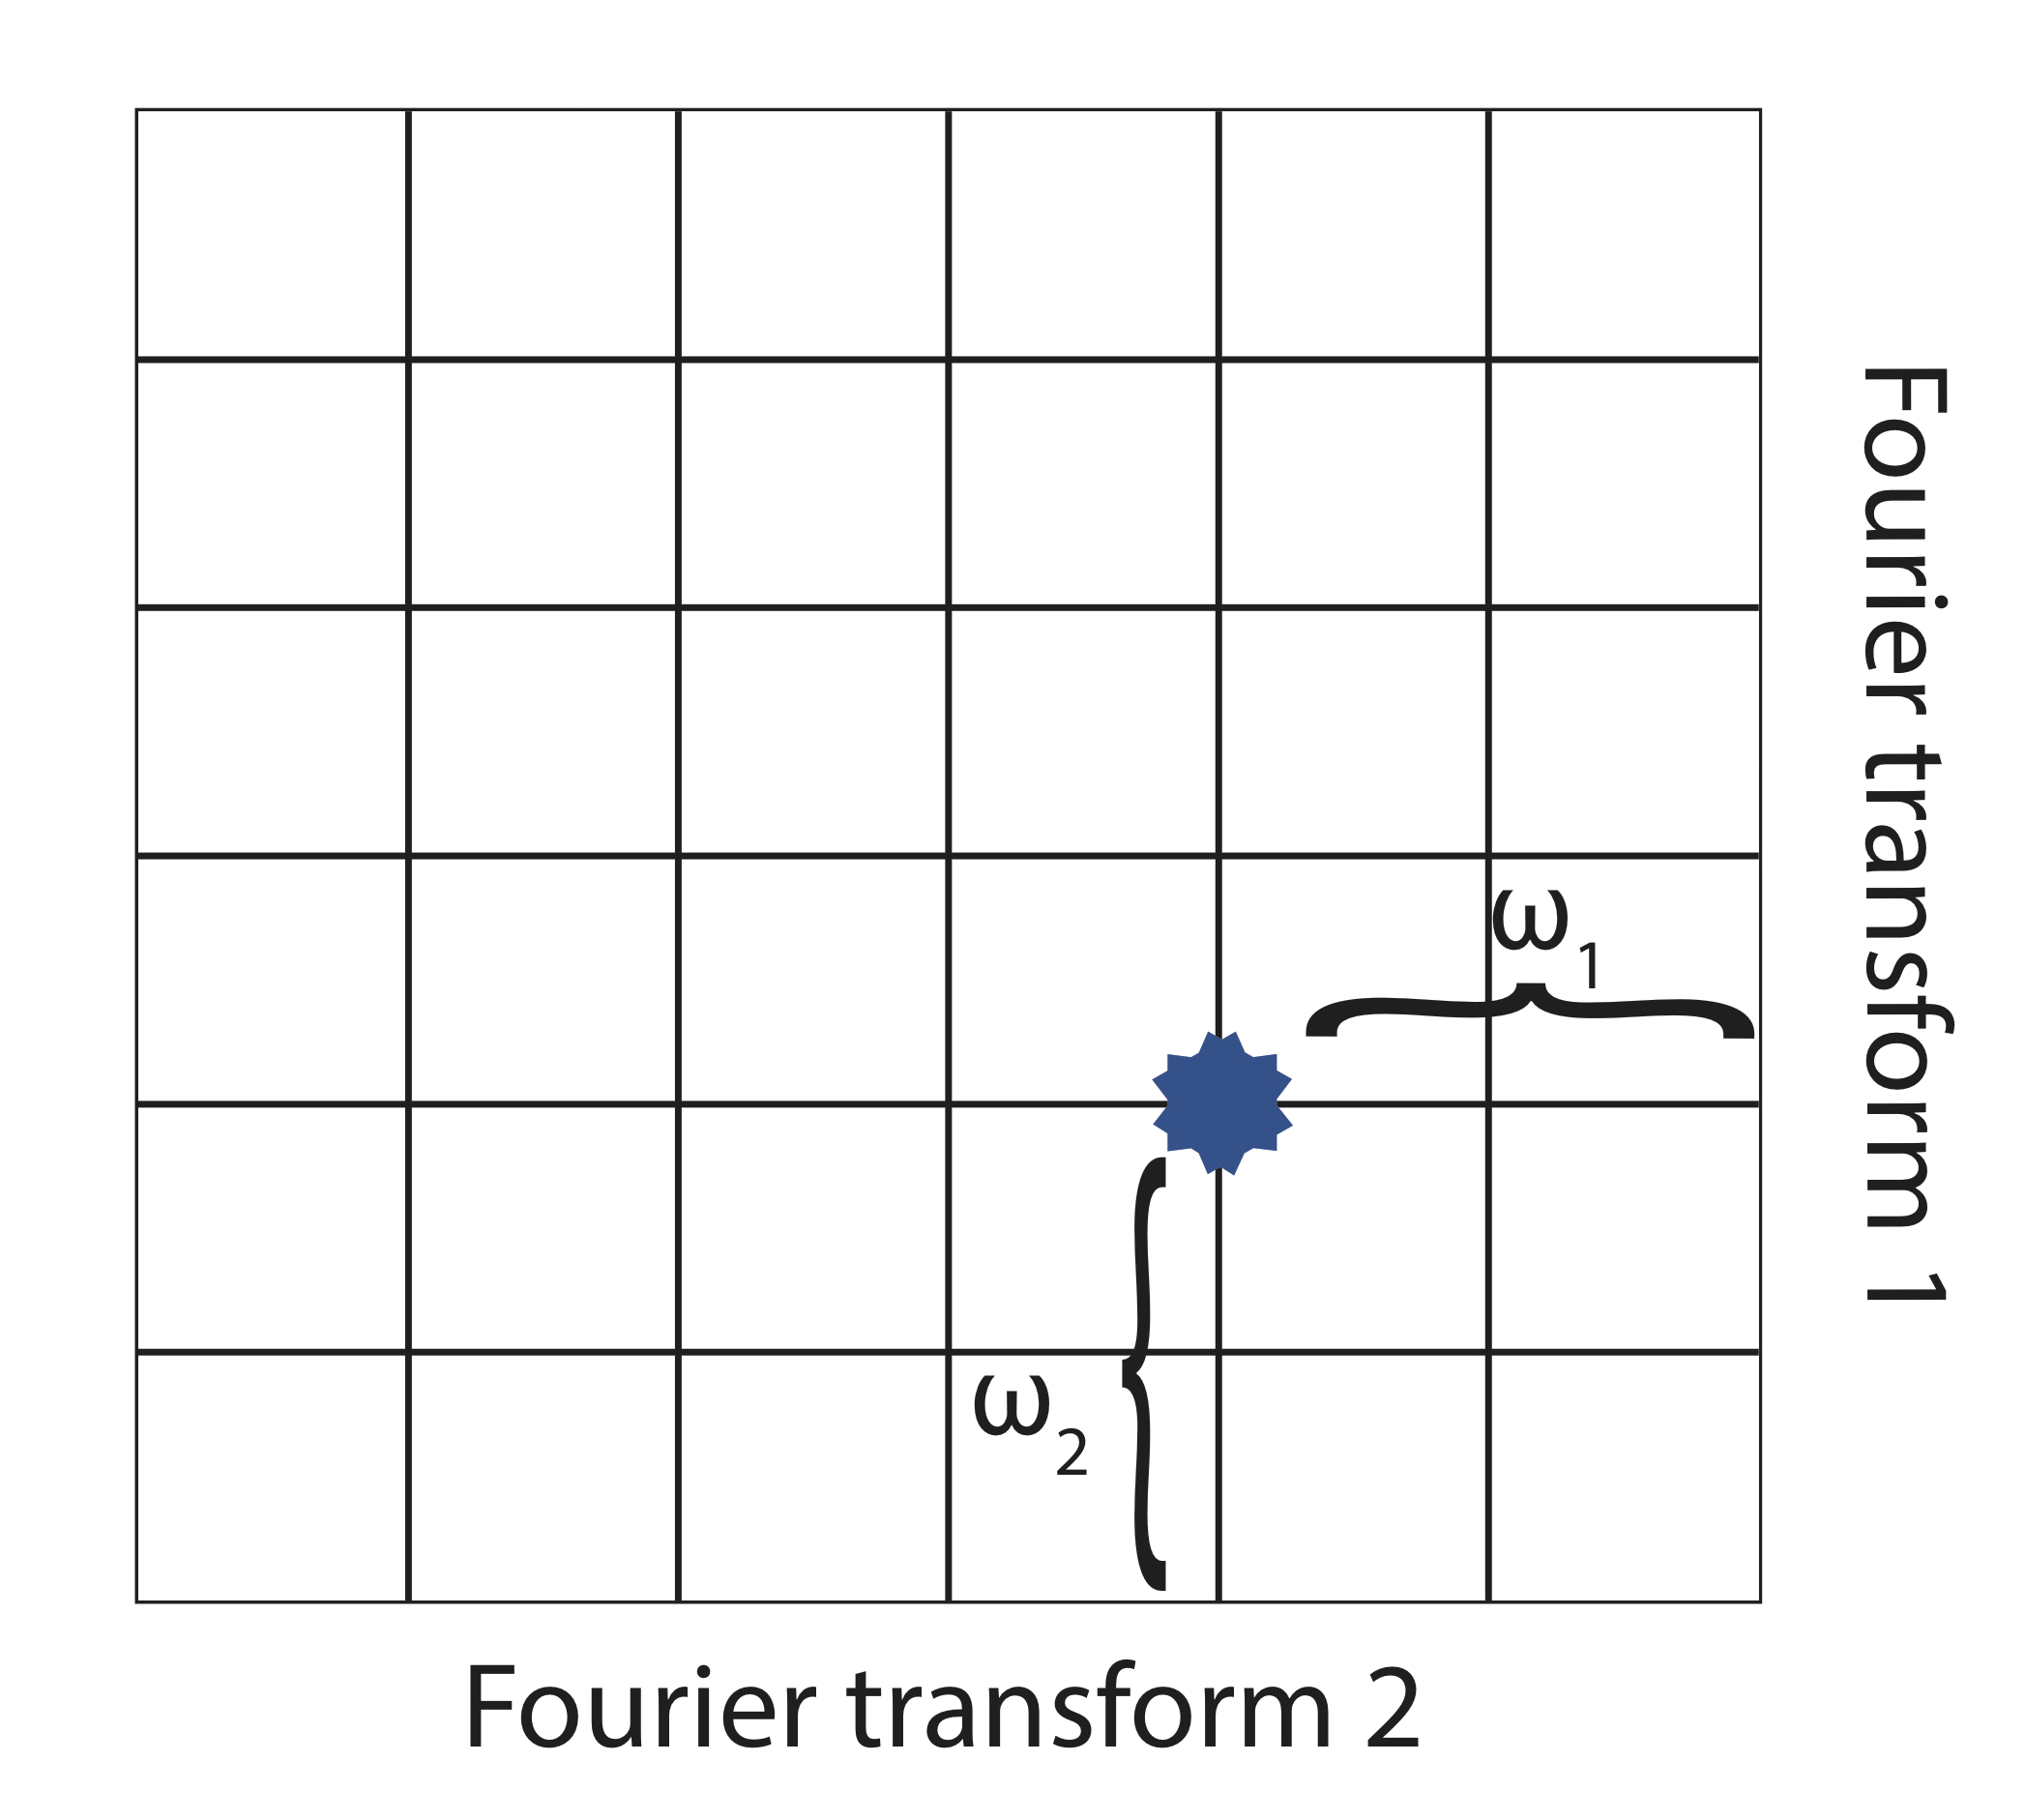
Pulse Variation
As mentioned earlier, the pulse sequence and the mixing period are some of the most important factors that determine the type of spectrum that will be identified. Depending on whether the magnetization is transferred through a J-coupling or NOE interaction, different information and spectra can be obtained. Furthermore, depending on the experimental setup, the mixing period could transfer magnetization either through a single J-coupling or through several J-couplings for nuclei that are connected together. Similarly NOE interactions can also be controlled to specific distances. Two types of NOE interactions can be observed, positive and negative. When the rate at which fluctuation occurs in the transverse plane of a fluctuating magnetic field matches the frequency of double quantum transition, a positive NOE is observed. When the fluctuation is slower, a negative NOE is produced.
Obtaining a Spectrum
Sample Preparation
Sample preparation for 2D NMR is essentially the same as that for 1D NMR. Particular caution should be exercised to use clean and dry sample tubes and use only deuterated solvents. The amount of sample used should be anywhere between 15 and 25 mg although with sufficient time even smaller quantities may be used. The filling height of the solvent should be about 4 cm. The solution must be clear and homogenous. Any participate needs to be filtered off prior to obtaining the spectra.
The Actual Experiment and Important Acquisition Parameters
The acquisition of a 2D spectrum will vary from instrument to instrument, but the process is virtually identical to obtaining a 13C spectrum. It is important to obtain a 1D spectrum (especially 1H) before proceeding to obtain a 2D spectrum. The acquisition range should be adjusted based on the 1D spectrum to minimize instrument time. Depending on the specific type of 2D experiment (such as COSY or NOESY) several parameters need to be adjusted. The following 6 steps can followed to obtain almost any 2D NMR spectrum.
- Login to the computer system.
- Change the sample.
- Lock and shim the magnet.
- Setup parameters and run the experiment. Use the 1D spectra already obtained to adjust experiment settings, paying special attention to important acquisition parameters.
- Process the obtained data and print the spectrum.
- Exit and logout.
The parameters listed in Table \(\PageIndex{7}\) should be given special attention, as they can significantly affect the quality of the spectra obtained.
| Parameter | Description |
| Acquisition Time (AQ) | Data points (TD) x dwell time (DW) |
| Dwell Time | 1/spectral width (SW) |
| Digital Resolution | 1/AQ |
| Number of Scans | Multiples of 8/16 |
| TD1 | Number of data points in the first time domain ( ~128-512) |
| SW1 | Spectral Width in the first (direct) dimension |
| TD2 | Number of data points in the second time domain (~2048-4096) |
| SW2 | Spectral Width in the second (indirect) dimension |
After Obtaining a Spectrum and Analysis
After a 2D spectrum has successfully been obtained, depending on the type of spectrum (COSY, NOESY, INEPT), it might need to be phased. Phasing is the adjustment of the spectrum so that all of the peaks across the spectrum are in the absorptive mode (pointing either up or down). With 2D spectra, phasing is done in both frequency dimensions. This can either be done automatically by a software program (for simple 2D spectra with no cluster signals) or manually by the user (for more complex 2D spectra). Sometimes, phasing can be done with the program that is used to obtain the spectrum. Afterwards the spectrum could either be printed out or further analyzed. One example of further analysis is integrating parts of the spectrum. This could give the user meaningful information about the relative ratio of different types of nuclei (and even quantify the ratios between two diasteriomeric molecules).
Conclusion
Two-dimensional NMR is increasingly becoming a routine method for analyzing complex molecules, whether they are inorganic compounds, organic natural products, proteins, or polymers. A basic understanding of 2D NMR can make it significantly easier to analyze complex molecules and provide further confirmation for results obtained by other methods. The variation in pulse sequences provides chemists the opportunity to analyze a large diversity of compounds. The increase in the magnetic strength of NMR machines has allowed 2D NMR to be more often used even for simpler molecules. Furthermore, higher dimension techniques have also been introduced, and they are slowly being integrated into the repertoire of chemists. These are essentially simple extensions of the ideas of 2D NMR.
Two-Dimensional NMR Experiments
Since the advent of NMR, synthetic chemists have had an excellent way to characterize their synthetic products. With the arrival of multidimensional NMR into the realm of analytical techniques, scientists have been able to study larger and more complicated molecules much easier than before, due to the great amount of information 2D and 3D NMR experiments can offer. With 2D NMR, overlapping multiplets and other complex splitting patterns seen in 1D NMR can be easily deciphered, since instead of one frequency domain, two frequency domains are plotted and the couplings are plotted with respect to each other, which makes it easier to determine molecular connectivity.
Spectra are obtained using a specific sequence of radiofrequency (RF) pulses that are administered to the sample, which can vary in the angle at which the pulse is given and/or the number of pulses. Figure \(\PageIndex{57}\) shows a schematic diagram for a generic pulse sequence in a 2D NMR experiment. First, a pulse is administered to the sample in what is referred to as the preparation period. This period could be anything from a single pulse to a complex pattern of pulses. The preparation period is followed by a “wait” time (also known as the evolution time), t1, during which no data is observed. The evolution time also can be varied to suit the needs of the specific experiment. A second pulse is administered next during what is known as the mixing period, where the coherence at the end of t1 is converted into an observable signal, which is recorded during the observation time, t2. Figure \(\PageIndex{58}\) shows a schematic diagram of how data is converted from the time domain (depicted in the free induction decay, or FID) to a frequency domain. The process of this transformation using Fourier Transform (FT) is the same as it is in 1D NMR, except here, it is done twice (or three times when conducting a 3D NMR experiment).
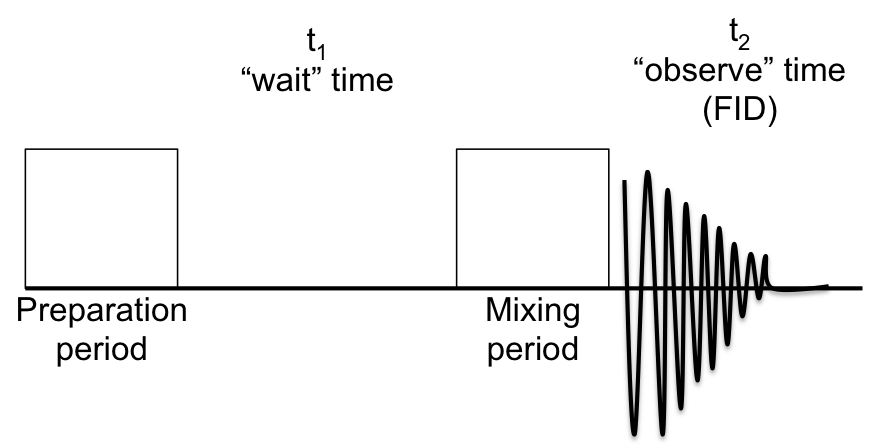
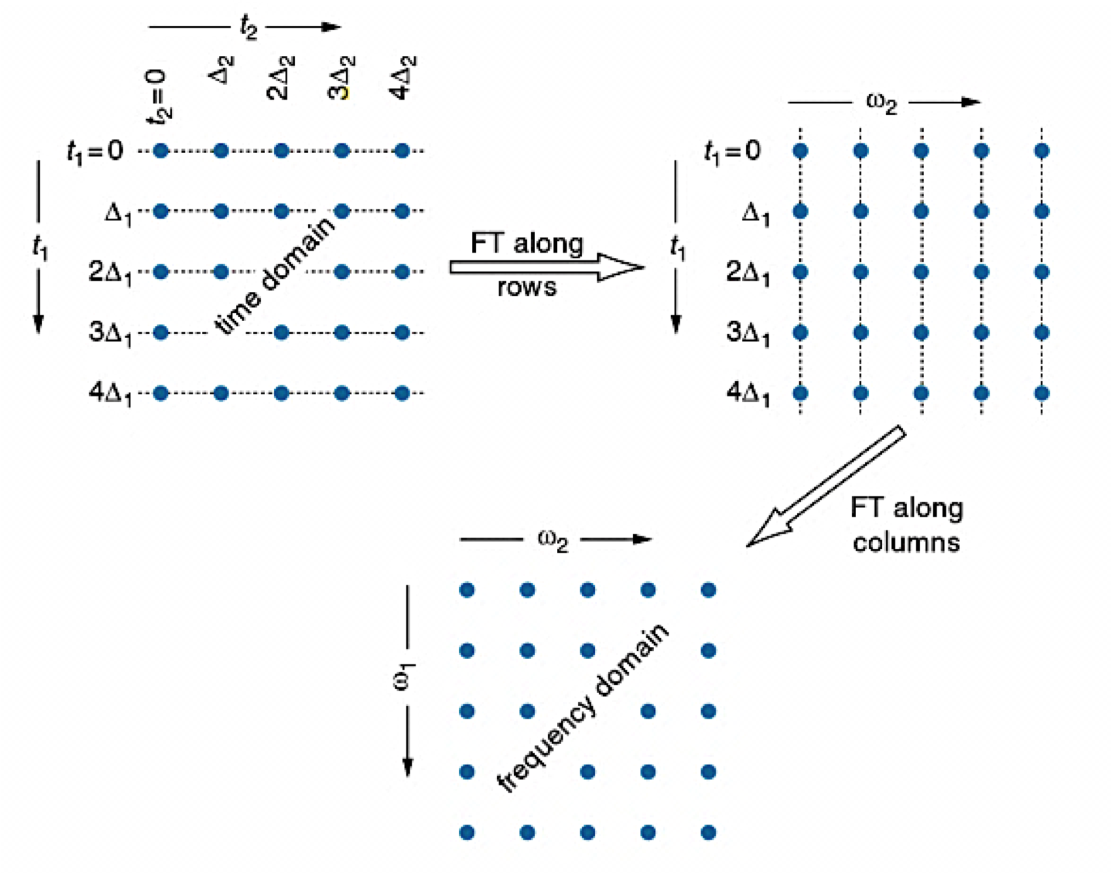
In 1D NMR, spectra are plotted with frequency (in ppm or Hz, although most commonly ppm) on the horizontal axis and with intensity on the vertical axis. However, in 2D NMR spectra, there are two frequency domains being plotted, each on the vertical and horizontal axes. Intensity, therefore, can be shown as a 3D plot or topographically, much like a contour map, with more contour lines representing greater intensities, as shown in Figure \(\PageIndex{59}\) a. Since it is difficult to read a spectrum in a 3D plot, all spectra are plotted as contour plots. Furthermore, since resolution in a 2D NMR spectrum is not needed as much as in a 1D spectrum, data acquisition times are often short.
2D NMR is very advantageous for many different applications, though it is mainly used for determining structure and stereochemistry of large molecules such as polymers and biological macromolecules, that usually exhibit higher order splitting effects and have small, overlapping coupling constants between nuclei. Further, some 2D NMR experiments can be used to elucidate the components of a complex mixture. This module aims to describe some of the common two-dimensional NMR experiments used to determine qualitative information about molecular structure.
2D Experiments
COSY
COSY (COrrelation SpectroscopY) was one of the first and most popular 2D NMR experiments to be developed. It is a homonuclear experiment that allows one to correlate different signals in the spectrum to each other. In a COSY spectrum (see Figure \(\PageIndex{59}\) b), the chemical shift values of the sample’s 1D NMR spectrum are plotted along both the vertical and horizontal axes (some 2D spectra will actually reproduce the 1D spectra along the axes, along with the frequency scale in ppm, while others may simply show the scale). This allows for a collection of peaks to appear down the diagonal of the spectrum known as diagonal peaks (shown in Figure \(\PageIndex{59}\) b, highlighted by the red dotted line). These diagonal peaks are simply the peaks that appear in the normal 1D spectrum, because they show nuclei that couple to themselves. The other type of peaks appears symmetric across the diagonal and is known as cross peaks. These peaks show which groups in the molecule that have different chemical shifts are coupled to each other by producing a signal at the intersection of the two frequency values.

One can then determine the structure of a sample by examining what chemical shift values the cross peaks occur at in a spectrum. Since the cross peaks are symmetric across the diagonal peaks, one can easily identify which cross peaks are real (if a certain peak has a counterpart on the other side of the diagonal) and which are digital artifacts of the experiment. The smallest coupling that can be detected using COSY is dependent on the linewidth of the spectrum and the signal-to-noise ratio; a maximum signal-to-noise ratio and a minimum linewidth will allow for very small coupling constants to be detected.
Variations of COSY
Although COSY is very useful, it does have its disadvantages. First of all, because the anti-phase structure of the cross peaks, which causes the spectral lines to cancel one another out, and the in-phase structure of the diagonal peaks, which causes reinforcement among the peaks, there is a significant difference in intensity between the diagonal and cross peaks. This difference in intensity makes identifying small cross peaks difficult, especially if they lie near the diagonal. Another problem is that when processing the data for a COSY spectrum, the broad lineshapes associated with the experiment can make high-resolution work difficult.
In one of the more popular COSY variations known as DQF COSY (Double-Quantum Filtered COSY), the pulse sequence is altered so that all of the signals are passed through a double-quantum coherence filter, which suppresses signals with no coupling (i.e. singlets) and allows cross peaks close to the diagonal to be clearly visible by making the spectral lines much sharper. Since most singlet peaks are due to the solvent, DQF COSY is useful to suppress those unwanted peaks.
ECOSY (Exclusive COrrelation SpectroscopY) is another derivative of COSY that was made to detect small J-couplings, predominantly among multiplets, usually when J ≤ 3 Hz. Also referred to as long-range COSY, this technique involves adding a delay of about 100-400 ms to the pulse sequence. However, there is more relaxation that is occurring during this delay, which causes a loss of magnetization, and therefore a loss of signal intensity. This experiment would be advantageous for one who would like to further investigate whether or not a certain coupling exists that did not appear in the regular COSY spectrum.
GS-COSY (Gradient Selective COSY) is a very applied offshoot of COSY since it eliminates the need for what is known as phase cycling. Phase cycling is a method in which the phase of the pulses is varied in such a way to eliminate unwanted signals in the spectrum, due to the multiple ways which magnetization can be aligned or transferred, or even due to instrument hardware. In practical terms, this means that by eliminating phase cycling, GS-COSY can produce a cleaner spectrum (less digital artifacts) in much less time than can normal COSY.
Another variation of COSY is COSY-45, which administers a pulse at 45° to the sample, unlike DQF COSY which administers a pulse perpendicular to the sample. This technique is useful because one can elucidate the sign of the coupling constant by looking at the shape of the peak and in which direction it is oriented. Knowing the sign of the coupling constant can be useful in discriminating between vicinal and geminal couplings. However, COSY-45 is less sensitive than other COSY experiments that use a 90° RF pulse.
TOCSY
TOCSY (TOtal Correlation SpectroscopY) is very similar to COSY in that it is a homonuclear correlation technique. It differs from COSY in that it not only shows nuclei that are directly coupled to each other, but also signals that are due to nuclei that are in the same spin system, as shown in Figure \(\PageIndex{60}\) below. This technique is useful for interpreting large, interconnected networks of spin couplings. The pulse sequence is arranged in such a way to allow for isotropic mixing during the sequence that transfers magnetization across a network of atoms coupled to each other. An alternative technique to 2D TOCSY is selective 1D TOCSY, which can excite certain regions of the spectrum by using shaped pulses. By specifying particular chemical shift values and setting a desired excitation width, one can greatly simplify the 1D experiment. Selective 1D TOCSY is particularly useful for analyzing polysaccharides, since each sugar subunit is an isolated spin system, which can produce its own subspectrum, as long as there is at least one resolved multiplet. Furthermore, each 2D spectrum can be acquired with the same resolution as a normal 1D spectrum, which allows for an accurate measurement of multiplet splittings, especially when signals from different coupled networks overlap with one another.
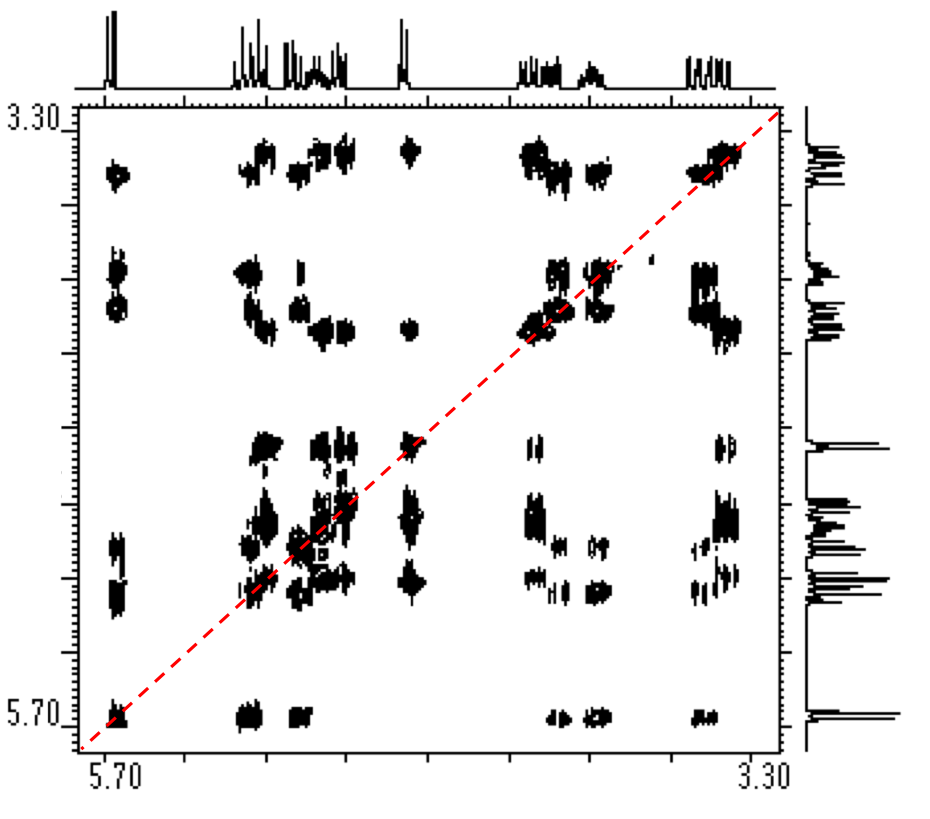
Heteronuclear Experiments
HETCOR (Heteronuclear Correlation) refers to a 2D NMR experiment that correlates couplings between different nuclei (usually 1H and a heteroatom, such as 13C or 15N). Heteronuclear experiments can easily be extended into three or more dimensions, which can be thought of as experiments that correlate couplings between three or more different nuclei. Because there are two different frequency domains, there are no diagonal peaks like there are in COSY or TOCSY. Recently, inverse-detected HETCOR experiments have become extremely useful and commonplace, and it will be those experiments that will be covered here. Inverse-detection refers to detecting the nucleus with the higher gyromagnetic ratio, which offers higher sensitivity. It is ideal to determine which nucleus has the highest gyromagnetic ratio for detection and set the probe to be the most sensitive to this nucleus. In HETCOR, the nucleus that was detected first in a 1H -13C experiment was 13C, whereas now 1H is detected first in inverse-detection experiments, since protons are inherently more sensitive. Today, regular HETCOR experiments are not usually in common laboratory practice.
The HMQC (Heteronuclear Multiple-Quantum Coherence) experiment acquires a spectrum (see Figure \(\PageIndex{61}\) a) by transferring the proton magnetization by way of 1JCH to a heteronucleus, for example, 13C. The 13C atom then experiences its chemical shift in the t1 time period of the pulse sequence. The magnetization then returns to the 1H for detection. HMQC detects 1JCH coupling and can also be used to differentiate between geminal and vicinal proton couplings just as in COSY-45. HMQC is very widely used and offers very good sensitivity at much shorter acquisition times than HETCOR (about 30 min as opposed to several hours with HETCOR).
However, because it shows the 1H -1H couplings in addition to 1H -13C couplings and because the cross peaks appear as multiplets, HMQC suffers when it comes to resolution in the 13C peaks. The HSQC (Heteronuclear Single-Quantum Coherence) experiment can assist, as it can suppress the 1H -1H couplings and collapse the multiplets seen in the cross peaks into singlets, which greatly enhances resolution (an example of an HSQC is shown in Figure \(\PageIndex{61}\) b). Figure \(\PageIndex{61}\) shows a side-by-side comparison of spectra from HMQC and HSQC experiments, in which some of the peaks in the HMQC spectrum are more resolved in the HSQC spectrum. However, HSQC administers more pulses than HMQC, which causes miss-settings and inhomogeneity between the RF pulses, which in turn leads to loss of sensitivity. In HMBC (Heteronuclear Multiple Bond Coherence) experiments, two and three bond couplings can be detected. This technique is particularly useful for putting smaller proposed fragments of a molecule together to elucidate the larger overall structure. HMBC, on the other hand, cannot distinguish between 2JCH and 3JCH coupling constants. An example spectrum is shown in Figure \(\PageIndex{61}\) d.

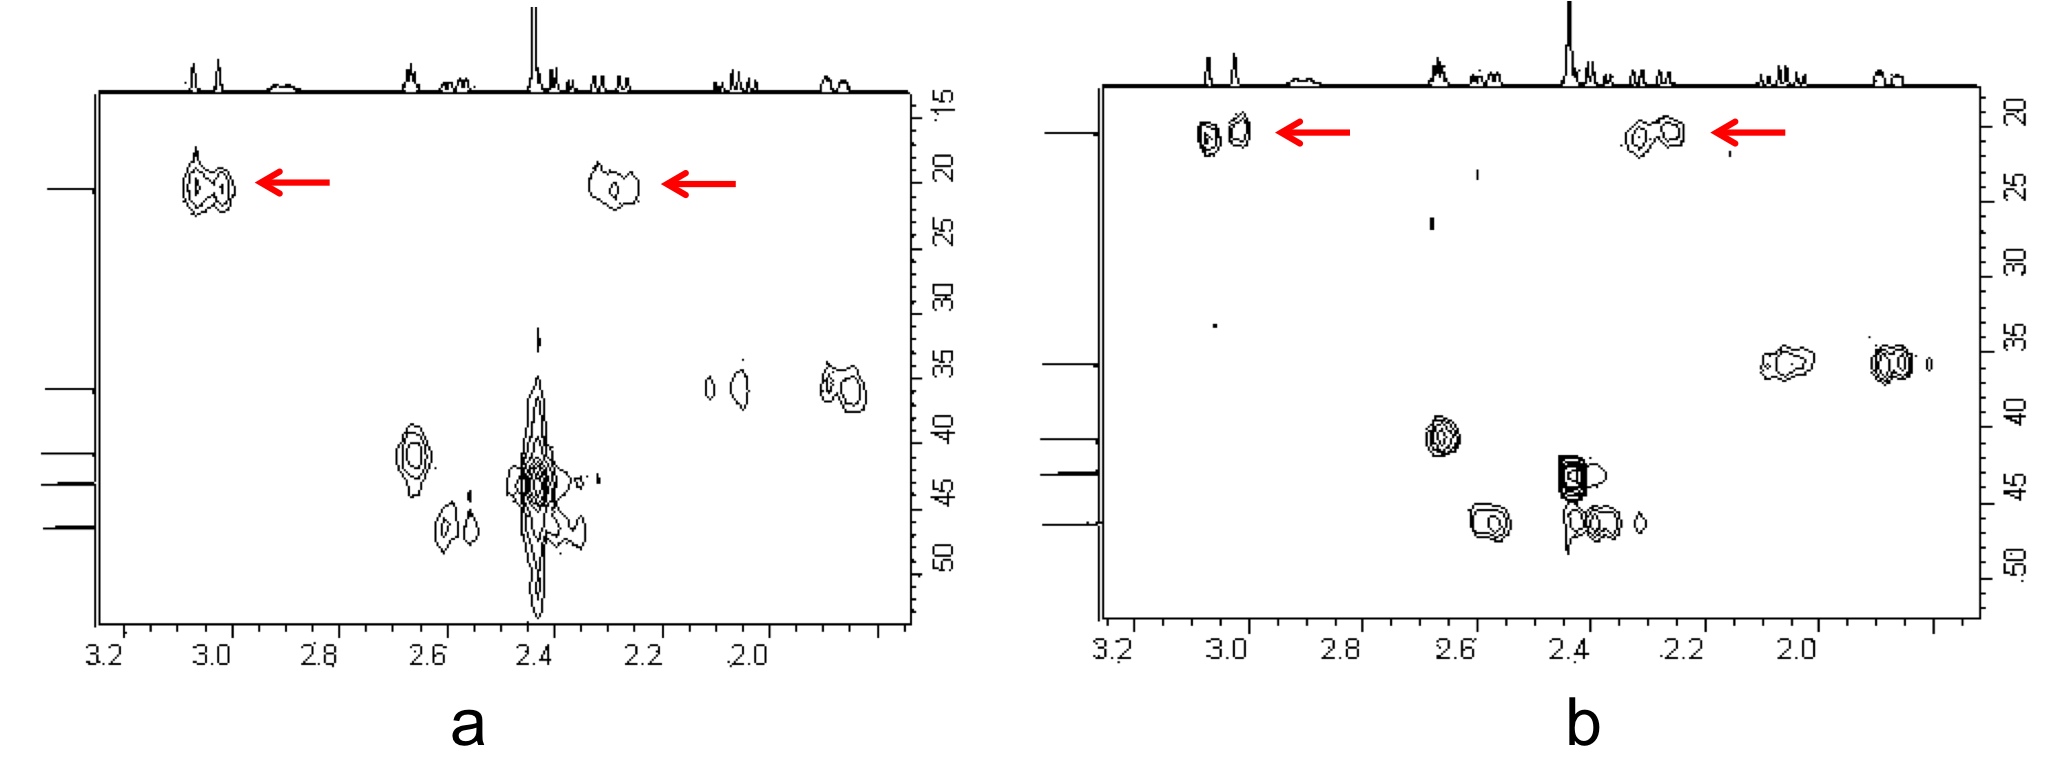
NOESY and ROESY
NOESY (Nuclear Overhauser Effect SpectroscopY) is an NMR experiment that can detect couplings between nuclei through spatial proximity (< 5 Å apart) rather than coupling through covalent bonds. The Nuclear Overhauser Effect (NOE) is the change in the intensity of the resonance of a nucleus upon irradiation of a nearby nucleus (about 2.5-3.5 Å apart). For example, when an RF pulse specifically irradiates a proton, its spin population is equalized and it can transfer its spin polarization to another proton and alter its spin population. The overall effect is dependent on a distance of r-6. NOESY uses a mixing time without pulses to accumulate NOEs and its counterpart ROESY (Rotating frame nuclear Overhauser Effect SpectroscopY) uses a series of pulses to accumulate NOEs. In NOESY, NOEs are positive when generated from small molecules, are negative when generated from large molecules (or molecules dissolved in a viscous solvent to restrict molecular tumbling), and are quite small (near zero) for medium-sized molecules. On the contrary, ROESY peaks are always positive, regardless of molecular weight. Both experiments are useful for determine proximity of nuclei in large biomolecules, especially proteins, where two atoms may be nearby in space, but not necessarily through covalent connectivity. Isomers, such as ortho-, meta-, and para-substituted aromatic rings, as well as stereochemistry, can also be distinguished through the use of an NOE experiment. Although NOESY and ROESY can generate COSY and TOCSY artifacts, respectively, those unwanted signals could be minimized by variations in the pulse sequences. Example NOESY and ROESY spectra are shown in Figure \(\PageIndex{63}\).

How to Interpret 2D NMR Spectra
Much of the interpretation one needs to do with 2D NMR begins with focusing on the cross peaks and matching them according to frequency, much like playing a game of Battleship®. The 1D spectrum usually will be plotted along the axes, so one can match which couplings in one spectrum correlate to which splitting patterns in the other spectrum using the cross peaks on the 2D spectrum (see Figure \(\PageIndex{64}\)).
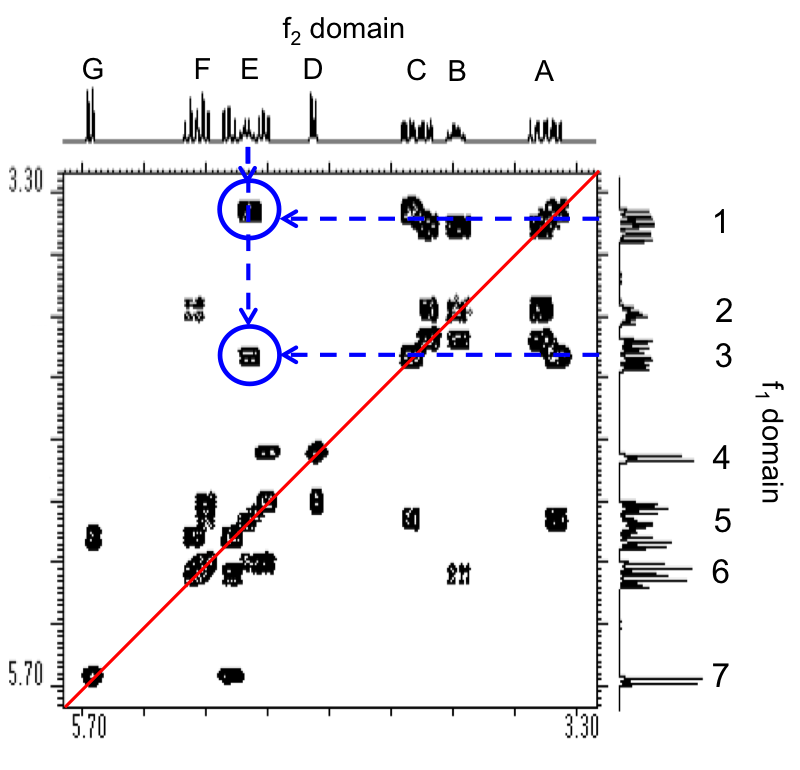
Also, multiple 2D NMR experiments are used to elucidate the structure of a single molecule, combining different information from the various sources. For example, one can combine homonuclear and heteronuclear experiments and piece together the information from the two techniques, with a process known as Parallel Acquisition NMR Spectroscopy or PANSY. In the 1990s, co-variance processing came onto the scene, which allowed scientists to process information from two separate experiments, without having to run both experiments at the same time, which made for shorter data acquisition time. Currently, the software for co-variance processing is available from various NMR manufacturers. There are many possible ways to interpret 2D NMR spectra, though one common method is to label the cross peaks and make connections between the signals as they become apparent. Prof. James Nowick at UC Irvine describes his method of choice for putting the pieces together when determining the structure of a sample; the lecture in which he describes this method is posted in the links above. In this video, he provides a stepwise method to deciphering a spectrum.
Conclusion
Within NMR spectroscopy, there are a vast variety of different methods to acquire data on molecular structure. In 1D and 2D experiments, one can simply adjust the appearance of the spectrum by changing any one of the many parameters that are set when running a sample, such as number of scans, relaxation delay times, the amount of pulses at various angles, etc. Many 3D and 4D NMR experiments are actually simply multiple 2D NMR pulse sequences run in sequence, which generates more correlation between different nuclei in a spin system. With 3D NMR experiments, three nuclei, for example 1H, 13C, and 15N can be studied together and their connectivity can be elucidated. These techniques become invaluable when working with biological molecules with complex 3D structures, such as proteins and polysaccharides, to analyze their structures in solution. These techniques, coupled with ultra-fast data acquisition, leads to monitoring complex chemical reactions and/or non-covalent interactions in real time. Through the use of these and other techniques, one can begin to supplement a characterization “toolbox” in order to continue solving complex chemical problems.
Chemical Exchange Saturation Transfer (CEST)
Paramagnetic chemical exchange saturation transfer (PARACEST) is a powerful analytical tool that can elucidate many physical properties of molecules and systems of interest both in vivo and in vitro through specific paramagnetic agents. Although a relatively new imaging technique, applications for PARACEST imaging are growing as new imaging agents are being developed with enhanced exchange properties. Current applications revolve around using these PARACEST agents for MRI imaging to enhance contrast. However, the fundamentals of PARACEST can be used to measure properties such as temperature, pH, and concentration of molecules and systems as we will discuss. PARACEST was developed in response to several imaging limitations presented by diamagnetic agents. PARACEST spectral data can be easily obtained using NMR Spectroscopy while imaging can be typically achieved with widely available clinical 1.5/4 T MRI scanners.
History
Chemical exchange saturation transfer (CEST) is a phenomenon that has been around since the 1960s. It was first discovered by Forsén, pictured below in Figure \(\PageIndex{65}\), and Hoffman in 1963 and was termed magnetization transfer NMR. This technique was limited in its applications to studying rapid chemical exchange reactions. However in 2000, Balaban, pictured below in Figure \(\PageIndex{66}\), revisited this topic and discovered the application of this phenomenon for imaging purposes. He termed the phenomenon chemical exchange saturation transfer. From this seminal finding, Balaban elucidated techniques to modulate MRI contrasts to reflect the exchange for imaging purposes.


CEST imaging focuses on N-H, O-H, or S-H exchangeable protons. Observing these exchanges in diamagnetic molecules can be very challenging. Several models have been developed to overcome the challenges associated with imaging with clinical scanners. The focus of recent research has been to develop paramagnetic chemical exchange saturation transfer (PARACEST) agents. Typical PARACEST complexes are based on lanthanide atoms. Historically, these molecules were thought to be useless for chemical exchange due to their very fast water exchanges rates. However, recent works by Silvio Aime and Dean Sherry have shown modified lanthanide complexes that have very slow exchange rates that make it ideal for CEST imaging. In addition to slow exchange rates, these molecules have vastly different resonance frequencies which contributes to their enhanced contrast.
Chemical Exchange Saturation Transfer
Saturation Transfer
Chemical exchange is defined as the process of proton exchange with surrounding bulk water. Exchange can occur with non-water exchange sites but it has been shown that its’ contribution is negligible. As stated before, CEST imaging focuses on N-H, O-H, or S-H exchangeable protons. Molecularly every exchange proton has a very specific saturation frequency. Applying a radio-frequency pulse that is the same as the proton’s saturation frequency results in a net loss of longitudinal magnetization. Longitudinal magnetization exists by virtue of being in a magnet. All protons in a solution line up with the magnetic field either in a parallel or antiparallel manner. There is a net longitudinal magnetization at equilibrium as the antiparallel state is higher in energy. A 90° RF pulse sequence causes many of the parallel protons to move to the higher energy antiparallel state causing zero longitudinal magnetization. This nonequilibrium state is termed as saturation, where the same amount of nuclear spins is aligned against and with the magnetic field. These saturated protons are exchangeable and the surrounding bulk water participates in this exchange called chemical exchange saturation transfer.
This exchange can be visualized through spectral data. The saturated proton exchange with the surrounding bulk water causes the spectral signal from the bulk water to decrease due to decreased net longitudinal magnetization. This decrease can then be quantified and used to measure a wide variety of properties of a molecule or a solution. In the next sub-section, we will explore the quantification in more detail to provide a stronger conceptual understanding.
Two-system Model
Derivations of the chemical exchange saturation transfer mathematical models arise fundamentally from an understanding of the Boltzmann equation, \ref{17}. The Boltzmann equation mathematically defines the distribution of spins of a molecule placed in a magnetic field. There are many complex models that are used to provide a better understanding of the phenomenon. However, we will stick with a two-system model to simplify the mathematics to focus on conceptual understanding. In this model, there are two systems: bulk water (alpha) and an agent pool (beta). When the agent pool is saturated with a radiofrequency pulse, we make two important assumptions. The first is that all the exchangeable protons are fully saturated and the second is that the saturation process does not affect the bulk water protons, which retain their characteristic longitudinal magnetization.
\[ \frac{N_{high\ energy}}{N_{low\ energy}}\ =\ exp( \frac{-\Delta E}{kT}) \label{17} \]
To quantify the following proton exchange we shall define the equilibrium proton concentration. The Boltzmann equation gives us the distribution of the spin states at equilibrium which is proportional to the proton concentration. As such, we shall label the two system’s equilibrium states as \( M_{\alpha }^{0} \) and \( M_{\beta }^{0} \). Following saturation, the saturated protons of the bulk pool exchange with the agent pool at a rate \( k_{\alpha } \). As such the decrease in longitudinal (Z) magnetization is given by \( k_{\alpha } M^{Z}_{\alpha } \). Furthermore, another effect that needs to be considered is the inherent relaxation of the protons which increase the Z magnetization back to equilibrium levels, \( M_{\alpha }^{0} \). This can be estimated with the following \ref{18} where \( T_{1 \alpha } \) is the longitudinal relaxation time for bulk water. Setting the two systems equal to represent equilibrium we get the following relationship \ref{19} that can be manipulated mathematically to yield the generalized chemical exchange Equation \ref{20} where \( \tau _{\alpha } \ = k_{\alpha }^{-1} \) and defined as lifetime of a proton in the system and c being the concentrations of protons in their respective system. [n] represents the number of exchangeable protons per CEST molecule. In terms of CEST calculations, the lower the ratio of Z the more prominent the CEST effect. A plot of this equation over a range of pulse frequencies results in what is called a Z-spectra also known as a CEST spectra, shown in Figure \(\PageIndex{67}\). This spectrum is then used to create CEST Images.
\[ \frac{M^{0}_{\alpha } - M^{Z}_{\alpha }}{T_{1\alpha }} \label{18} \]
\[ k_{\alpha }M^{Z}_{\alpha } \ =\ \frac{M^{0}_{\alpha } - M^{Z}_{\alpha }}{T_{1\alpha }} \label{19} \]
\[ Z\ = \frac{M^{Z}_{\alpha }}{M^{0}_{\alpha }} = \frac{1}{1\ +\ \frac{C_{\beta }[n]}{C_{\alpha }} \frac{T_{1\alpha }}{\tau _{\alpha }}} \label{20} \]
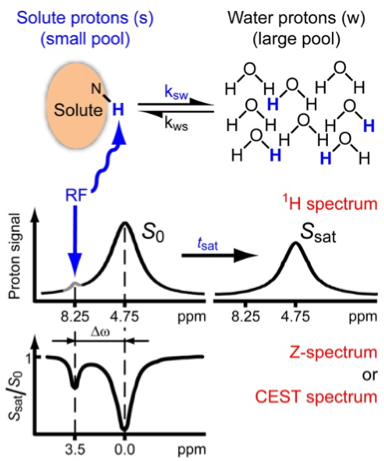
Limitations of Diamagnetic CEST Imaging and Two-system Model
A CEST agent must have several properties to maximize the CEST effect. Maximum CEST effect is observed when the residence lifetime of bulk water ( \(\tau _{\alpha } \) ) is as short as possible. This indirectly means that an effective CEST agent has a high exchange rate, \( k_{\alpha } \). Furthermore, maximum effect is noted when the CEST agent concentration is high.
In addition to these two properties, we need to consider the fact that the two-system model’s assumptions are almost never true. There is often a less than saturated system resulting in a decrease in the observed CEST effect. As a result, we need to consider the power of the saturation pulses, B1. The relationship between the \(\tau _{\alpha } \) and B1 is shown in the below \ref{21}. As such, an increase in saturation pulse power results in increase CEST effect. However, we cannot apply too much B1 due to in vivo limitations. Furthermore, the ideal \(\tau _{\alpha } \) can be calculated using the above relationship.
\[ \tau \ =\ \frac{1}{2\pi B_{1}} \label{21} \]
Finally, another limitation that needs to be considered is the inherent only to diamagnetic CEST and provides an important distinction between CEST and PARACEST as we will soon discuss. We assumed with the two-system model that saturation with a radiofrequency pulse did not affect the surrounded bulk water Z-magnetization. However, this is large generalization that can only be made for PARACEST agents as we shall soon see. Diamagnetic species, whether endogenous or exogenous, have a chemical shift difference (Δω) between the exchangeable –NH or –OH groups and the bulk water of less than 5 ppm. This small shift difference is a major limitation. Selective saturation often lead to partial saturation of bulk water protons. This is a more important consideration where in-vivo water peak is very broad. As such, we need to maximize the shift difference between bulk water and the contrast agent.
Paramagnetic Chemical Exchange Saturation Transfer
Strengths of PARACEST
PARACEST addresses the two complications that arise with CEST. Application of a radio frequency pulse close to the bulk water signal will result in some off-resonance saturation of the wa
ter. This essentially limits power which enhances CEST effect. Furthermore, a slow exchange condition less than the saturation frequency difference (Δω) means that a very slow exchange rate is required for diamagnetic CEST agents of this sort. Both problems can be alleviated by using an agent that has a larger chemical shift separation such as paramagnetic species. Figure \(\PageIndex{68}\) shows the broad Δω of Eu3+complex.
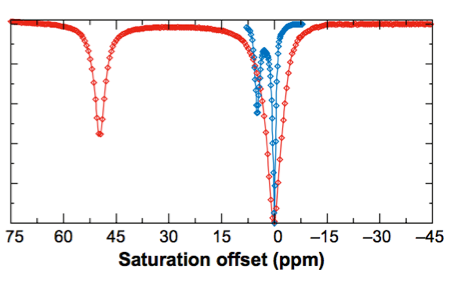
Figure \(\PageIndex{68}\) Eu3+ complex broadens the chemical shift leading to a larger saturation frequency difference that can easily be detected. Red spectral line represents EuDOTA-(glycine ethyl ester)4. Blue spectral line represents barbituric acid. Adapted from A. D. Sherry and M. Woods, Annu. Rev. Biomed. Eng., 2008, 10, 391.
Selection of Lanthanide Species
Based on the criteri a established in \ref{22}, we see that only Eu3+, Tb3+, Dy3+, and Ho3+ are effective lanthanide CEST agents at the most common MRI power level (1.5 T). However, given stronger field strengths the Table \(\PageIndex{8}\) suggests more CEST efficiency. With exception of Sm3+, all other lanthanide molecules have shifts far from water peak providing a large Δω that is desired of CEST agents. This table should be considered before design of a PARACEST experiment. Furthermore, this table eludes the relationship between power of the saturation pulse and the observed CEST effect. Referring to the following \ref{23}, we see that for increased saturation pulse we notice increased CEST effect. In fact, varying B1 levels changes saturation offset. The higher the B1frequency the higher the signal intensity of the saturation offset As such, it is important to select a proper saturation pulse before experimentation.
| Complex | Tm at 298 K (\(\mu \) s) | δ 1H (ppm) | Δω.τα at 1.5 T | Δω.τα at 4.7 T | Δω.τα at 11.75 T |
| Pr3+ | 20 | -60 | 0.5 | 1.5 | 3.8 |
| Nd3+ | 80 | -32 | 1.0 | 3.2 | 8.0 |
| Sm3+ | 320 | -4 | 0.5 | 1.6 | 4.0 |
| Eu3+ | 382 | 50 | 7.7 | 24.0 | 60.0 |
| Tb3+ | 31 | -600 | 7.5 | 23.4 | 58.5 |
| Dy3+ | 17 | -720 | 4.9 | 15.4 | 38.5 |
| Ho3+ | 19 | -360 | 2.8 | 8.6 | 21.5 |
| Er3+ | 9 | 200 | 0.7 | 2.3 | 5.7 |
| Tm3+ | 3 | 500 | 0.6 | 1.9 | 4.7 |
| Yb3+ | 3 | 200 | 0.2 | 0.5 | 1.9 |
Based on the criteria established in \ref{22}, we see that only Eu3+, Tb3+, Dy3+, and Ho3+ are effective lanthanide CEST agents at the most common MRI power level (1.5 T). However, given stronger field strengths the Table \(\PageIndex{9}\) suggests more CEST efficiency. With exception of Sm3+, all other lanthanide molecules have shifts far from water peak providing a large Δω that is desired of CEST agents. This table should be considered before design of a PARACEST experiment. Furthermore, this table eludes the relationship between power of the saturation pulse and the observed CEST effect. Referring to the following \ref{23}, we see that for increased saturation pulse we notice increased CEST effect. In fact, varying B1 levels changes saturation offset. The higher the B1frequency the higher the signal intensity of the saturation offset As such, it is important to select a proper saturation pulse before experimentation.
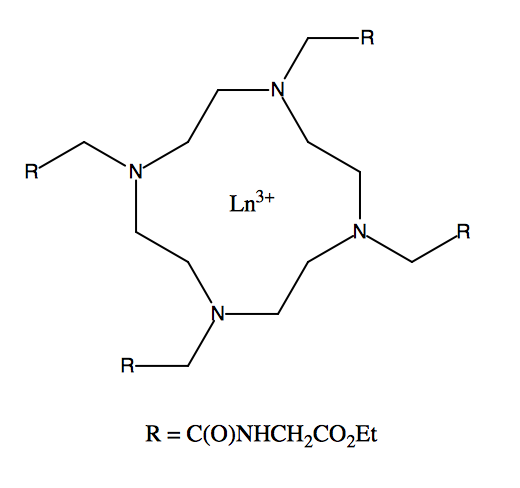
\[ \Delta \omega \cdot \tau _{\alpha } \ =\ \frac{1}{2\pi B_{1}} \label{22} \]
\[ \tau _{\alpha } \ =\ \frac{1}{2\pi B_{1}} \label{23} \]
Running a PARACEST Experiment
Two types of experiments can be run to quantify PARACEST. The first produces quantifiable Z-spectral data and is typically run on 400 MHz spectrometers with a B1 power between 200-1000 KHz and an irradiation time between 2 and 6 seconds based on the lanthanide complex. Imaging experiments are typically performed on either clinical scanners are small bore MRI scanner at room temperature using a custom surface coil. Imaging experiments usually require the followings sequence of steps:
- Bulk water spectra are collected from PARACEST using a 2 second presaturation pulse at a desired power level based on lanthanide complex.
- Following base scan, the saturation frequency is stepped between ±100 ppm (relative to the bulk water frequency at 0 ppm) in 1 ppm increments. The scanning frequency can be altered to include a wider scan if lanthanide complex has a larger chemical shift difference.
- Following collection of data, the bulk water signal is integrated using a Matlab program. The difference between the integrated signals measured at equivalent positive and negative saturation frequencies are plotted and subtracted using the following \ref{24} and mapped to produce gradient images.
- To create a CEST Image the data set is first filtered to improve signal-to-noise ratio and normalized with phantom data by subtraction and color-coded.
- For data tools to perform CEST Imaging analysis. Please refer to the following links for free access to open source software tools: https://github.com/cest-sources/CEST_EVAL/ or http://www.med.upenn.edu/cmroi/software-overview.html.
\[ \frac{S_{sat(-\Delta \omega)} \ -\ S_{sat(\Delta \omega)}}{S_{0}} \label{24} \]
Applications of PARACEST
Temperature Mapping
PARACEST imaging has shown to be a promising area of research in developing a noninvasive technique for temperature mapping. Sherry et. al shows a variable-temperature dependence of a lanthanide bound water molecule resonance frequency. They establish a linear correspondence over the range of 20-50 °C. Furthermore, they show a feasible analysis technique to locate the chemical shift (δ) of a lanthanide in images with high spatial resolution. By developing a plot of pixel intensity versus frequency offset they can individually identify temperature at each pixel and hence create a temperature map as shown in the Figure \(\PageIndex{70}\).
Zinc Ion Detection
Divalent zinc is an integral transition-metal that is prominent in many aqueous solutions and plays an important role in physiological systems. The ability to detect changes in sample concentrations of Zinc ions provides valuable information regarding a system’s. Developing specific ligands that coordinate with specific ions to enhance wate-rexchange characteristics can amplify CEST profile. In this paper, the authors develop a Eu(dotampy) sensor shown in Figure \(\PageIndex{71}\) for Zn ions. This authors theorize that the sensor coordinates with Zinc using its four pyridine donors in a square anti-prism manner as determined by NMR Spectroscopy by observing water exchange rates and by base catalysis by observing CEST sensitivity. Authors were unable to analyze coordination by X-ray crystallography. Following, determination of successful CEST profiles, the authors mapped in-vitro samples of varying concentrations of Zn and were successfully able to correlate image voxel intensity with Zn concentrations as shown in Figure \(\PageIndex{72}\). Furthermore, they were able to successfully demonstrate specificity of the sensor to Zn over Magnesium and Calcium. This application proves promising as a potential detection method for Zn ions in solutions with a range of concentrations between 5 nm to 0.12 μm.
.png?revision=1)


