

3.9: Interpretation
- Page ID
- 167033
\( \newcommand{\vecs}[1]{\overset { \scriptstyle \rightharpoonup} {\mathbf{#1}} } \)
\( \newcommand{\vecd}[1]{\overset{-\!-\!\rightharpoonup}{\vphantom{a}\smash {#1}}} \)
\( \newcommand{\dsum}{\displaystyle\sum\limits} \)
\( \newcommand{\dint}{\displaystyle\int\limits} \)
\( \newcommand{\dlim}{\displaystyle\lim\limits} \)
\( \newcommand{\id}{\mathrm{id}}\) \( \newcommand{\Span}{\mathrm{span}}\)
( \newcommand{\kernel}{\mathrm{null}\,}\) \( \newcommand{\range}{\mathrm{range}\,}\)
\( \newcommand{\RealPart}{\mathrm{Re}}\) \( \newcommand{\ImaginaryPart}{\mathrm{Im}}\)
\( \newcommand{\Argument}{\mathrm{Arg}}\) \( \newcommand{\norm}[1]{\| #1 \|}\)
\( \newcommand{\inner}[2]{\langle #1, #2 \rangle}\)
\( \newcommand{\Span}{\mathrm{span}}\)
\( \newcommand{\id}{\mathrm{id}}\)
\( \newcommand{\Span}{\mathrm{span}}\)
\( \newcommand{\kernel}{\mathrm{null}\,}\)
\( \newcommand{\range}{\mathrm{range}\,}\)
\( \newcommand{\RealPart}{\mathrm{Re}}\)
\( \newcommand{\ImaginaryPart}{\mathrm{Im}}\)
\( \newcommand{\Argument}{\mathrm{Arg}}\)
\( \newcommand{\norm}[1]{\| #1 \|}\)
\( \newcommand{\inner}[2]{\langle #1, #2 \rangle}\)
\( \newcommand{\Span}{\mathrm{span}}\) \( \newcommand{\AA}{\unicode[.8,0]{x212B}}\)
\( \newcommand{\vectorA}[1]{\vec{#1}} % arrow\)
\( \newcommand{\vectorAt}[1]{\vec{\text{#1}}} % arrow\)
\( \newcommand{\vectorB}[1]{\overset { \scriptstyle \rightharpoonup} {\mathbf{#1}} } \)
\( \newcommand{\vectorC}[1]{\textbf{#1}} \)
\( \newcommand{\vectorD}[1]{\overrightarrow{#1}} \)
\( \newcommand{\vectorDt}[1]{\overrightarrow{\text{#1}}} \)
\( \newcommand{\vectE}[1]{\overset{-\!-\!\rightharpoonup}{\vphantom{a}\smash{\mathbf {#1}}}} \)
\( \newcommand{\vecs}[1]{\overset { \scriptstyle \rightharpoonup} {\mathbf{#1}} } \)
\(\newcommand{\longvect}{\overrightarrow}\)
\( \newcommand{\vecd}[1]{\overset{-\!-\!\rightharpoonup}{\vphantom{a}\smash {#1}}} \)
\(\newcommand{\ket}[1]{\left| #1 \right>}\)
\(\newcommand{\bra}[1]{\left< #1 \right|}\)
\(\newcommand{\braket}[2]{\left< #1 \vphantom{#2} \right| \left. #2 \vphantom{#1} \right>}\)
\(\newcommand{\braopket}[3]{\left< #1 \vphantom{#2}\vphantom{#3} \right| #2 \vphantom{#1}\vphantom{#3} \left| #3 \vphantom{#1}\vphantom{#2} \right>}\)
\(\newcommand{\qmvec}[1]{\mathbf{\vec{#1}}}\)
\(\newcommand{\op}[1]{\hat{\mathbf{#1}}}\)
\(\newcommand{\expect}[1]{\langle #1 \rangle}\)
\(\newcommand{\dfn}[1]{\emph{\textbf{#1}}}\)
Infrared spectroscopy is the study of the interaction of infrared light with matter. The fundamental measurement obtained in infrared spectroscopy is an infrared spectrum, which is a plot of measured infrared intensity versus wavelength (or frequency) of light.
Introduction
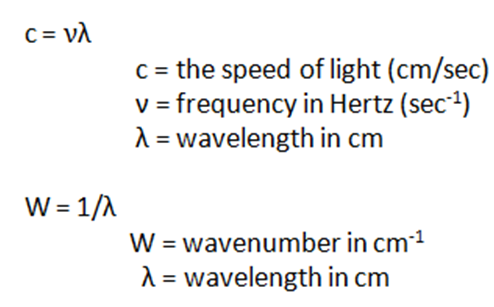
In infrared spectroscopy, units called wavenumbers are normally used to denote different types of light. The frequency, wavelength, and wavenumber are related to each other via the following equation(1):
 (1)
(1)
These equations show that light waves may be described by their frequency, wavelength or wavenumber. Here, we typically refer to light waves by their wavenumber, however it will be more convenient to refer to a light wave's frequency or wavelength. The wavenumber of several different types of light are shown in table 1.
.gif?revision=1&size=bestfit&width=630&height=233)
Table 1. The Electromagnetic spectrum showing the wavenumber of several different types of light.
When a molecule absorbs infrared radiation, its chemical bonds vibrate. The bonds can stretch, contract, and bend. This is why infrared spectroscopy is a type of vibrational spectroscopy. Fortunately, the complex vibrational motion of a molecule can be broken down into a number of constituent vibrations called normal modes. For example, when a guitar string is plucked, the string vibrates at its normal mode frequency. Molecules, like guitar strings, vibrate at specfic frequencies so different molecules vibrate at different frequencies because their structures are different. This is why molecules can be distinguished using infrared spectroscopy. The first necessary condition for a molecule to absorb infrared light is that the molecule must have a vibration during which the change in dipole moment with respect to distance is non-zero. This condition can be summarized in equation(2) form as follows:
.png?revision=1&size=bestfit&width=290&height=54) (2)
(2)
Vibrations that satisfy this equation are said to be infrared active. The H-Cl stretch of hydrogen chloride and the asymmetric stretch of CO2 are examples of infrared active vibrations. Infrared active vibrations cause the bands seen in an infrared spectrum.
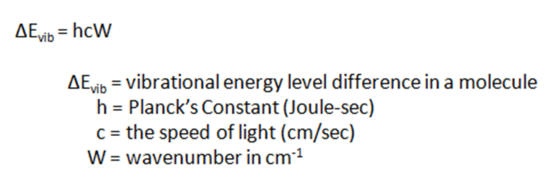
The second necessary condition for infrared absorbance is that the energy of the light impinging on a molecule must equal a vibrational energy level difference within the molecule. This condition can be summarized in equation(3) form as follows:
 (3)
(3)
If the energy of a photon does not meet the criterion in this equation, it will be transmitted by the sample and if the photon energy satisfies this equation, that photon will be absorbed by the molecule.(See Infrared: Theory for more detail)
As any other analytical techniques, infrared spectroscopy works well on some samples, and poorly on others. It is important to know the strengths and weaknesses of infrared spectroscopy so it can be used in the proper way. Some advantages and disadvantages of infrared spectroscopy are listed in table 2.
| Advantages | Disadvantages |
|
Solids, Liquids, gases, semi-solids, powders and polymers are all analyzed The peak positions, intensities, widths, and shapes all provide useful information Fast and easy technique Sensitive technique (Micrograms of materials can be detected routinely) Inexpensive |
Atoms or monatomic ions do not have infrared spectra Homonuclear diatomic molecules do not posses infrared spectra Complex mixture and aqueous solutions are difficult to analyze using infrared spectroscopy |
Table 2. The Advantage and Disadvantage of Infrared Spectroscopy
Origin of Peak Positions, Intensities, and Widths
Peak Positions
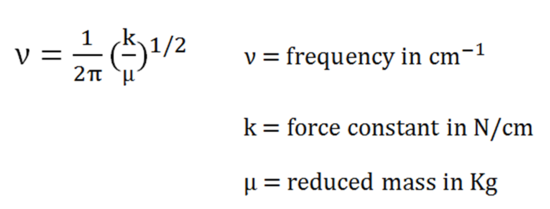
The equation(4) gives the frequency of light that a molecule will absorb, and gives the frequency of vibration of the normal mode excited by that light.
 (4)
(4)
Only two variables in equation(4) are a chemical bond's force constant and reduced mass. Here, the reduced mass refers to (M1M2)/(M1+M2) where M1 and M2 are the masses of the two atoms, respectively. These two molecular properties determine the wavenumber at which a molecule will absorb infrared light. No two chemical substances in the universe have the same force constants and atomic masses, which is why the infrared spectrum of each chemical substance is unique. To understand the effect of atomic masses and force constant on the positions of infrared bands, table 3 and 4 are shown as an example, respectively.
| Bond | C-H Stretch in cm-1 |
| C-1H | ~3000 |
| C-2D | ~2120 |
The reduced masses of C-1H and C-2D are different, but their force constants are the same. By simply doubling the mass of the hydrogen atom, the carbon-hydrogen stretching vibration is reduced by over 800cm-1.
Table 4. An Example of an electronic Effect
| Bond | C-H Stretch in cm-1 |
| C-H | ~3000 |
| H-C=O | ~2750 |
When a hydrogen is attached to a carbon with a C=O bond, the C-H stretch band position decrease to ~2750cm-1. These two C-H bonds have the same reduced mass but different force constants. The oxygen in the second molecule pulls electron density away from the C-H bond so it makes weaken and reduce the C-H force constant. This cause the C-H stretching vibration to be reduced by ~250cm-1.
The Origin of Peak Intensities
The different vibrations of the different functional groups in the molecule give rise to bands of differing intensity. This is because \( \frac{\partial \mu}{\partial x}\) is different for each of these vibrations. For example, the most intense band in the spectrum of octane shown in Figure 3 is at 2971, 2863 cm-1 and is due to stretching of the C-H bond. One of the weaker bands in the spectrum of octane is at 726cm-1, and it is due to long-chain methyl rock of the carbon-carbon bonds in octane. The change in dipole moment with respect to distance for the C-H stretching is greater than that for the C-C rock vibration, which is why the C-H stretching band is the more intense than C-C rock vibration.
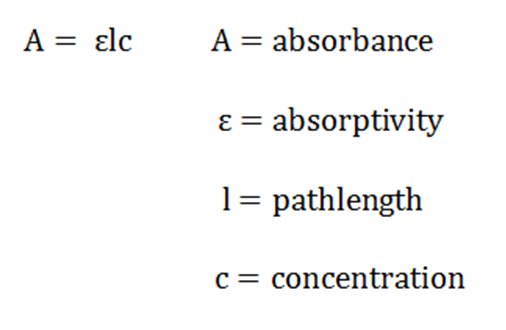
Another factor that determines the peak intensity in infrared spectra is the concentration of molecules in the sample. The equation(5) that relates concentration to absorbance is Beer's law,
 (5)
(5)
The absorptivity is the proportionality constant between concentration and absorbance, and is dependent on (¶µ/¶x)2. The absorptivity is an absolute measure of infrared absorbance intensity for a specific molecule at a specific wavenumber. For pure sample, concentration is at its maximum, and the peak intensities are true representations of the values of ¶µ/¶x for different vibrations. However, in a mixture, two peaks may have different intensities because there are molecules present in different concentration.
The Orgins of Peak Widths
In general, the width of infrared bands for solid and liquid samples is determined by the number of chemical environments which is related to the strength of intermolecular interactions such as hydrogen bonding. Figure 1. shows hydrogen bond in water molecules and these water molecules are in different chemical environments. Because the number and strength of hydrogen bonds differs with chemical environment, the force constant varies and the wavenumber differs at which these molecules absorb infrared light.
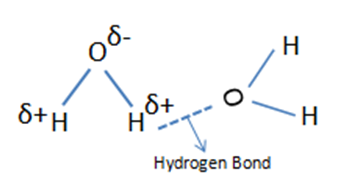
Figure 1. Hydrogen Bonding in water molecules
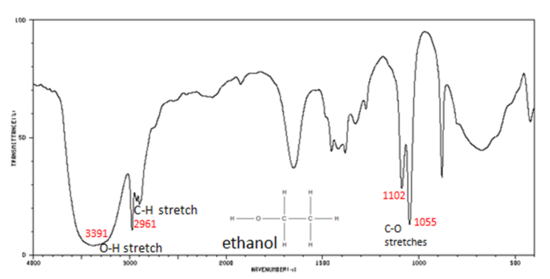
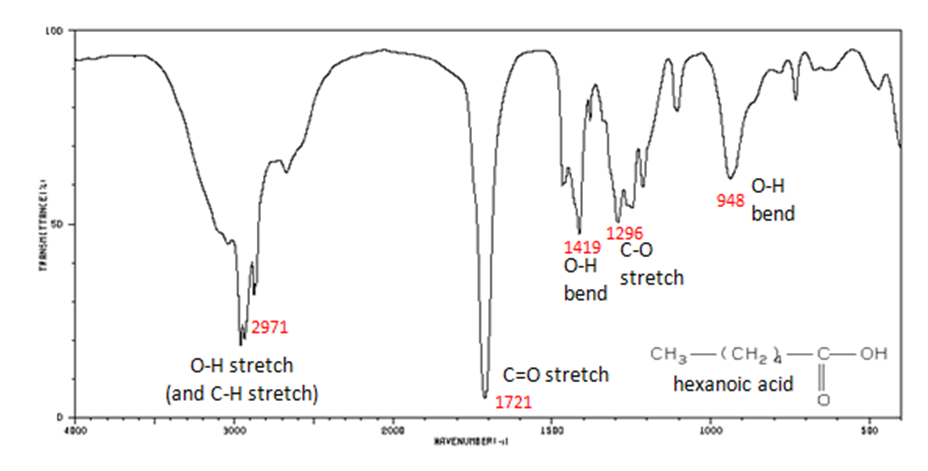
In any sample where hydrogen bonding occurs, the number and strength of intermolecular interactions varies greatly within the sample, causing the bands in these samples to be particularly broad. This is illustrated in the spectra of ethanol(Fig7) and hexanoic acid(Fig11). When intermolecular interactions are weak, the number of chemical environments is small, and narrow infrared bands are observed.
The Origin of Group Frequencies
An important observation made by early researchers is that many functional group absorb infrared radiation at about the same wavenumber, regardless of the structure of the rest of the molecule. For example, C-H stretching vibrations usually appear between 3200 and 2800cm-1 and carbonyl(C=O) stretching vibrations usually appear between 1800 and 1600cm-1. This makes these bands diagnostic markers for the presence of a functional group in a sample. These types of infrared bands are called group frequencies because they tell us about the presence or absence of specific functional groups in a sample.
.gif?revision=1)
Figure 2. Group frequency and fingerprint regions of the mid-infrared spectrum
The region of the infrared spectrum from 1200 to 700 cm-1 is called the fingerprint region. This region is notable for the large number of infrared bands that are found there. Many different vibrations, including C-O, C-C and C-N single bond stretches, C-H bending vibrations, and some bands due to benzene rings are found in this region. The fingerprint region is often the most complex and confusing region to interpret, and is usually the last section of a spectrum to be interpreted. However, the utility of the fingerprint region is that the many bands there provide a fingerprint for a molecule.
Spectral Interpretation by Application of Group Frequencies
Organic Compounds
One of the most common application of infrared spectroscopy is to the identification of organic compounds. The major classes of organic molecules are shown in this category and also linked on the bottom page for the number of collections of spectral information regarding organic molecules.
Hydrocarbons
Hydrocarbons compounds contain only C-H and C-C bonds, but there is plenty of information to be obtained from the infrared spectra arising from C-H stretching and C-H bending.
In alkanes, which have very few bands, each band in the spectrum can be assigned:
- Figure 3. shows the IR spectrum of octane. Since most organic compounds have these features, these C-H vibrations are usually not noted when interpreting a routine IR spectrum. Note that the change in dipole moment with respect to distance for the C-H stretching is greater than that for others shown, which is why the C-H stretch band is the more intense.
.png?revision=1&size=bestfit&width=548&height=282)
In alkenes compounds, each band in the spectrum can be assigned:
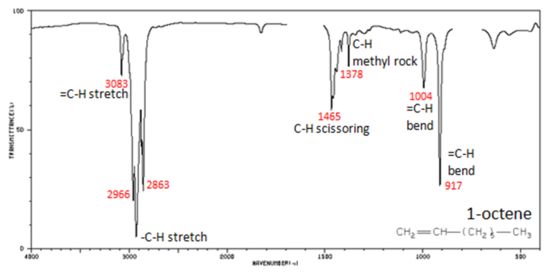
- Figure 4. shows the IR spectrum of 1-octene. As alkanes compounds, these bands are not specific and are generally not noted because they are present in almost all organic molecules.
In alkynes, each band in the spectrum can be assigned:
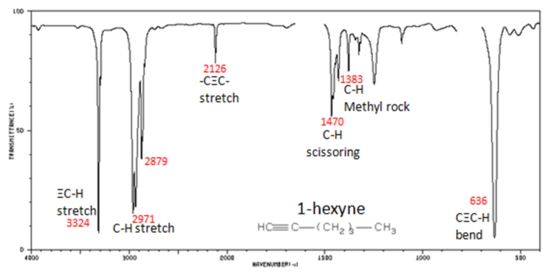
- The spectrum of 1-hexyne, a terminal alkyne, is shown below.
In aromatic compounds, each band in the spectrum can be assigned:
- Note that this is at slightly higher frequency than is the –C–H stretch in alkanes. This is a very useful tool for interpreting IR spectra. Only alkenes and aromatics show a C–H stretch slightly higher than 3000 cm-1.
Figure 6. shows the spectrum of toluene.
Figure 6. Infrared Spectrum of Toluene
Functional Groups Containing the C-O Bond
Alcohols have IR absorptions associated with both the O-H and the C-O stretching vibrations.
- Figure 7. shows the spectrum of ethanol. Note the very broad, strong band of the O–H stretch.
The carbonyl stretching vibration band C=O of saturated aliphatic ketones appears:
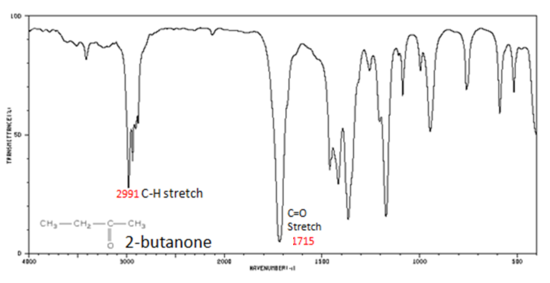
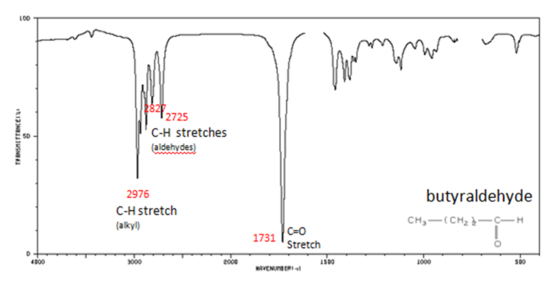
If a compound is suspected to be an aldehyde, a peak always appears around 2720 cm-1 which often appears as a shoulder-type peak just to the right of the alkyl C–H stretches.
- Figure 9. shows the spectrum of butyraldehyde.
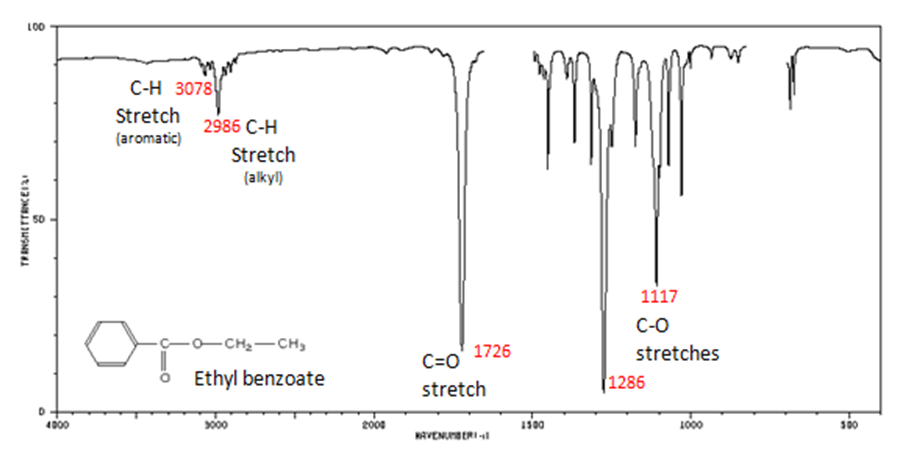
The carbonyl stretch C=O of esters appears:
- Figure 10. shows the spectrum of ethyl benzoate.
The carbonyl stretch C=O of a carboxylic acid appears as an intense band from 1760-1690 cm-1. The exact position of this broad band depends on whether the carboxylic acid is saturated or unsaturated, dimerized, or has internal hydrogen bonding.
- Figure 11. shows the spectrum of hexanoic acid.
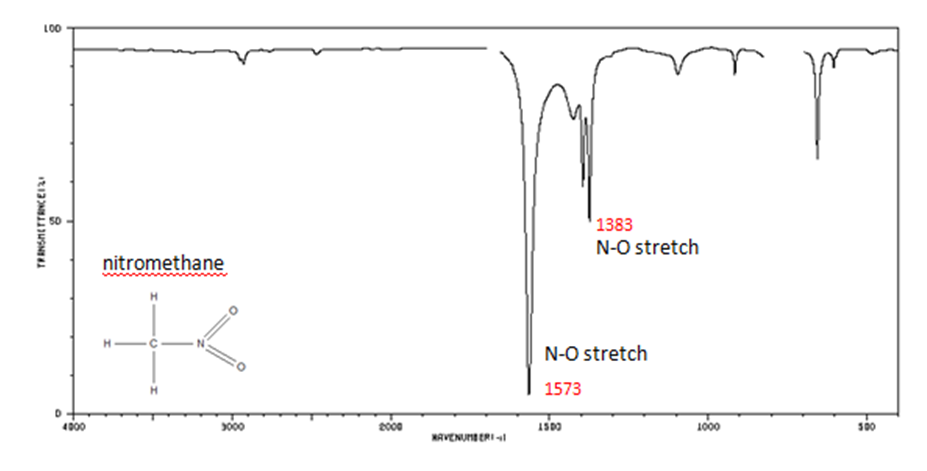
Organic Nitrogen Compounds
Organic Compounds Containing Halogens
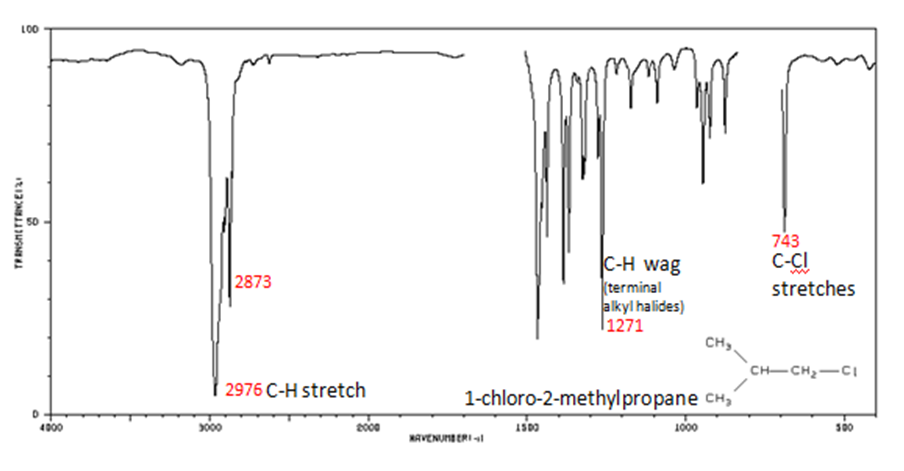
Alkyl halides are compounds that have a C–X bond, where X is a halogen: bromine, chlorine, fluorene, or iodine.
- The spectrum of 1-chloro-2-methylpropane are shown below.
For more Infrared spectra Spectral database of organic molecules is introduced to use free database. Also, the infrared spectroscopy correlation tableis linked on bottom of page to find other assigned IR peaks.
Inorganic Compounds
Generally, the infrared bands for inorganic materials are broader, fewer in number and appear at lower wavenumbers than those observed for organic materials. If an inorganic compound forms covalent bonds within an ion, it can produce a characteristic infrared spectrum.
Main infrared bands of some common inorganic ions:
- Diatomic molecules produce one vibration along the chemical bond. Monatomic ligand, where metal s coordinate with atoms such as halogens, H, N or O, produce characteristic bands. These bands are summarized in below.
Chracteristic infrared bands of diatomic inorganic molecules: M(metal), X(halogen)
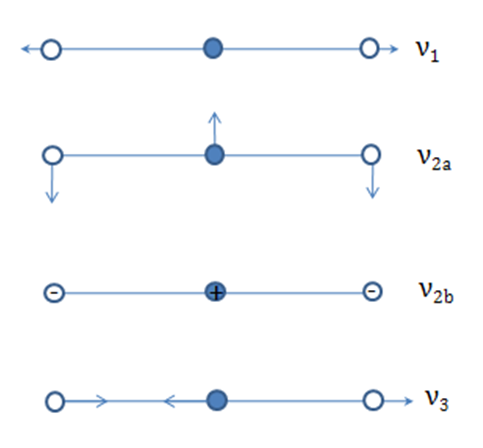
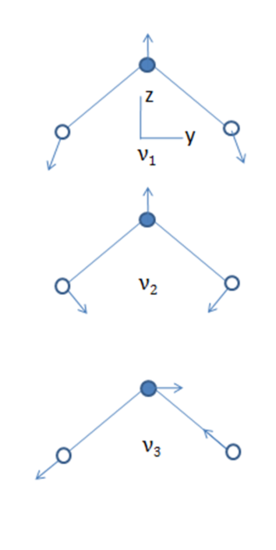
- The normal modes of vibration of linear and bent triatomic molecules are illustrated and some common linear and bent triatomic molecules are shown below. Note that some molecules show two bands for ?1because of Fermi resonance.
Characteristic infrared bands(cm-1) of triatomic inorganic molecules:
1388, 1286 3311 2053 714, 784 327
667 712 486, 471 380 249
2349 2049 748 2219 842
Bent Molecules H2O O3 SnCl 2
3675 1135 354
1595 716 120
3756 1089 334
Identification
There are a few general rules that can be used when using a mid-infrared spectrum for the determination of a molecular structure. The following is a suggested strategy for spectrum interpretation:2
- Infrared spectroscopy is used to analyze a wide variety of samples, but it cannot solve every chemical analysis problem. When used in conjunction with other methods such as mass spectroscopy, nuclear magnetic resonance, and elemental analysis, infrared spectroscopy usually makes possible the positive identification of a sample.
References
- Infrared Spectral Interpretation by Brian Smith, CRC Press, 1999
- Infrared Spectroscopy: Fundamentals and Applications by Barbara Atuart, John Wiley&Sons, Ltd., 2004
- Interpretation of Infrared Spectra, A Practical Approach by John Coates in Encyclopedia of Analytical Chemistry pp. 10815-10837, John Wiley&Sons Ltd, Chichester, 2000
Outside Links
- Spectral Database for Organic Compounds SDBS: http://riodb01.ibase.aist.go.jp/sdbs/ (National Institute of Advanced Industrial Science and Technology, date of access)
- Infrared Spectroscopy Correlation Table: en.Wikipedia.org/wiki/Infrared_spectroscopy_correlation_table
- FDM Reference Spectra Databases: http://www.fdmspectra.com/index.html
- Other Usuful Web Pages:
- www.cem.msu.edu/~reusch/Virtu...d/infrared.htm
- Fermi resonance : en.Wikipedia.org/wiki/Fermi_resonance
- Infrared spectroscopy is used to analyze a wide variety of samples, but it cannot solve every chemical analysis problem. When used in conjunction with other methods such as mass spectroscopy, nuclear magnetic resonance, and elemental analysis, infrared spectroscopy usually makes possible the positive identification of a sample.
- The normal modes of vibration of linear and bent triatomic molecules are illustrated and some common linear and bent triatomic molecules are shown below. Note that some molecules show two bands for ?1because of Fermi resonance.
- Diatomic molecules produce one vibration along the chemical bond. Monatomic ligand, where metal s coordinate with atoms such as halogens, H, N or O, produce characteristic bands. These bands are summarized in below.
- The spectrum of 1-chloro-2-methylpropane are shown below.
- Figure 11. shows the spectrum of hexanoic acid.
- Figure 10. shows the spectrum of ethyl benzoate.
- Figure 9. shows the spectrum of butyraldehyde.
- Figure 7. shows the spectrum of ethanol. Note the very broad, strong band of the O–H stretch.
- Note that this is at slightly higher frequency than is the –C–H stretch in alkanes. This is a very useful tool for interpreting IR spectra. Only alkenes and aromatics show a C–H stretch slightly higher than 3000 cm-1.
- The spectrum of 1-hexyne, a terminal alkyne, is shown below.
- Figure 4. shows the IR spectrum of 1-octene. As alkanes compounds, these bands are not specific and are generally not noted because they are present in almost all organic molecules.