2.2: Mass Spectrometry
- Last updated
- Save as PDF
- Page ID
- 166992
\( \newcommand{\vecs}[1]{\overset { \scriptstyle \rightharpoonup} {\mathbf{#1}} } \)
\( \newcommand{\vecd}[1]{\overset{-\!-\!\rightharpoonup}{\vphantom{a}\smash {#1}}} \)
\( \newcommand{\id}{\mathrm{id}}\) \( \newcommand{\Span}{\mathrm{span}}\)
( \newcommand{\kernel}{\mathrm{null}\,}\) \( \newcommand{\range}{\mathrm{range}\,}\)
\( \newcommand{\RealPart}{\mathrm{Re}}\) \( \newcommand{\ImaginaryPart}{\mathrm{Im}}\)
\( \newcommand{\Argument}{\mathrm{Arg}}\) \( \newcommand{\norm}[1]{\| #1 \|}\)
\( \newcommand{\inner}[2]{\langle #1, #2 \rangle}\)
\( \newcommand{\Span}{\mathrm{span}}\)
\( \newcommand{\id}{\mathrm{id}}\)
\( \newcommand{\Span}{\mathrm{span}}\)
\( \newcommand{\kernel}{\mathrm{null}\,}\)
\( \newcommand{\range}{\mathrm{range}\,}\)
\( \newcommand{\RealPart}{\mathrm{Re}}\)
\( \newcommand{\ImaginaryPart}{\mathrm{Im}}\)
\( \newcommand{\Argument}{\mathrm{Arg}}\)
\( \newcommand{\norm}[1]{\| #1 \|}\)
\( \newcommand{\inner}[2]{\langle #1, #2 \rangle}\)
\( \newcommand{\Span}{\mathrm{span}}\) \( \newcommand{\AA}{\unicode[.8,0]{x212B}}\)
\( \newcommand{\vectorA}[1]{\vec{#1}} % arrow\)
\( \newcommand{\vectorAt}[1]{\vec{\text{#1}}} % arrow\)
\( \newcommand{\vectorB}[1]{\overset { \scriptstyle \rightharpoonup} {\mathbf{#1}} } \)
\( \newcommand{\vectorC}[1]{\textbf{#1}} \)
\( \newcommand{\vectorD}[1]{\overrightarrow{#1}} \)
\( \newcommand{\vectorDt}[1]{\overrightarrow{\text{#1}}} \)
\( \newcommand{\vectE}[1]{\overset{-\!-\!\rightharpoonup}{\vphantom{a}\smash{\mathbf {#1}}}} \)
\( \newcommand{\vecs}[1]{\overset { \scriptstyle \rightharpoonup} {\mathbf{#1}} } \)
\( \newcommand{\vecd}[1]{\overset{-\!-\!\rightharpoonup}{\vphantom{a}\smash {#1}}} \)
\(\newcommand{\avec}{\mathbf a}\) \(\newcommand{\bvec}{\mathbf b}\) \(\newcommand{\cvec}{\mathbf c}\) \(\newcommand{\dvec}{\mathbf d}\) \(\newcommand{\dtil}{\widetilde{\mathbf d}}\) \(\newcommand{\evec}{\mathbf e}\) \(\newcommand{\fvec}{\mathbf f}\) \(\newcommand{\nvec}{\mathbf n}\) \(\newcommand{\pvec}{\mathbf p}\) \(\newcommand{\qvec}{\mathbf q}\) \(\newcommand{\svec}{\mathbf s}\) \(\newcommand{\tvec}{\mathbf t}\) \(\newcommand{\uvec}{\mathbf u}\) \(\newcommand{\vvec}{\mathbf v}\) \(\newcommand{\wvec}{\mathbf w}\) \(\newcommand{\xvec}{\mathbf x}\) \(\newcommand{\yvec}{\mathbf y}\) \(\newcommand{\zvec}{\mathbf z}\) \(\newcommand{\rvec}{\mathbf r}\) \(\newcommand{\mvec}{\mathbf m}\) \(\newcommand{\zerovec}{\mathbf 0}\) \(\newcommand{\onevec}{\mathbf 1}\) \(\newcommand{\real}{\mathbb R}\) \(\newcommand{\twovec}[2]{\left[\begin{array}{r}#1 \\ #2 \end{array}\right]}\) \(\newcommand{\ctwovec}[2]{\left[\begin{array}{c}#1 \\ #2 \end{array}\right]}\) \(\newcommand{\threevec}[3]{\left[\begin{array}{r}#1 \\ #2 \\ #3 \end{array}\right]}\) \(\newcommand{\cthreevec}[3]{\left[\begin{array}{c}#1 \\ #2 \\ #3 \end{array}\right]}\) \(\newcommand{\fourvec}[4]{\left[\begin{array}{r}#1 \\ #2 \\ #3 \\ #4 \end{array}\right]}\) \(\newcommand{\cfourvec}[4]{\left[\begin{array}{c}#1 \\ #2 \\ #3 \\ #4 \end{array}\right]}\) \(\newcommand{\fivevec}[5]{\left[\begin{array}{r}#1 \\ #2 \\ #3 \\ #4 \\ #5 \\ \end{array}\right]}\) \(\newcommand{\cfivevec}[5]{\left[\begin{array}{c}#1 \\ #2 \\ #3 \\ #4 \\ #5 \\ \end{array}\right]}\) \(\newcommand{\mattwo}[4]{\left[\begin{array}{rr}#1 \amp #2 \\ #3 \amp #4 \\ \end{array}\right]}\) \(\newcommand{\laspan}[1]{\text{Span}\{#1\}}\) \(\newcommand{\bcal}{\cal B}\) \(\newcommand{\ccal}{\cal C}\) \(\newcommand{\scal}{\cal S}\) \(\newcommand{\wcal}{\cal W}\) \(\newcommand{\ecal}{\cal E}\) \(\newcommand{\coords}[2]{\left\{#1\right\}_{#2}}\) \(\newcommand{\gray}[1]{\color{gray}{#1}}\) \(\newcommand{\lgray}[1]{\color{lightgray}{#1}}\) \(\newcommand{\rank}{\operatorname{rank}}\) \(\newcommand{\row}{\text{Row}}\) \(\newcommand{\col}{\text{Col}}\) \(\renewcommand{\row}{\text{Row}}\) \(\newcommand{\nul}{\text{Nul}}\) \(\newcommand{\var}{\text{Var}}\) \(\newcommand{\corr}{\text{corr}}\) \(\newcommand{\len}[1]{\left|#1\right|}\) \(\newcommand{\bbar}{\overline{\bvec}}\) \(\newcommand{\bhat}{\widehat{\bvec}}\) \(\newcommand{\bperp}{\bvec^\perp}\) \(\newcommand{\xhat}{\widehat{\xvec}}\) \(\newcommand{\vhat}{\widehat{\vvec}}\) \(\newcommand{\uhat}{\widehat{\uvec}}\) \(\newcommand{\what}{\widehat{\wvec}}\) \(\newcommand{\Sighat}{\widehat{\Sigma}}\) \(\newcommand{\lt}{<}\) \(\newcommand{\gt}{>}\) \(\newcommand{\amp}{&}\) \(\definecolor{fillinmathshade}{gray}{0.9}\)Principles of Mass Spectrometry and Modern Applications
Mass spectrometry (MS) is a powerful characterization technique used for the identification of a wide variety of chemical compounds. At its simplest, MS is merely a tool for determining the molecular weight of the chemical species in a sample. However, with the high resolution obtainable from modern machines, it is possible to distinguish isomers, isotopes, and even compounds with nominally identical molecular weights. Libraries of mass spectra have been compiled which allow rapid identification of most known compounds, including proteins as large as 100 kDa (100,000 amu).
Mass spectrometers separate compounds based on a property known as the mass-to-charge ratio. The sample to be identified is first ionized, and then passed through some form of magnetic field. Based on parameters such as how long it takes the molecule to travel a certain distance or the amount of deflection caused by the field, a mass can be calculated for the ion. As will be discussed later, there are a wide variety of techniques for ionizing and detecting compounds.
Limitations of MS generally stem from compounds that are not easily ionizable, or which decompose upon ionization. Geometric isomers can generally be distinguished easily, but differences in chirality are not easily resolved. Complications can also arise from samples which are not easily dissolved in common solvents.
Ionization Techniques
Electron Impact (EI)
In electon impact ionization, a vaporized sample is passed through a beam of electrons. The high energy (typically 70 eV) beam strips electrons from the sample molecules leaving a positively charged radical species. The molecular ion is typically unstable and undergoes decomposition or rearrangement to produce fragment ions. Because of this, electron impact is classified as a “hard” ionization technique. With regards to metal-containing compounds, fragments in EI will almost always contain the metal atom (i.e., [MLn]+•fragments to [MLn-1]+ + L•, not MLn-1• + L+). One of the main limitations of EI is that the sample must be volatile and thermally stable.
Chemical Ionization (CI)
In chemical ionization, the sample is introduced to a chamber filled with excess reagent gas (such as methane). The reagent gas is ionized by electrons, forming a plasma with species such as CH5+, which react with the sample to form the pseudomolecular ion [M+H]+. Because CI does not involve radical reactions, fragmentation of the sample is generally much lower than that of EI. CI can also be operated in negative mode (to generate anions) by using different reagent gases. For example, a mixture of CH4 and NO2 will generate hydroxide ions, which can abstract protons to yield the [M-H]- species. A related technique, atmospheric pressure chemical ionization (APCI) delivers the sample as a neutral spray, which is then ionized by corona discharge, producing ions in a similar manner as described above. APCI is particularly suited for low molecular weight, nonpolar species that cannot be easily analyzed by other common techniques such as ESI.
Field Ionization/Desorption
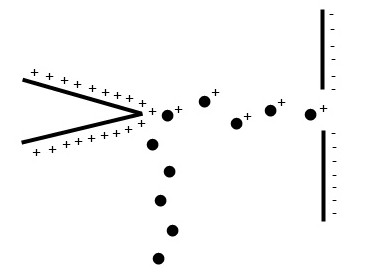
Field ionization and desorption are two closely related techniques which use quantum tunneling of electrons to generate ions. Typically, a highly positive potential is applied to an electrode with a sharp point, resulting in a high potential gradient at the tip Figure \(\PageIndex{1}\). As the sample reaches this field, electron tunneling occurs to generate the cation, which is repelled into the mass analyzer. Field ionization utilizes gaseous samples whereas in field desorption the sample is adsorbed directly onto the electrode. Both of these techniques are soft, resulting in low energy ions which do not easily fragment.
Electrospray Ionization (ESI)
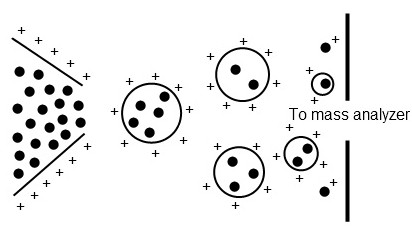
In ESI, a highly charged aerosol is generated from a sample in solution. As the droplets shrink due to evaporation, the charge density increases until a coulombic explosion occurs, producing daughter droplets that repeat the process until individualized sample ions are generated (Figure \(\PageIndex{2}\). One of the limitations of is the requirement that the sample be soluble. ESI is best applied to charged, polar, or basic compounds.
Matrix Assisted Laser Desorption Ionization (MALDI)
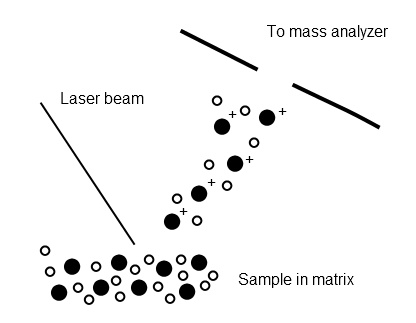
Laser desorption ionization generates ions by ablation from a surface using a pulsed laser. This technique is greatly improved by the addition of a matrix co-crystallized with the sample. As the sample is irradiated, a plume of desorbed molecules is generated. It is believed that ionization occurs in this plume due to a variety of chemical and physical interactions between the sample and the matrix (Figure \(\PageIndex{3}\)). One of the major advantages of MALDI is that it produces singly charged ions almost exclusively and can be used to volatilize extremely high molecular weight species such as polymers and proteins. A related technique, desorption ionization on silicon (DIOS) also uses laser desorption, but the sample is immobilized on a porous silicon surface with no matrix. This allows the study of low molecular weight compounds which may be obscured by matrix peaks in conventional MALDI.
Inductively Coupled Plasma Mass Spectrometry (ICP-MS)
A plasma torch generated by electromagnetic induction is used to ionize samples. Because the effective temperature of the plasma is about 10,000 °C, samples are broken down to ions of their constituent elements. Thus, all chemical information is lost, and the technique is best suited for elemental analysis. ICP-MS is typically used for analysis of trace elements.
Fast Atom Bombardment (FAB) and Secondary Ion Mass Spectrometry (SIMS)
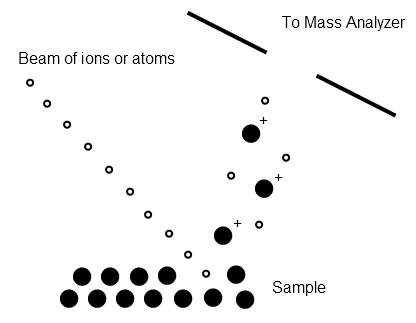
Both of these techniques involve sputtering a sample to generate individualized ions; FAB utilizes a stream of inert gas atoms (argon or xenon) whereas SIMS uses ions such as Cs+. Ionization occurs by charge transfer between the ions and the sample or by protonation from the matrix material (Figure \(\PageIndex{4}\)). Both solid and liquid samples may be analyzed. A unique aspect of these techniques for analysis of solids is the ability to do depth profiling because of the destructive nature of the ionization technique.
Choosing an Ionization Technique
Depending on the information desired from mass spectrometry analysis, different ionization techniques may be desired. For example, a hard ionization method such as electron impact may be used for a complex molecule in order to determine the component parts by fragmentation. On the other hand, a high molecular weight sample of polymer or protein may require an ionization method such as MALDI in order to be volatilized. Often, samples may be easily analyzed using multiple ionization methods, and the choice is simplified to choosing the most convenient method. For example, electrospray ionization may be easily coupled to liquid chromatography systems, as no additional sample preparation is required. Table \(\PageIndex{1}\) provides a quick guide to ionization techniques typically applied to various types of samples.
| Information Desired | Ionization Technique |
| Elemental analysis | Inductively coupled plasma |
| Depth profiling | Fast atom bombardment/secondary ion mass spectroscopy |
| Chemical speciation/component analysis (fragmentation desired) | Electron impact |
| Molecular species identification of compounds soluble in common solvents | Electrospray ionization |
| Molecular species identification of hydrocarbon compounds | Field ionization |
| Molecular species identification of high molecular weight compounds | Matrix assisted laser desorption ionization |
| Molecular species identification of halogen containing compounds | Chemical ionization (negative mode) |
Mass Analyzers
Sectors
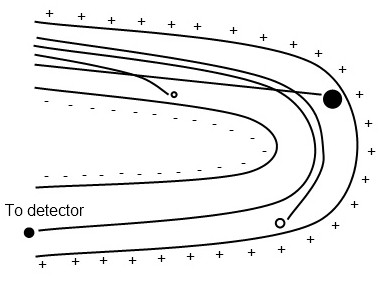
A magnetic or electric field is used to deflect ions into curved trajectories depending on the m/z ratio, with heavier ions experiencing less deflection (Figure \(\PageIndex{5}\)). Ions are brought into focus at the detector slit by varying the field strength; a mass spectrum is generated by scanning field strengths linearly or exponentially. Sector mass analyzers have high resolution and sensitivity, and can detect high mass ranges, but are expensive, require large amounts of space, and are incompatible with the most popular ionization techniques MALDI and ESI.
Time of Flight (TOF)
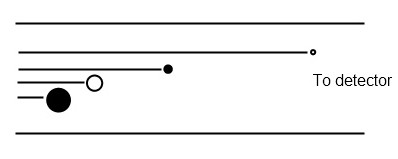
The amount of time required for an ion to travel a known distance is measured (Figure \(\PageIndex{6}\)). A pulse of ions is accelerated through and electric analyzer such that they have identical kinetic energies. As a result, their velocity is directly dependent on their mass. Extremely high vacuum conditions are required to extend the mean free path of ions and avoid collisions. TOF mass analyzers are fastest, have unlimited mass ranges, and allow simultaneous detection of all species, but are best coupled with pulsed ionization sources such as MALDI.
Quadropole
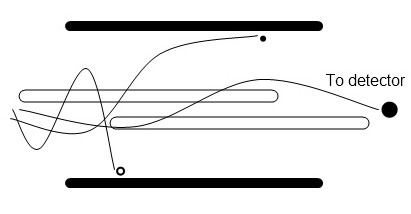
Ions are passed through four parallel rods which apply a varying voltage and radiofrequency potential (Figure \(\PageIndex{7}\)). As the field changes, ions respond by undergoing complex trajectories. Depending on the applied voltage and RF frequencies, only ions of a certain m/z ratio will have stable trajectories and pass through the analyzer. All other ions will be lost by collision with the rods. Quadrupole analyzers are relatively inexpensive, but have limited resolution and low mass range.
Ion Trap
Ion traps operate under the same principle as quadrupole, but contain the ions in space. Electrodes can be manipulated to selectively eject ions of desired m/z ratios, allowing for mass analysis. Ion traps are uniquely suited for repeated cycles of mass spectrometry because of their ability to retain ions of desired m/z ratios. Selected fragments can be further fragmented by collision induced dissociation with helium gas. Ion traps are compact, relatively inexpensive, and can be adapted to many hybrid instruments.
Coupling Mass Spectrometry to Other Instruments
Mass spectrometry is a powerful tool for identification of compounds, and is frequently combined with separation techniques such as liquid or gas chromatography for rapid identification of the compounds within a mixture. Typically, liquid chromatography systems are paired with ESI-quadrupole mass spectrometers to take advantage of the solvated sample. GC-MS systems usually employ electron impact ionization and quadrupole or ion trap mass analyzers to take advantage of the gas-phase molecules and fragmentation libraries associated with EI for rapid identification.
Mass spectrometers are also often coupled in tandem to form MS-MS systems. Typically the first spectrometer utilizes a hard ionization technique to fragment the sample. The fragments are passed on to a second mass analyzer where they may be further fragmented and analyzed. This technique is particularly important for studying large, complex molecules such as proteins.
Fast Atom Bombardment
Fast atom bombardment (FAB) is an ionization technique for mass spectroscopy employing secondary ion mass spectroscopy (SIMS). Before the appearance of this technique, there was only limited way to obtain the mass spectrum of the intact oligopeptide which is not easy to be vaporized. Prior to 1970, electron ionization (EI) or chemical ionization (CI) was widely used but those methods require the destructive vaporization of the sample. Field desorption of ions with nuclear fission overcame this problem though due to the necessity of special technique and nuclear fission of 252Cf limits the generality of this approach. FAB became prevalent solving those underlying problems by using bombardment of fast atom or ion which has high kinetic energy onto the sample in matrix.
Principle
The FAB utilizes the bombardment of accelerated atom or ion beams and the ionized sample is emitted by the collision of the beams and the sample in matrix. In this section, the detail of each step is discussed.
Atom Beam
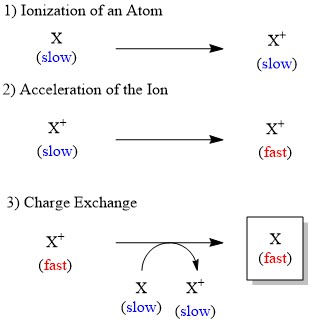
Although ions can be accelerated by electric field relatively easily, that is not the case for the neutral atom. Therefore, in the FAB conversion of neutral atom into ion is significant to generate the accelerated species. The fast atom such as xenon used for the bombardment is produced through three steps (Figure \(\PageIndex{8}\)):
- Ionization of the atom by collision with electron.
- Acceleration of the generated ion through high electric potential.
- Electron transfer from the accelerated ion to another slow atom, affording the desired accelerated atom.
Ion Beam
In the same way as the atom beam, a fast ion beam also can be used. Although cesium ion (Cs+) cheaper and heavier than xenon is often employed, they have drawback that the mass spectroscopy can be contaminated by the ions.
Bombardment
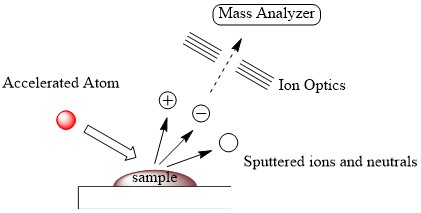
The obtained fast atom or ion is then bombarded to the sample in matrix which is a type of solvent having high boiling point, resulting in momentum transfer and vaporization of the sample (Figure \(\PageIndex{9}\)). The fast atom used for the bombardment is called primary beam of atoms or ions while secondary beam of atoms or ions corresponds to the sputtered ions and neutrals. The ionized sample is directed by ion optics, leading to the detection of those ion in mass analyzer.
Matrices
One of the crucial characteristics of FAB is using liquid matrix. For example, long-lived signal in FAB is responsible for using matrix. Due to the high vacuum condition, usual solvent for chemistry laboratory such as water and other common organic solvent is precluded for FAB and, therefore, solvent with high boiling point called matrix is necessary to be employed. Table \(\PageIndex{1}\) shows examples of matrix.
| Matrix | Observed Ions (m/z) |
| Glycerol | 93 |
| Thioglycerol | 109 |
| 3-Nitrobenzyl alcohol (3-NOBA) | 154 |
| n-Octyl-3-nitrophenylether (NOP) | 252 |
| Triethanolamine | 150 |
| Diethanolamine | 106 |
| Polyethylene glycol (mixtures) | Dependent on the glycol used |
Instrument
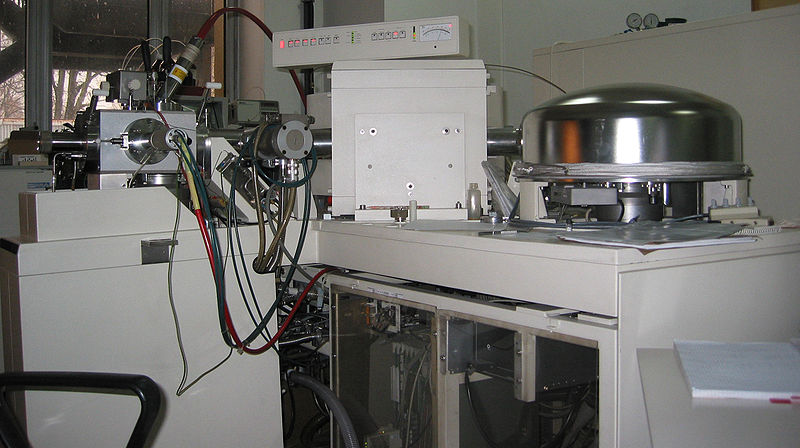
An image of a typical instrument for fast atom bombardment mass spectrometry is shown in Figure \(\PageIndex{10}\).
Spectra
The obtained spectrum by FAB has information of structure or bond nature of the compound in addition to the mass. Here, three spectrum are shown as examples.
Glycerol
Typical FAB mass spectrum of glycerol alone is shown in Figure \(\PageIndex{11}\).
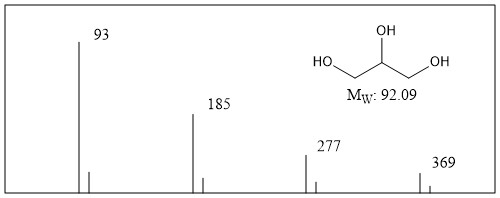
Glycerol shows signal at m/z 93 which is corresponding to the protonated glycerol with small satellite derived from isotope of carbon (13C). At the same time, signals for cluster of protonated glycerol are also often observed at m/z 185, 277, and 369. As is seen in this example, signal from aggregation of the sample also can be detected and this will provide the information of the sample.
Sulfonated Azo Compound
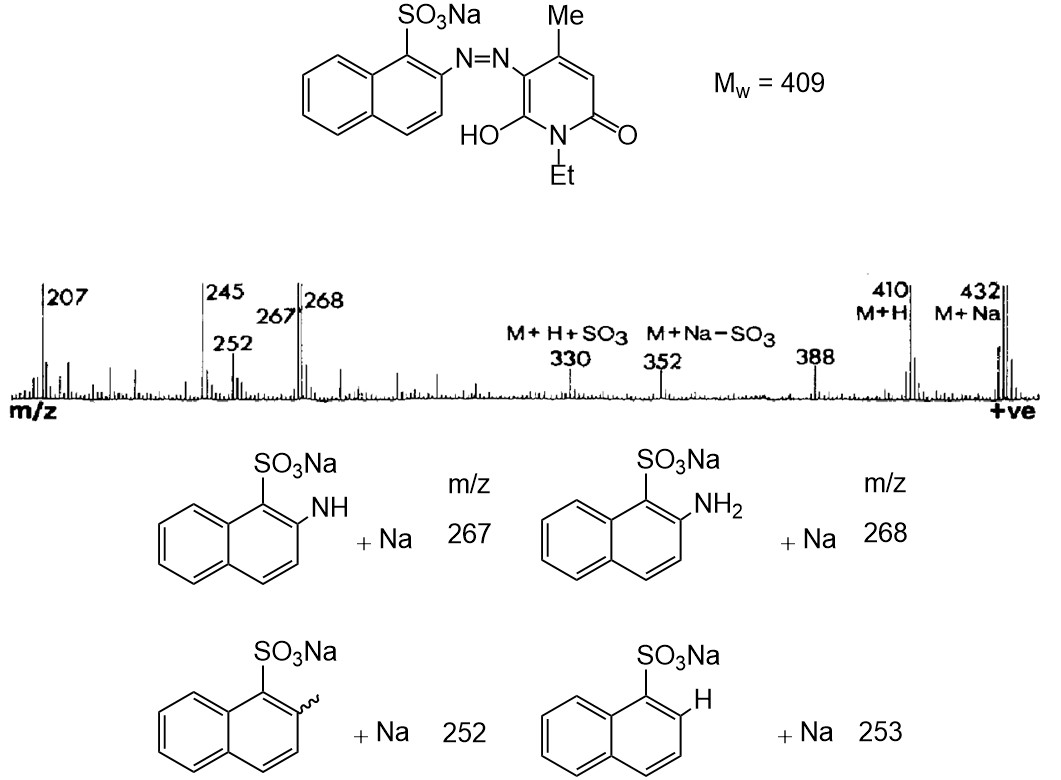
Figure \(\PageIndex{12}\) shows positive FAB spectrum of sulfonated azo compound X and structure of the plausible fragments in the spectrum. The signal of the target compound X (Mw = 409) was observed at m/z 432 and 410 as an adduct with sodium and proton, respectively. Because of the presence of some type of relatively weak bonds, several fragmentation was observed. For example, signal at m/z 352 and 330 resulted from the cleavage of aryl-sulfonate bond. Also, nitrogen-nitrogen bond cleavage in the azo moiety occurred, producing the fragment signal at m/z 267 and 268. Furthermore, taking into account the fact that favorable formation of nitrogen-nitrogen triple bond from azo moiety, aryl-nitrogen bond can be cleaved and in fact those were detected at m/z 253 and 252. As is shown in these example, fragmentation can be used for obtaining information regarding structure and bond nature of desired compound.
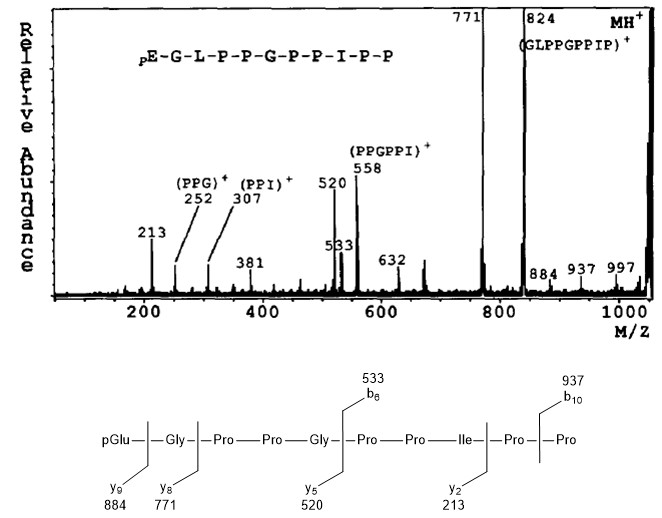
Bradykinin Potentiator C
The mass spectrum of protonated molecule (MH+ = m/z 1052) of bradykinin potentiator C is shown in Figure \(\PageIndex{13}\). In this case fragmentation occurs between certain amino acids, affording the information of peptide sequence. For example, signal at m/z 884 is corresponding to the fragment as a result of scission of Gly-Leu bond. It should be noted that the pattern of fragmentation is not only done by one type of bond cleavage. Fragmentation at the bond between Gly-Pro is a good example; two type of fragment (m/z 533 and 520) are observed. Thus, pattern of fragmentation can afford the information of sequence of peptide.
Secondary Ion Mass Spectrometry (SIMS)
Secondary ion mass spectrometry (SIMS) is an analytical method which has very low detection limits, is capable of analyzing over a broad dynamic range, has high sensitivity, and has high mass resolution. In this technique, primary ions are used to sputter a solid (and sometimes a liquid) surface of any composition. This causes the emission of electrons, ions, and neutral species, so called secondary particles, from the solid surface. The secondary ions are then analyzed by a mass spectrometer. Depending on the operating mode selected, SIMS can be used for surface composition and chemical structure analysis, depth profiling, and imaging.
Theory
Of all the secondary particles that are sputtered from the sample surface, only about 1 in every 1,000 is emitted as an ion. Because only the ions may be detected by mass spectrometry, an understanding of how these secondary ions form is important.
Sputtering Models
Sputtering can be defined as the emission of atoms, molecules, or ions from a target surface as a result of particle bombardment of the surface. This phenomenon has been described by two different sets of models.
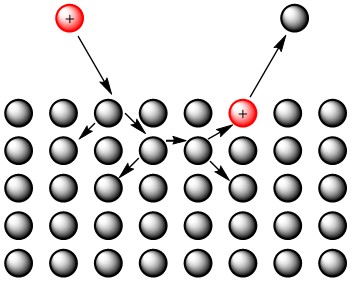
The first approach to describe sputtering, called linear collision cascade theory, compares the atoms to billiard balls and assumes that atomic collisions are completely elastic. Although there are a few different types of sputtering defined by this model, the type which is most important to SIMS is slow collisional sputtering. In this type of sputtering, the primary ion collides with the surface of the target and causes a cascade of random collisions between the atoms in the target. Eventually, these random collisions result in the emission of an atom from the target surface, as can be seen in Figure \(\PageIndex{14}\). This model does not take into account the location of atoms- it only requires that the energy of the incoming ion be higher than the energy required to sublimate atoms from the target surface.
Despite that fact that this method makes oversimplifications regarding atomic interactions and structure, its predicted sputter yield data is actually fairly close to the experimental data for elements such as Cu, Zn, Ag, and Au, which have high sputter yields. However, for low sputter yield elements, the model predicts three times more sputtered ions than what is actually observed.
The second method to describe sputtering uses computer-generated three-dimensional models of the atoms and molecules in the sample to predict the effect of particle bombardment. All models under this category describe the target solid in terms of its constituent atoms and molecules and their interactions with one another. However, these models only take into account atomic forces (not electronic forces) and describe atomic behavior using classical mechanics (not quantum mechanics). Two specific examples of this type of model are:
- The molecular dynamics model
- The binary collision approximation.
Ionization Models
The ionization models of sputtering can be divided into two categories, theories that predict ionization outside the target and theories that predict that they are generated inside the target. In the theories that describe ionization outside of the target, the primary particle strikes the target, causing the emission of an excited atom or molecule from the target. This particle relaxes by emitting an Auger electron, thus becoming an ion. Because no simple mathematical equation has been described for this theory, it is of little practical use. For this reason, ionization inside the target models are used more often. Additionally, it has been shown that ionization occurs more often inside the target. Although there are many models that describe ionization within the target, two representative models of this type are the bond-breaking model and the local thermal equilibrium theory.
In the bond breaking model, the primary particle strikes the target and causes the heterolytic cleavage of a bond in the target. So, either an anion or a cation is emitted directly from the target surface. This is an important model to mention because it has useful implications. Stated simply, the yield of positive ions can be increased by the presence of electronegative atoms in the target, in the primary ion beam, or in the sample chamber in general. The reverse is also true- the negative ion yield may be increased by the presence of electropositive atoms.
The local thermal equilibrium theory can be described as an expansion of the bond breaking model. Here, the increase in yield of positive ions when the target is in the presence of electronegative atoms is said to be the result of the high potential barrier of the metal oxide which is formed. This results in a low probability of the secondary ion being neutralized by an electron, thus giving a high positive ion yield.
Instrumentation
Primary Ion Sources
The primary ions in a SIMS instrument (labeled “Primary ion source” in Figure \(\PageIndex{15}\)) are generated by one of three types of ion guns. The first type, called an electron bombardment plasma source, uses accelerating electrons (produced from a heated filament) to bombard an anode. If the energy of these electrons is two to three times higher than the ionization energy of the atom, ionization occurs. Once a certain number of ions and electrons are obtained, a plasma forms. Then, an extractor is used to make a focused ion beam from the plasma.
In the second type of source, called the liquid metal source, a liquid metal film flows over a blunt needle. When this film is subjected to a strong electric field, electrons are ejected from the atoms in the liquid metal, leaving them ionized. An extractor then directs the ions out of the ion gun.
The last source is called a surface ionization source. Here, atoms of low ionization energy are absorbed onto a high work function metal. This type of system allows for the transfer of electrons from the surface atoms to the metal. When the temperature is increased, more atoms (or ions) leave the surface than absorb on the surface, causing an increase in absorbed ions compared to absorbed atoms. Eventually, nearly all of the atoms that leave the surface are ionized and can be used as an ion beam.
The type of source used depends on the type of SIMS experiment which is going to be run as well as the composition of the sample to be analyzed. A comparison of the three different sources is given in Table \(\PageIndex{2}\).
| Source | Spot Size (µm) | Brightness (A/m2Sr) | Energy Speed (eV) | Ion Type |
| Electron Bombardment Plasma | 1 | 104-107 | <10 | Ar+, Xe+, O2+ |
| Liquid Metal | 0.05 | 1010 | >10 | Ga+, In+,Cs+ |
| Surface Ionization | 0.1 | 107 | <1 | Cs+ |
Of the three sources, electron bombardment plasma has the largest spot size. Thus, this source has a high-diameter beam and does not have the best spatial resolution. For this reason, this source is commonly used for bulk analysis such as depth profiling. The liquid metal source is advantageous for imaging SIMS because it has a high spatial resolution (or low spot size). Lastly, the surface ionization source works well for dynamic SIMS (see above)
because its very small energy spread allows for a uniform etch rate.
In addition to the ion gun type, the identity of the primary ion is also important. O2+ and Cs+ are commonly used because they enhance the positive or negative secondary ion yield, respectively. However, use of the inert gas plasma source is advantageous because it allows for surface studies without reacting with the surface itself. Using the O2+ plasma source allows for an increased output of positively charged secondary ions, but it will alter the surface that is being studied. Also, a heavy primary ion allows for better depth resolution because it does not penetrate as far into the sample as a light ion.
Sputtering
The sputter rate, or the number of secondary ions that are removed from the sample surface by bombardment by one primary ion, depends both on the properties of the target and on the parameters of the primary beam.
There are many target factors that affect the sputter rate. A few examples are crystal structure and the topography of the target. Specifically, hexagonal close-packed crystals and rough surfaces give the highest sputter yield. There are many other properties of the target which effect sputtering, but they will not be discussed here.
As was discussed earlier, different primary ion sources are used for different SIMS applications. In addition to the source used, the manner in which the source is used is also important. First, the sputter rate can be increased by increasing the energy of the beam. For example, using a beam of energy greater than 10 keV gives a maximum of 10 sputtered particles per primary ion impact. Second, increasing the primary ion mass will also increase the secondary ion yield. Lastly, the angle of incidence is also important. It has been found that a maximum sputter rate can be achieved if the angle of impact is 70° relative to the surface normal.
Mass Spectrometers
The detector which measures the amount and type of secondary ions sputtered from the sample surface is a mass spectrometer. See Figure \(\PageIndex{15}\) for a diagram that shows where the mass spectrometer is relative to the other instrument components. The type of analysis one wishes to do determines which type of spectrometer is used. Both dynamic and static SIMS usually use a magnetic sector mass analyzer because it has a high mass resolution. Static SIMS (as well as imaging SIMS) may also use a time-of-flight system, which allows for high transmission. A description of how each of these mass spectrometers works and how the ions are detected can be found elsewhere (see https://cnx.org/contents/kl4gTdhf@1/Principles-of-Mass-Spectrometry-and-Modern-Applications).

Samples
SIMS can be used to analyze the surface and about 30 µm below the surface of almost any solid sample and some liquid samples. Depending on the type of SIMS analysis chosen, it is possible to obtain both qualitative and quantitative data about the sample.
Technique Selection
There are three main types of SIMS experiments: Dynamic SIMS, static SIMS, and imaging SIMS.
In dynamic SIMS analysis, the target is sputtered at a high rate. This allows for bulk analysis when the mass spectrometer is scanned over all mass ranges to get a mass spectrum and multiple measurements in different areas of the sample are taken. If the mass spectrometer is set to rapidly analyze individual masses sequentially as the target is eroded rapidly, it is possible to see the depth at which specific atoms are located up to 30 µm below the sample surface. This type of analysis is called a depth profile. Depth profiling is very useful because it is a quantitative method- it allows for the calculation of concentration as a function of depth so long as ion-implanted standards are used and the crater depth is measured. See the previous section for more information on ion-implants.
SIMS may also be used to obtain an image in a way similar to SEM while giving better sensitivity than SEM. Here, a finely focused ion beam (rather than an electron beam, as in SEM) is raster-scanned over the target surface and the resulting secondary ions are analyzed at each point. Using the identity of the ions at each analyzed spot, an image may be assembled based on the distributions of these ions.
In static SIMS, the surface of the sample is eroded very slowly so that the ions which are emitted are from areas which have not already been altered by the primary ion. By doing this, it is possible to identify the atoms and some of the molecules just on the surface of the sample.
An example that shows the usefulness of SIMS is the analysis of fingerprints using this instrument. Many other forms of analysis have been employed to characterize the chemical composition of fingerprints such as GC-MS. This is important in forensics to determine fingerprint degradation, to detect explosives or narcotics, and to help determine age of the person who left the print by analyzing differences in sebaceous secretions. Compared to GC-MS, SIMS is a better choice of analysis because it is relatively less destructive. In order to do a GC-MS, the fingerprint must be dissolved. SIMS, on the other hand, is a solid state method. Also, because SIMS only erodes through a few monolayers, the fingerprint can be kept for future analysis and for record-keeping. Additionally, SIMS depth profiling allows the researcher to determine the order in which substances were touched. Lastly, an image of the fingerprint can be obtained using the imaging SIMS analysis.
Sample Preparation
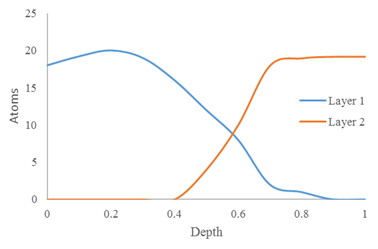
As with any other instrumental analysis, SIMS does require some sample preparation. First, rough samples may require polishing because the uneven texture will be maintained as the surface is sputtered. Because surface atoms are the analyte in imaging and static SIMS, polishing is obviously not required. However, it is required for depth profiling. Without polishing, layers beneath the surface of the sample will appear to be mixed with the upper layer in the spectrum, as can be seen in Figure \(\PageIndex{16}\).
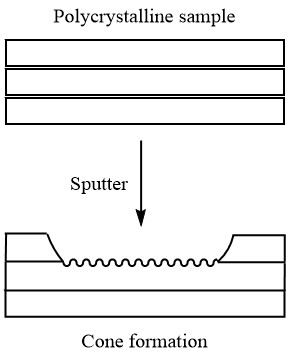
But, polishing before analysis does not necessarily guarantee even sputtering. This is because different crystal orientations sputter at different rates. So, if the sample is polycrystalline or has grain boundaries (this is often a problem with metal samples), the sample may develop small cones where the sputtering is occurring, leading to an inaccurate depth profile, as is seen in Figure \(\PageIndex{17}\).
Analyzing insulators using SIMS also requires special sample preparation as a result of electrical charge buildup on the surface (since the insulator has no conductive path to diffuse the charge through). This is a problem because it distorts the observed spectra. To prevent surface charging, it is common practice to coat the sample with a conductive layer such as gold.
Once the sample has been prepared for analysis, it must be mounted to the sample holder. There are a few methods to doing this. One way is to place the sample on a spring loaded sample holder which pushes the sample against a mask. This method is advantageous because the researcher doesn’t have to worry about adjusting the sample height for different samples (see below to find out why sample height is important). However, because the mask is on top of the sample, it is possible to accidentally sputter the mask. Another method used to mount samples is to simply glue them to a backing plate using silver epoxy. This method requires drying under a heat lamp to ensure that all volatiles are evaporated off the glue before analysis. Alternatively, the sample can be pressed in a soft metal like indium. The last two methods are especially useful for mounting of insulating samples, since they provide a conductive path to help prevent charge buildup.
When loading the mounted sample into the instrument, it is important that the sample height relative to the instrument lens is correct. If the sample is either too close or too far away, the secondary ions will either not be detected or they will be detected at the edge of the crater being produced by the primary ions (see Figure \(\PageIndex{18}\)). Ideally, the secondary ions that are analyzed should be those resulting from the center of the primary beam where the energy and intensity are most uniform.

Standards
In order to do quantitative analysis using SIMS, it is necessary to use calibration standards since the ionization rate depends on both the atom (or molecule) and the matrix. These standards are usually in the form of ion implants which can be deposited in the sample using an implanter or using the primary ion beam of the SIMS (if the primary ion source is mass filtered). By comparing the known concentration of implanted ions to the number of sputtered implant ions, it is possible to calculate the relative sensitivity factor (RSF) value for the implant ion in the particular sample. By comparing this RSF value to the value in a standard RSF table and adjusting all the table RSF values by the difference between them, it is possible to calculate the concentrations of other atoms in the sample. For more information on RSF values, see above.
When choosing an isotope to use for ion implantation, it is important take into consideration possible mass interferences. For example, 11B, 16O, and 27Al have the same overall masses and will interfere with each others ion intensity in the spectra. Therefore, one must chose an ion implant that does not have the same mass as any other species in the sample which are of interest.
Also, the depth at which the implant is deposited is also important. The implanted ion must be lower than the equilibration depth, above which, chaotic sputtering occurs until a sputter equilibrium is reached. However, care should be taken to ensure that the implanted ions do not pass the layer of interest in the sample- if the matrix changes, the implanted ions will no longer sputter at the same rate, causing concentrations to be inaccurate.
Matrix Effects
In SIMS, matrix effects are common and originate from changes in the ionization efficiency (the number of ionized species compared to totally number of sputtered species) and the sputtering yield. One of the main causes of matrix effects is the primary beam. As was discussed earlier, electronegative primary ions increases the number of positively charged secondary ions, while electropositive primary ions increases the number of negatively charged secondary ions. Matrix effects can also be caused by species present in the sample. The consequences of these matrix effects depends on the identity of the effecting species and the composition of the sample. To correct for matrix effects, it is necessary to use a standards and compare the results with RSFs (see above).
Detection Limits
For most atoms, SIMS can accurately detect down to a concentration of 1ppm. For some atoms, a concentration of 10 ppb may be achieved. The detection limit in this instrument is set by the count rate (how many ions may be counted per second) rather than by a limitation due to the mass of the ion. So, to decrease detection limit, the sample can be sputtered at a higher rate.
Sensitivity
The sensitivity of SIMS analysis depends on the element of interest, the matrix the element is in, and what primary ion is used. The sensitivity of SIMS towards a particular ion may easily be determined by looking at an RSF table. So, for example, looking at an RSF table for an oxygen primary ion and positive secondary ions shows that the alkali metals have the highest sensitivity (they have low RSF values). This makes sense, since these atoms have the lowest electron affinities and are the easiest to ionize. Similarly, looking at the RSF table for a cesium primary ion beam and negative secondary ions shows that the halogens have the highest sensitivity. Again, this makes sense since the halogens have the highest electron affinities and accept electrons easily.
Data Interpretation
Three types of spectra can be obtained from a SIMS analysis. From static SIMS, a mass spectrum is produced. From dynamic SIMS, a depth profile or mass spectrum is produced. And, not surprisingly, an image is produced from imaging SIMS.
Mass Spectra
As with a typical mass spectrum, the mass to charge ratio (m/z) is compared to the ion intensity. However, because SIMS is capable of a dynamic range of 9 orders of magnitude, the intensity of the SIMS mass spectra is displayed on a logarithmic scale. From this data, it is possible to observe isotopic data as well as molecular ion data and their relative abundances on the sample surface.
Depth Profile
A depth profile displays the intensity of one or more ions with respect to the depth (or, equivalently, time). Caution should be taken when interpreting this data- if ions are collected off the wall of the crater rather than from the bottom, it will appear that the layer in question runs deeper in the sample than it actually does.
Matrix Assisted Laser Desorption Ionization (MALDI)
Development of MALDI
As alluded to in previous sections, laser desorption (LD) was originally developed to produce ions in the gas phase. This is accomplished by pulsing a laser on the sample surface to ablate material causing ionization and vaporization of sample particles. However, the probability of attaining a valuable mass spectrum is highly dependent on the properties of the analyte. Furthermore, masses observed in the spectrum were products of the molecular fragmentation if the molecular weight was above 500 Da. Clearly, this was not optimal instrumentation for analyzing large biomolecules and bioinorganic compounds that do not ionize well and samples were degraded during the process. Matrix-assisted laser desorption ionization (MALDI) was developed and alleviated many issues associated with LD techniques. The MALDI technique allows proteins with masses up to 300,000 Da to be detected. This is important to bioinorganic chemistry when visualizing products resulting from catalytic reactions, metalloenzyme modifications, and other applications.
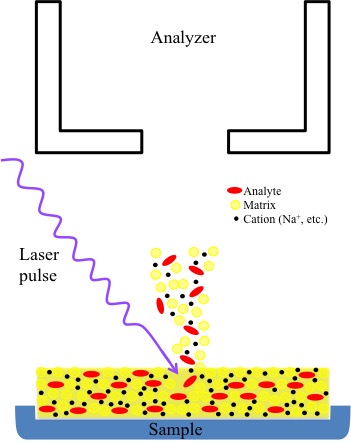
MALDI as a process decreases the amount of damage to the sample by protected the individual analytes within a matrix (more information of matrices later). The matrix itself absorbs much of the energy introduced by the laser during the pulsing action. Plus, energy absorbed by the matrix in subsequently transferred to the analyte (Figure \(\PageIndex{19}\)). Once, energized, the analyte ionized and is released into a plume of ions containing common cations (Na+, K+, etc.), matrix ions, and analyte ions. These ions then enter the flight tube where they are sent to the detector. Different instrumental modes adjust for differences in ion flight time (Figure \(\PageIndex{19}\)). The MALDI technique is also more sensitive and universal since readjustments to match absorption frequency is not necessary due to the matrix absorption. Many of the commonly used matrices have similar wavelength absorptions Table \(\PageIndex{3}\).
| Matrix | Wavelength | Application | Structure |
| Cyano-4-hydroxycinnamic acid | UV: 337nm, 353 nm | Peptides |  |
| 6-Aza-2-thiothymine | UV: 337 nm, 353 nm | Proteins, peptides, non-covalent complexes |  |
| k,m,n-Di(tri)hydroxy-acetophenone |
UV: 337 nm, 353 nm |
Proteins, peptides, non-covalent complexes |  |
| 2,5-Dihydroxybenzoic acid (requires 10% 2-hydroxy-5-methoxybenzoic acid) | UV: 337 nm, 353 nm | Proteins, peptides, carbohydrates, synthetic polymers |  |
| Sinapinic acid | UV: 337 nm, 353 nm | Proteins, peptides |  |
| Nicotinic acid | UV: 266 nm | Proteins, peptides, adduct formation |  |
| Succinic acid | IR: 2.94 µm, 2.79 µm | Proteins, peptides |  |
| Glycerol | IR: 2.94 µm, 2.79 µm | Proteins, peptides |  |
Collection of MALDI Spectra
The process of MALDI takes place in 2 steps:
- Sample preparation.
- Sample ablation
Sample Preparation
The sample for analysis is combined with a matrix (a solvent containing small organic molecules that have a strong absorbance at the laser wavelength) and added to the MALDI plate (Figure \(\PageIndex{18}\)). The sample is then dried to the surface of the plate before it is analyzed, resulting in the matrix doped with the analyte of interest as a "solid solution". Figure \(\PageIndex{20}\) shows the loading of a peptide in water in cyano-4-hydroxycinnamic acid matrix.
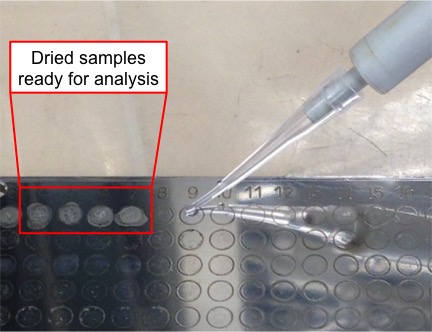
Prior to insertion of the plate into the MALDI instrument, the samples must be fully dried. The MALDI plate with the dry samples is placed on a carrier and is inserted into the vacuum chamber (Figure \(\PageIndex{21}\)a-b). After the chamber is evacuated, it is ready to start the step of sample ablation.

After the sample is loaded into the instrument, the instrument camera will show activate to show a live feed from inside of the chamber. The live feed allows the controller to view the location where the spectrum is being acquired. This becomes especially important when the operator manually fires the laser pulses.
Collection of a Spectrum
When the sample is loaded into the vacuum chamber of the instrument, there are several options for taking a mass spectrum. First, there are several modes for the instrument, two of which are described here: axial and reflectron modes.
Axial Mode
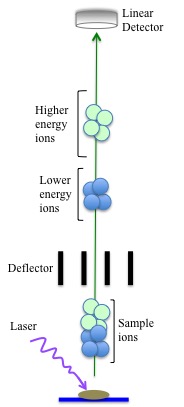
In the axial (or linear) mode, only a very short ion pulse is required before the ions go down the flight tube and hit the detector. This mode is often used when exact accuracy is not required since the mass accuracy has an error of about +/- 2-5%. Sources of these errors are found in the arrival time of different ions through the flight tube to the detector. Errors in the arrival time are caused by the difference in initial velocity with which the ions travel based on their size. The larger ions have a lower initial velocity, thus they reach the detector after a longer period of time. This decreases the mass detection resolution.
Reflectron Mode
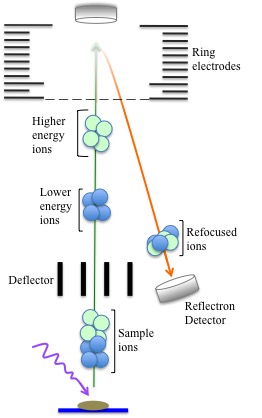
In the reflectron (“ion mirror”) mode, ions are refocused before they hit the detector. The reflectron itself is actually a set of ring electrodes that create an electric field that is constant near the end of the flight tube. This causes the ions to slow and reverse direction towards a separate detector. Smaller ions are then brought closer to large ions before the group of ions hit the detector. This assists with improving detection resolution and decreases accuracy error to +/- 0.5%.
Example of MALDI Application
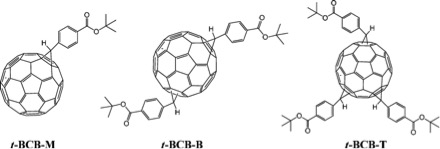
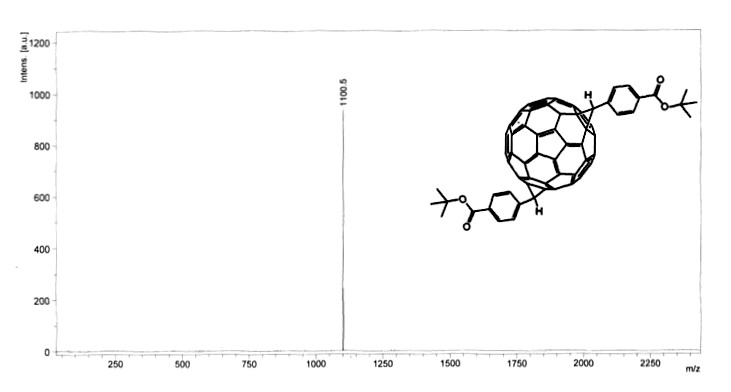
While MALDI is used extensively in analyzing proteins and peptides, it is also used to analyze nanomaterials. The following example describes the analysis of fullerene analogues synthesized for a high performance conversion system for solar power. The fullerene C60 is a spherical carbon molecule consisting of 60 sp2carbon atoms, the properties of which may be altered through functionalization. A series of tert-butyl-4-C61-benzoate (t-BCB) functionalized fullerenes were synthesized and isolated. MALDI was not used extensively as a method for observing activity, but instead was used as a conformative technique to determine the presence of desired product. Three fullerene derivatives were synthesized (Figure \(\PageIndex{24}\)).The identity and number of functional groups were determined using MALDI (Figure \(\PageIndex{25}\)).
Surface-Assisted Laser Desorption/Ionization Mass Spectrometry (SALDI-MS)
Surface-assisted laser desorption/ionization mass spectrometry, which is known as SALDI-MS, is a soft mass spectrometry technique capable of analyzing all kinds of small organic molecules, polymers and large biomolecules. The essential principle of this method is similar to (matrix-assisted laser desorption/ionization mass spectrometry) MALDI-MS (see http://cnx.org/contents/925e204d-d85...3e4d60057b37@1), but the organic matrix commonly used in MALDI has been changed into the surface of certain substrates, usually inorganic compounds. This makes SALDI a matrix-free ionization technique that avoids the interference of matrix molecules.
SALDI is considered to be a three-step process shown in Figure \(\PageIndex{26}\).
- Samples are mixed with the substrates that provide large surface area to support sample molecule.
- The samples are irradiated with IR of UV laser pulses when the energy of laser pulses are absorbed by the substrates and transferred to the sample molecules.
- Desorption and ionization process are initiated, which produces ions that are accelerated into the analyzer.
Since the bulk of energy input goes to substrates instead of the sample molecules, it is thought to be a soft ionization technique useful in chemistry and chemical biology fields.
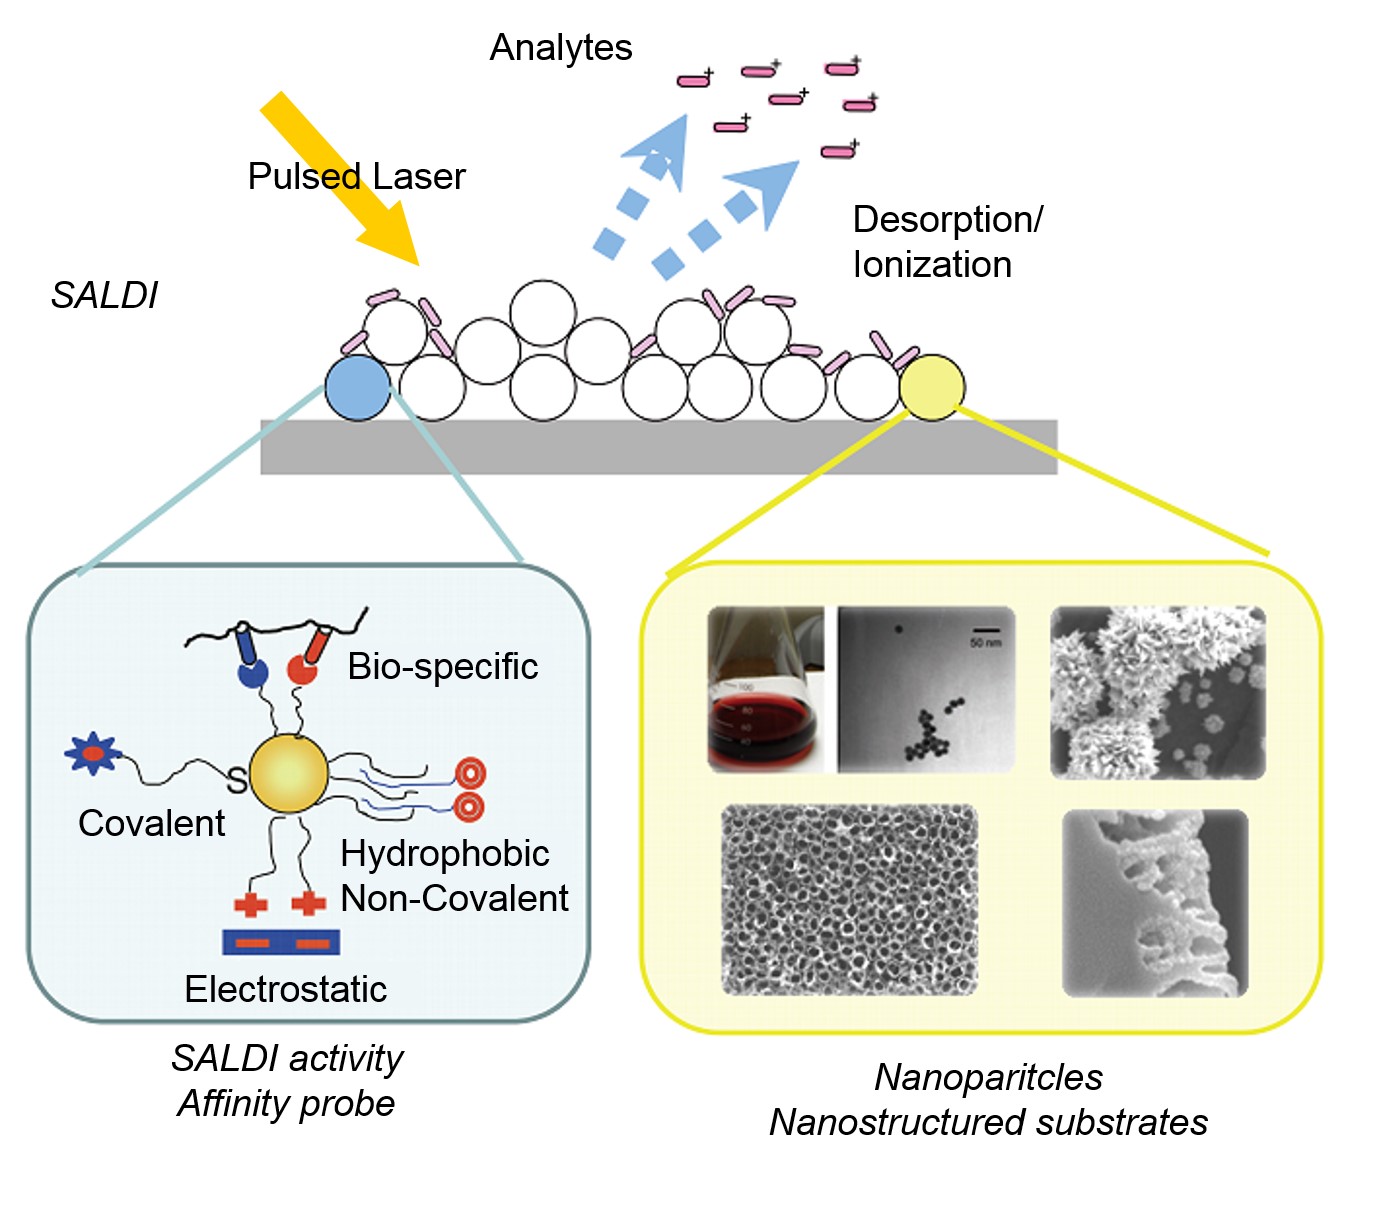
The most important characteristic of the substrate in SALDI is a large surface areas. In the past 30 years, efforts have been made to explore novel substrate materials that increase the sensitivity and selectivity in SALDI-MS. Depending on the substrate compounds being used, the interaction between the substrate materials and sample molecules could be covalent, non-covalent such as hydrophobic effect, bio-specific such as recognition between biotins and avidins, and between antigens and antibodies, or electrostatic. With the unique characteristics stated above, SALDI is able to combine the advantages of both hard and soft ionization techniques. On one hand, low molecular weight (LMW) molecules could be analyzed and identified in SALDI-MS, which resembles the function of most hard ionization techniques. On the other hand, molecular or quasi-molecular ions would dominate the spectra as what we commonly see in the spectra prepared by soft ionization techniques.
History
The SALDI technique actually emerged from its well-known rival technique, MALDI. The development of soft ionization techniques, which mainly included MALDI and ESI, enabled chemists and chemical biologists to analyze large polymers and biomolecules using mass spectrometry. This should be attributed to the soft ionization process which prohibited large degree of fragmentation that complicated the spectra, and resultant ions were dominantly molecular ions or quasi-molecular ions. In other words, tolerance of impurities would be increased since the spectra became highly simplified. While it was effective in determining molecular weight of the analytes, the matrix peaks would also appear in low mass range, which seriously interfered with the analysis of LMW analytes. As a result, the SALDI method emerged to resolve the problem by replacing matrix with surface that was rather stationary.
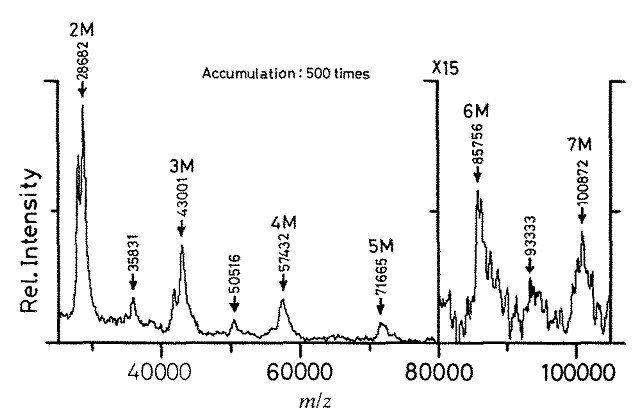
The original idea of SALDI was raised by Tanaka (Figure \(\PageIndex{27}\)) in 1988. Ultra-fine cobalt powders with an average diameter of about 300 Å that were mixed in the sample were responsible of “rapid heating” due to its high photo-absorption and low heat capacity. With a large surface area, the cobalt powders were able to conduct heat to large numbers of surrounding glycerol liquid and analyte molecules, which indeed resulted in a thermal desorption/ionization mechanism. The upper mass limit was increased up to 100 kDa, which is shown in Figure \(\PageIndex{28}\) for the analysis of lysozymes from chicken egg white.

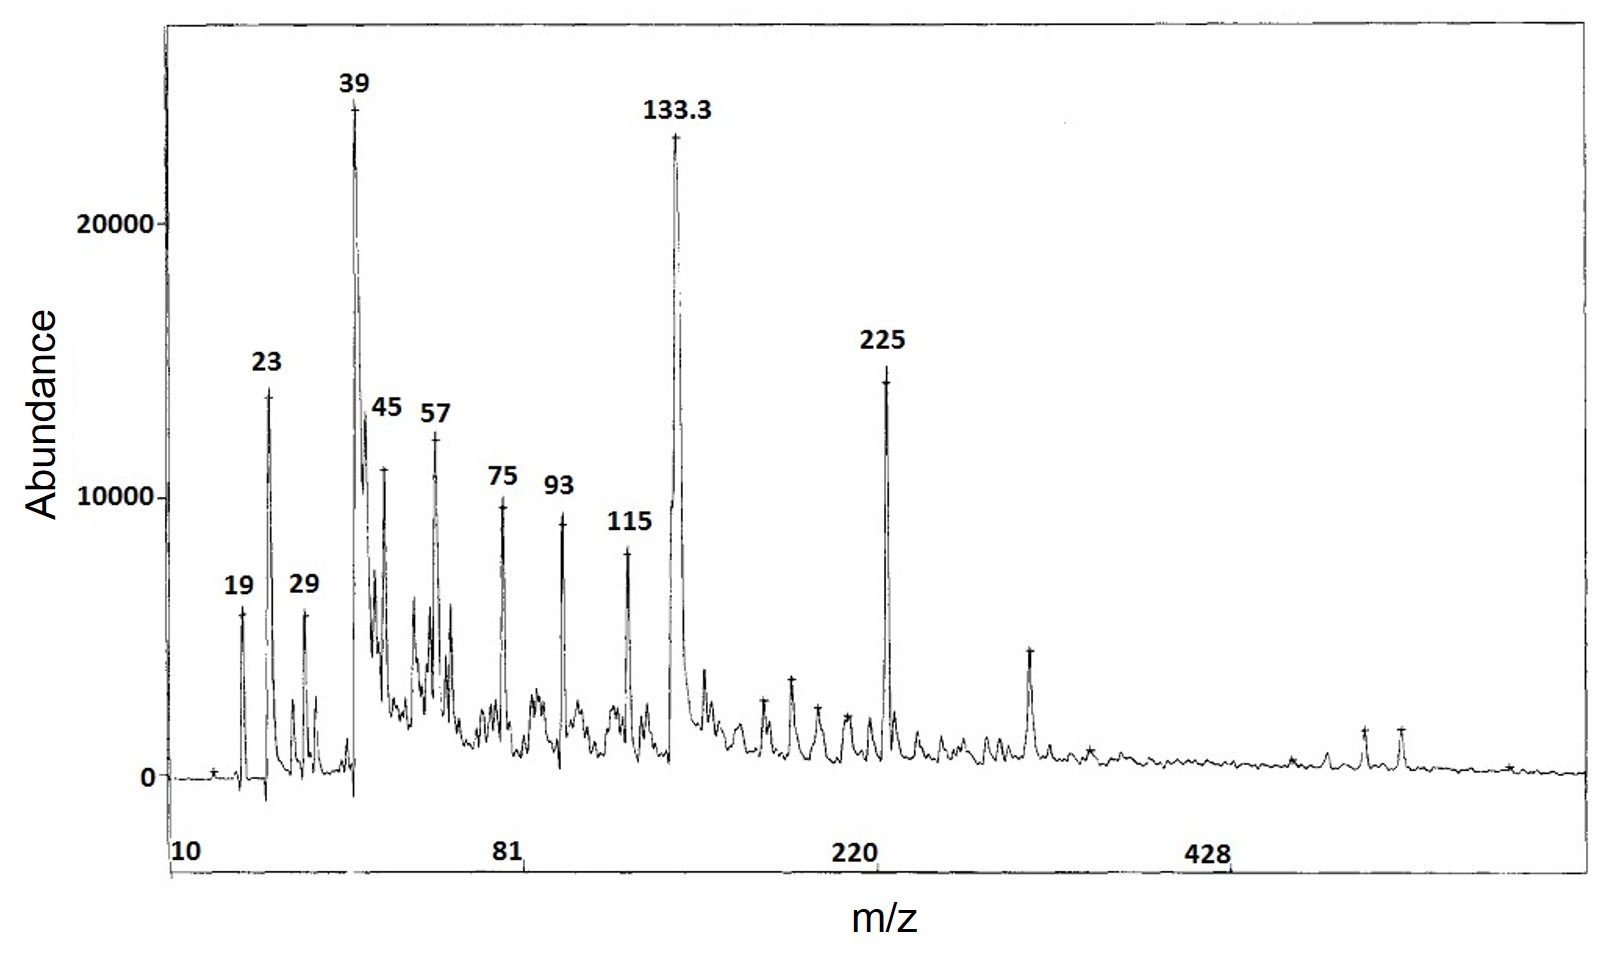
The low mass range was not paid much attention at the beginning, and the concept of “surface-assisted” was not proposed until Sunner (Figure \(\PageIndex{29}\)) and co-workers reported the study on graphite SALDI in 1995. And that was the first time the term “SALDI” was used by chemists. They achieved obtaining mass spectra of both proteins and LWM analytes by irradiating mixture of 2-150 μm graphite particles and solutions of analytes in glycerol. Although fragmentation of the LMW glycerol molecules was relatively complicated (Figure \(\PageIndex{30}\)), it was still considered as a significant improvement in ionizing small molecules by soft ionization methods.

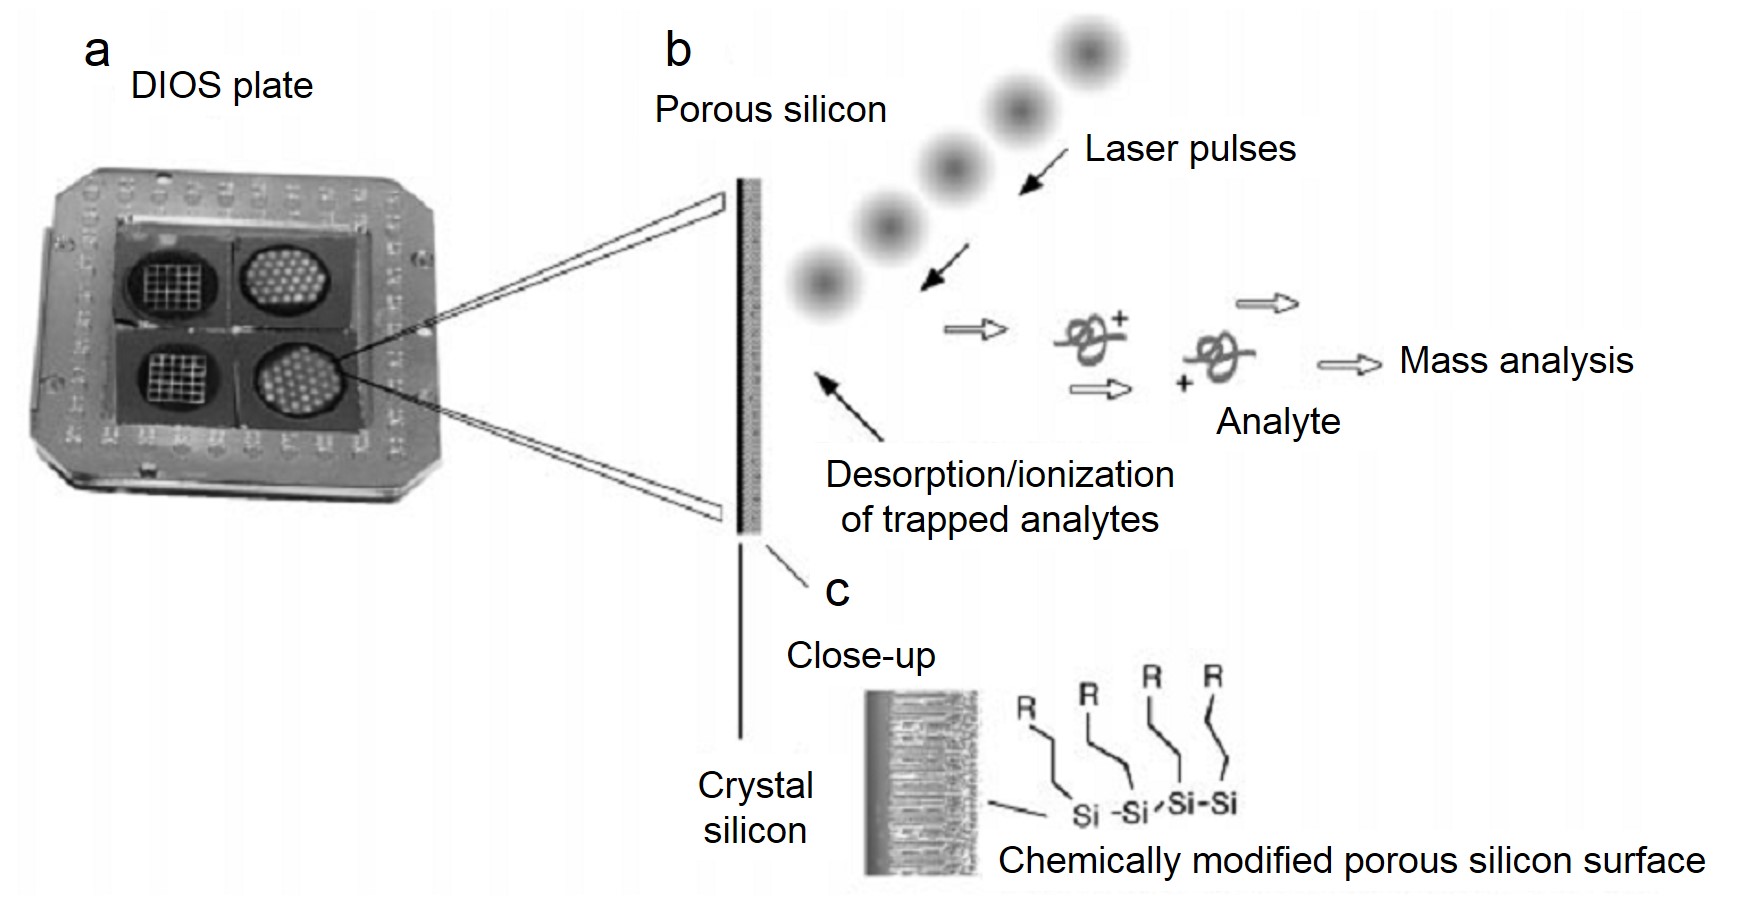
Despite the breakthrough mentioned above, SALDI did not widely interest chemists. Regardless of its drawbacks in upper mass limit for the analysis of large molecules, the sensitivity was far from being satisfactory compared to hard ionization techniques in terms of testing LMW molecules. This situation has been changed ever since nanomaterials were introduced as the substrates, especially for the successful development of desorption/ionization on porous silicon (DIOS) shown in Figure \(\PageIndex{31}\). In fact, majority of research on SALDI-MS has been focusing on exploiting novel nanomaterial substrates, aiming at further broadening the mass range, improving the reproducibility, enhancing the sensitivity and extending the categories of compounds that were able to be analyzed. So far, a variety of nanomaterials have been utilized in SALDI-MS, including carbon-based nanomaterials, metal-based nanomaterials, semiconductor-based nanomaterials, etc.
Basic Principles of SALDI
Mechanism of Desorption and Ionization
As a soft ionization technique, SALDI is expected to produce molecular or quasi-molecular ions in the final mass spectra. Since this requires the ionization process to be both effective and controllable, which means sufficient sample molecules could be ionized while further fragmentation should be mostly avoided.
While the original goal mentioned above has been successfully accomplished for years, the study on desorption and ionization mechanism in detail is still one of the most popular and controversial research areas of SALDI at present. It is mostly agreed that the substrate material has played a significant role of both activating and protecting the analyte molecules. The schematic picture describing the entire process is shown in Figure \(\PageIndex{33}\). Energy input from the pulsed laser is largely absorbed by the substrate material, which is possibly followed by complicated energy transfer from the substrate material to the absorbed analyte molecules. As a result, both thermal and non-thermal desorption could be triggered, and for different modes of SALDI experiments, the specific desorption and ionization process greatly differs.
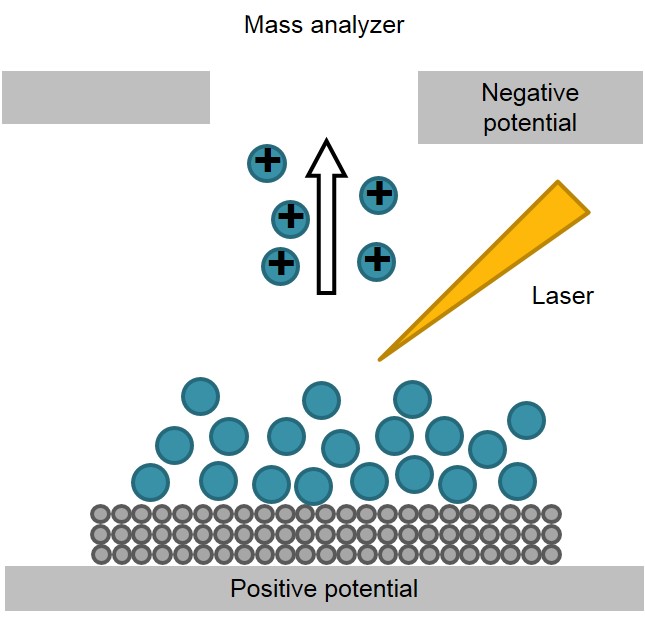
The mechanism for porous silicon surface as a SALDI substrate has been widely studied by researchers. In general, the process can be subdivided into the following steps:
- Adsorption of neutral analyte molecules takes places by formation of hydrogen bonds with surface silanol groups;
- Electronic excitation of the substrate under the influence of the laser pulse generates a free electron/“hole” pair. This separation causes enrichment of positive charges near the surface layer; as a result, the acidity of the silanol groups increases and proton transfer to analytes becomes easier;
- Analyte ions are thermally activated and thus dissociated from the surface.
When no associated proton donor is present in the vicinity of analyte molecules, desorption might occur without ionization. Subsequently, the desorbed analyte molecule is ionized in the gas phase by collision with incoming ions.
Signal Enhancement Factors on SALDI Substrates
Since it is the active surface responsible for adsorption, desorption and ionization of analyte molecules that features the technique, the surface chemistry of substrate material is undoubtedly crucial for SALDI performance. But it is rather difficult to draw a general conclusion due to the fact that the affinity between different classes of substrates and analytes is considerably versatile. Basically, the interaction between those two components has an impact on trapping and releasing the analyte molecules, as well as the electronic surface state of the substrate and energy transfer coefficiency.
Another important aspect is the physical properties of the substrates which could alter desorption and ionization process directly, especially for the thermally activated pathway. This is closely related to rapid temperature increase on the substrate surface. Those properties include optical absorption coefficiency, heat capacity and heat conductivity (or heat diffusion rate). First, higher optical absorption coefficiency enables the substrate to absorb and generate more heat when certain amount of energy is provided by the laser source. Moreover, a lower heat capacity usually leads to larger temperature increase upon the same amount of heat. In addition, a lower hear conductivity helps the substrate to maintain a high temperature that will further result in a higher temperature peak. Therefore, the thermal desorption and ionization could occur more rapidly and effectively.
Instrumentation
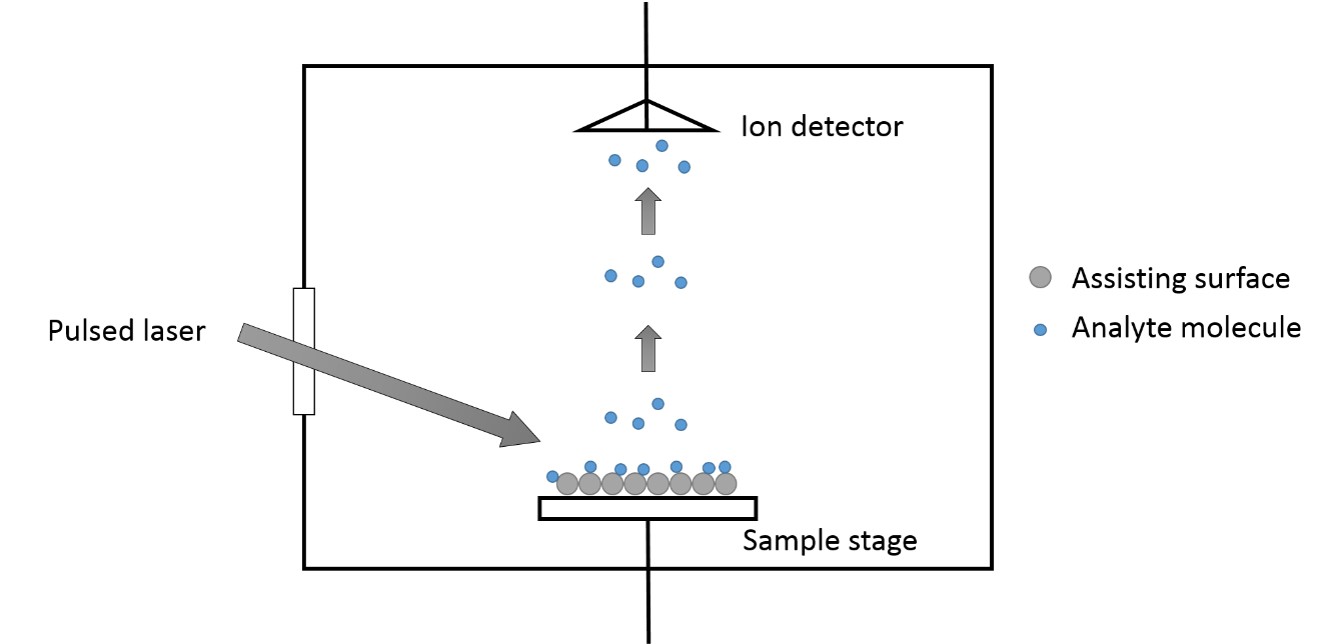
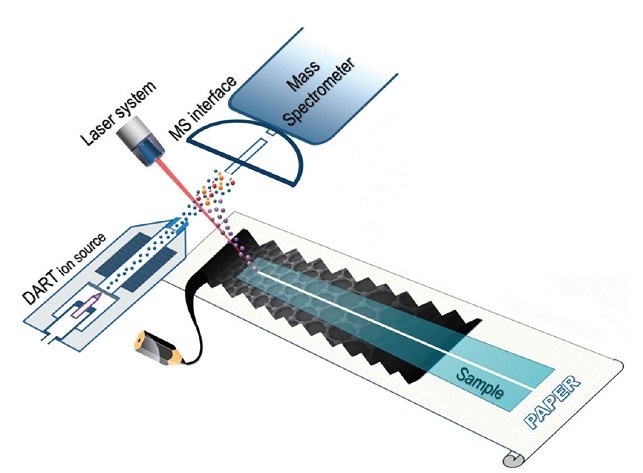
The instrument involved in SALDI shown in Figure \(\PageIndex{34}\) is similar with in MALDI to large extent. It contains a laser source which generates pulsed laser that excites the sample mixture. There is a sample stage that places the sample mixture of substrate materials and analytes. Usually the mass analyzer and ion detector are on the other side to let the ions go through and become separated and detected based on different m/z value. Recent progress has been made that incorporates direct analysis in real time (DART) ion source into SALDI-MS system which makes it possible to perform the analysis in ambient conditions. Figure \(\PageIndex{35}\) shows their ambient SALDI-MS method.
Examples of Nanomaterials Used For Analysis of LMW Analytes in SALDI-MS
Porous Silicon as a Substrate Material
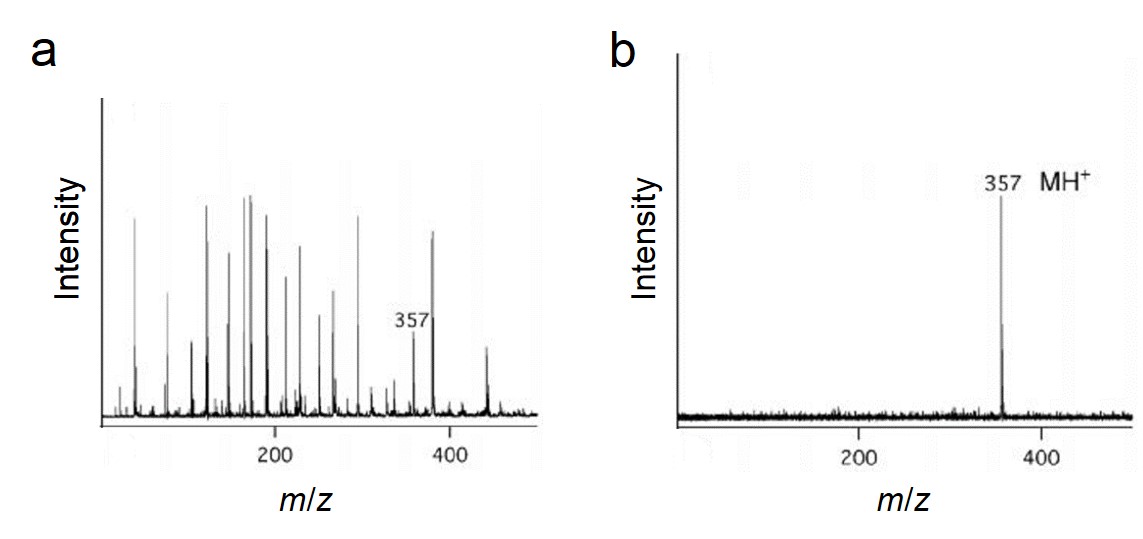
Porous silicon with large surface area could be used to trap certain analyte molecules for matrix-free desorption and ionization process. More interestingly, a large ultraviolet absorption coefficiency was found for this porous material, which also improved the ionization performance. It has been reported that using porous silicon as the substrate in SALDI-MS was able to work at femtomole and attomole levels of analytes including as peptides, caffeine, an antiviral drug molecule (WIN), reserpine and N-octyl-β-D-glucopyranoside . Compared to conventional MALDI-MS, the DIOS-MS (which was the specific type of SALDI in this research) successfully eliminated the matrix interference and displayed much higher quasi-molecular peak (MH+), which could be observed in Figure \(\PageIndex{36}\). What’s more, chemical modification of the porous silicon was able to further optimize the ionization characteristics.
Graphene as a Surface Material
Graphene is a type of popular carbon nanomaterial discovered in 2004. It has a large surface area that could effectively attach the analyte molecules. On the other hand, the efficiency of desorption/ionization for analytes on a layer of graphene can be enhanced for its simple monolayer structure and unique electronic properties. Polar compounds including amino acids, polyamines, anticancer drugs, and nucleosides can be successfully analyzed. In addition, nonpolar molecules can be analyzed with high resolution and sensitivity due to the hydrophobic nature of graphene itself. Compared with a conventional matrix, graphene exhibited a high desorption/ionization efficiency for nonpolar compounds. The graphene substrate functions as a substrate to trap analytes, and it transfers energy to the analytes upon laser irradiation, which allows for the analytes to be readily desorbed/ionized and the interference of matrix to be eliminated. It has been demonstrated that the use of graphene as a substrate material avoids the fragmentation of analytes and provides good reproducibility and a high salt tolerance, underscoring the potential application of graphene as a matrix for MALDI-MS analysis of practical samples in complex sample matrixes. It is also proved that the use of graphene as an adsorbent for the solid-phase extraction of squalene could improve greatly the detection limit.
Combination with GC
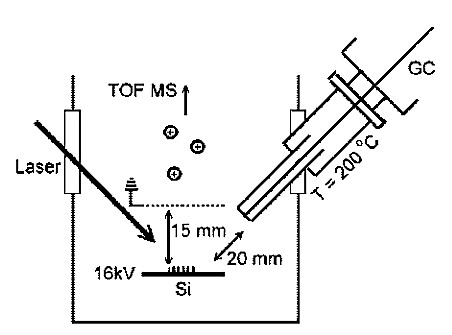
Gas-phase SALDI-MS analysis has a relatively high ionization efficiency, which leads to a high sensitivity. In 2009, gas chromatography (GC) was first used with SALDI-MS, where the SALDI substrate was amorphous silicon and the analyte was N-alkylated phenylethylamines. Detection limits were in the range of attomoles, but improvements are expected in the future. The combination with GC is expected to expand the use of SALDI-MS even more that SALDI could be applied to separation and identification of samples with more complexity. The instrumental setup is shown in Figure \(\PageIndex{37}\).
Differential Electrochemical Mass Spectrometry
In the study of electrochemistry, it had always been a challenge to obtain immediate and continuous detection of electrochemical products due to the limited formation on the surface of the electrode, until the discovery of differential electrochemical mass spectrometry. Scientists initially tested the idea by combining porous membrane and mass spectrometry for product analysis in the study of oxygen generation from HClO4 using porous electrode in 1971. In 1984, another similar experiment was performed using a porous Teflon membrane with 100 μm of lacquers at the surface between the electrolytes and the vacuum system. Comparing to previous experiment, this experiment has demonstrated a vacuum system with improved time derivative that showed nearly immediate detection of volatile electrochemical reaction products, with high sensitivity of detecting as small as “one monolayer” at the electrode. In summary, the experiment demonstrated in 1984 not only showed continous sample detection in mass spectrometry but also the rates of formation, which distinguished itself from the technique performed previously in 1971. Hence, this method was called differential electrochemical mass spectrometry (DEMS). During the past couple decades, this technique has evolved from using classic electrode to rotating disc electrode (RDE), which provides a more homogeneous and faster transport of reaction species to the surface of the electrode.
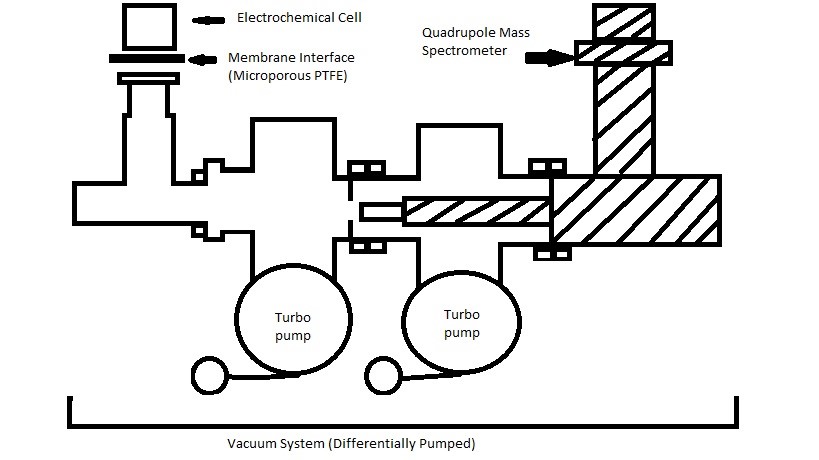
Described in basic terms, differential electrochemical mass spectrometry is a characterization technique that analyzes specimens using both the electrochemical half-cell experimentation and mass spectrometry. It uses non-wetting membrane to separate the aqueous electrolyte and gaseous electrolyte, which gaseous electrolyte will permeate through the membrane and will be ionized and detected in the mass spectrometer using continuous, two-stage vacuum system. This analytical method can detect gaseous or volatile electrochemical reactants, reaction products, and even reaction intermediates. The instrument consists of three major components: electrochemical half-cell, PTFE (polytetrafluoroethylene) membrane interface, and quadrupole mass spectrometer (QMS), which is a part of the vacuum system.
DEMS Operations
The entire assembly of the instrument is shown in Figure \(\PageIndex{38}\), which consists of three major components: an electrochemical half-cell, a PTFE membrane interface, and the quadrupole mass spectrometer. In this section, each component will be explained and its functionality will be explored, and additional information will be provided at the end of this section. The PTFE membrane is micro-porous membrane that separates the aqueous electrolyte from volatile electrolyte which will be drawn to the high vacuum portion. Using the high vacuum suction, the gaseous or volatile species will be allowed to permeate through the membrane using differential pressure, leaving the aqueous materials on the surface due to hydrophobic nature of the membrane. The selection of the membrane material is very important to maintain both the hydrophobicity and proper diffusion of volatile species. The species permeated to QMS will be monitored and measured, and the kinetics of formation will be determined at the end. Depending on the operating condition, different vacuum pumps might be required.
Electrochemical Cells
First major component of the DEMS instrument is the design of electrochemical cells. There are many different designs that have been developed for the past several decades, depending on the types of electrochemical reactions, the types and sizes of electrodes. However, only the classic cell will be discussed in this chapter.
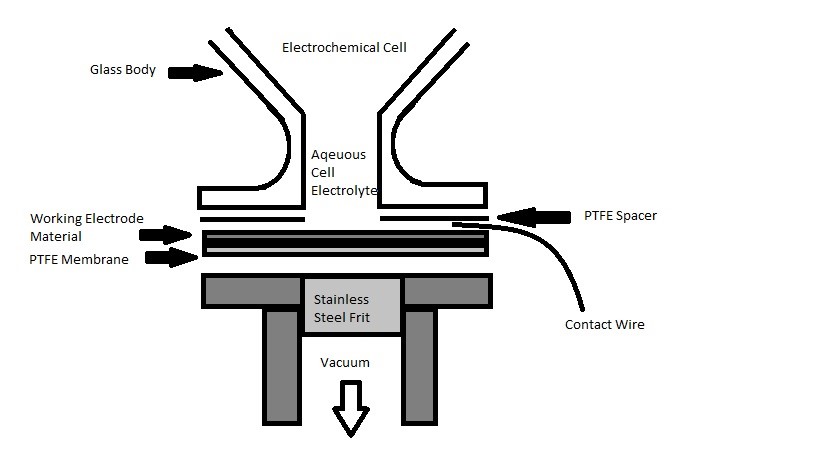
DEMS method was first demonstrated using the classical method. A conventional setup of electrochemical cell is showed in Figure \(\PageIndex{39}\). The powdered electrode material is deposited on the porous membrane to form the working electrode, shown as Working Electrode Material in Figure \(\PageIndex{39}\). In the demonstration by Wolber and Heitbaum, the electrode was prepared by having small Pt particles deposited onto the membrane by painting a lacquer. It was later in other experimentations evolved to use sputtering electro-catalyst layer for a more homogenous surface. The aqueous cell electrolyte is shielded with an upside down glass body with vertical tunnel opening to the PTFE membrane. The working electrode material lies above the PTFE membrane, where it is supported mechanically by stainless steel frit inside vacuum flange. Both the working electrode material and PTFE membrane are compressed between vacuum castings and PTFE spacer, which is a ring that prevents the electrolyte from leakage. The counter electrode (CE) and reference electrode (RE) made from platinum wire are placed on top of the working electrode material to create the electrical contact. One of the main advantages of the classical design is fast respond time, with high efficiency of “0.5 for lacquer and 0.9 with the sputter electrode”. However, this method poses certain difficulties. First, the electrolyte materials will be absorbed on the working electrode before it permeates through the membrane. Due to the limitation of absorption rate, the concentration on the surface of the electrode will be lower than bulk. Second, the aqueous volatile electrolyte must be absorbed onto working electrode, and then followed by evaporation through the membrane. Therefore, the difference in rates of absorption and evaporation will create a shift in equilibrium. Third, this method is also limited to the types of material that can be deposited on the surface, such as single crystals or even some polycrystalline electrode surfaces. Lastly, the way RE is position could potentially introduce impurity into the system, which will interfere with the experiment.
Membrane Interface
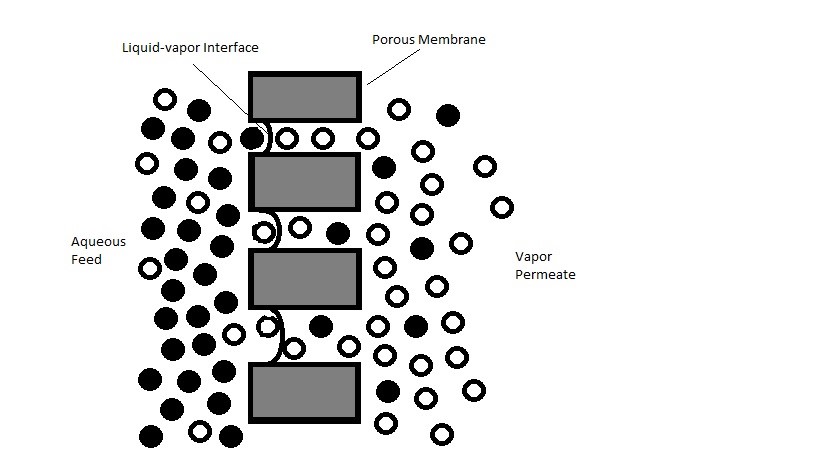
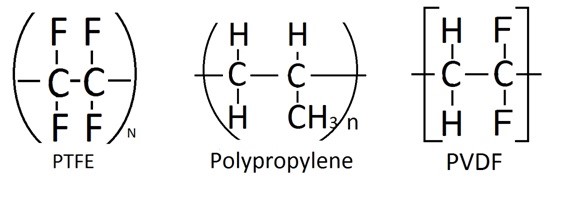
PTFE membrane is placed between the aqueous electrolyte cell and the high vacuum system on the other end. It acts as a barrier that prevents aqueous electrolyte from passing through, while its selectivity allows the vaporized electrochemical species to transport to the high vacuum side, which the process is similar to vacuum membrane distillation shown in Figure \(\PageIndex{41}\). In order to prevent the aqueous solution from penetrating through the membrane, the surface of the membrane must be hydrophobic, which is a material property that repels water or aqueous fluid. Therefore, at each pore location, there is vapor and liquid interface where the liquid will remain on the surface while the vapor will penetrate into the membrane. Then the transportation of the material in vapor phase is triggered by the pressure difference created from the vacuum on the other end of the membrane. Therefore, the size of the pore is crucial in controlling its hydrophobic properties and the transfer rate through the membrane. When the pore size is less than 0.8 μm, the hydrophobic property is activated. This number is determined by calculating the surface tension of liquid, the contact angle and the applied pressure. Therefore, a membrane with relatively small pore sizes and large pore distribution is desired. In general membrane materials used are “typically 0.02 μm in size with thickness between 50 and 110 μm”. In terms of materials, there are other materials such as polypropylene and polyvinylidene fluoride (PVDF)(Figure \(\PageIndex{41}\)) have been tested; however, PTFE material (Figure \(\PageIndex{42}\)) as membrane has demonstrated better durability and chemical resistance to electrochemical environment. Therefore, PTFE is shown to be the better candidate for such application, and is usually laminated onto polypropylene for enhanced mechanical properties. Despite the hydrophobic property of PTFE material, a significant amount aqueous material penetrates through the membrane due to the large pressure drop. Therefore, the correct sizing of the vacuum pumps is crucial to maintain the flux of gas to be transported to the mass spectrometry at the desire pressure. More information regarding the vacuum system will be discussed. In addition, capillary has been used in replacement of the membrane; however, this method will not be discussed here.
Vacuum and QMS
The correctly sized vacuum system can ensure the maximum amount of vapor material to be transported across the membrane. When the pressure drop is not adequate, part of the vapor material may be remain on the aqueous side as shown Figure \(\PageIndex{43}\). However, when the pressure drop is too large, too much aqueous electrolyte will be pulled from the liquid-vapor interface, subsequently increasing load on the vacuum pumps. In the cases of improper sized pumps can reduce pump efficiency and lower pump life-time if such problem is not corrected immediately. In addition, in order for mass spectrometry operate properly, the gas flux will need to maintain at a certain flow. Therefore, the vacuum pumps should provide steady flux of gas around 0.09 mbar/s.cm2 consisting mostly with gaseous or volatile species and other species that will be sent to mass spectrometry for analyzing. In additional, due to the limitation of pump speed of single vacuum pump, vacuum system with two or more pumps will be needed. For example, if 0.09 mbar/s.cm2 is required and pump speed of 300 s-1 that operates at 10-5 mbar, the acceptable membrane geometrical area is 0.033 cm-2. In order to increase the membrane area, addition pumps will be required in order to achieve the same gas flux.
Additional Information
There are several other analytical techniques such as cyclic voltammetry, potential step and galvanic step that can be combined with DEMS experiment. Cyclic voltammetry can provide both quantitative and qualitative results using the potential dependence. As a result, both the ion current of interested species and faradaic electrode current (the current generated by the reduction or oxidation of some chemical substance at an electrode) will be recorded when combining cyclic voltammetry and DEMS.
Applications
The lack of commercialization of this technique has limited it to only academic research. The largest field of application of DEMS is on electro-catalytic reactions. In addition, it is also used fuel cell research, detoxification reactions, electro-chemical gas sensors or more fundamental relevant research such as decomposition of ionic liquids etc.
Fuel Cell Differential Electrochemical Mass Spectrometry: Ethanol Electro-oxidation
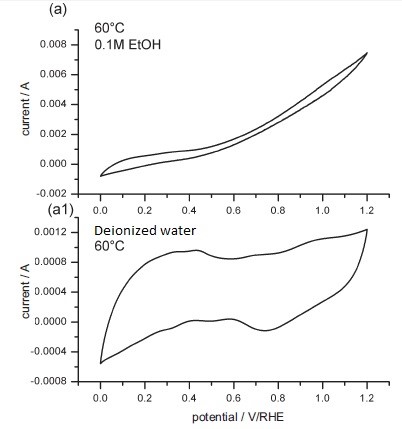
The ethanol oxidation reaction was studied using alkaline membrane electrode assemblies (MEAs), constructed using nanoparticle Pt catalyst and alkaline polymeric membrane. DEMS will be use to study the mechanics of the ethanol oxidation reaction on the pt-based catalysts. The relevant products of the oxidation reaction are carbon dioxide, acetaldehyde and acetic acid. However, both carbon dioxide and acetaldehyde has the same molecular weight, which 44 g/mole. One approach is to monitor the major fragments where ionized CO22+ at m/z = 22 and COH+ at m/z = 29 were used. Differential electrochemical mass spectrometry can detect volatile products of the electrochemical reaction; however, detections can be varied by solubility or boiling point. CO2 is very volatile, but also soluble in water. If KOH is present, DEMS will not detect any CO2traces. Therefore, all extra alkaline impurities should be removed before measurements are taken. The electrochemical characteristics can also be measured under various conditions and examples shown in Figure \(\PageIndex{43}\). In addition, the CCE (CO2 current efficiency) was measured under different potentials. Using the CCE, the study concluded that the ethanol undergoes more complete oxidation using alkaline MEA than acidic MEA.
Studies on the Decomposition of Ionic Liquids
Ionic liquids (IL) have several properties such as high ionic conductivity, low vapor pressure, high thermal and electrochemical stability, which make them great candidate for battery electrolyte. Therefore, it is important to have better understanding of the stability of the reaction and of the products formed during decomposition behavior. DEMS is a powerful method where it can provide online detection of the volatile products; however, it runs into problems with high viscosity of ILs and low permeability due to the size of the molecules. Therefore, researchers modified the traditional setup of DEMS, which the modified method made use of the low vapor pressure of ILs and have electrochemical cell placed directly into the vacuum system. This experiment shows that this technique can be designed for very specific application and can be modified easily.
Conclusion
DEMS technique can provide on-line detection of products for electrochemical reactions both analytically and kinetically. In addition, the results are delivered with high sensitivity where both products and by-products can be detected as long as they are volatile. It can be easily assembled in the laboratory environment. For the past several decades, this technique has demonstrated advanced development and has delivered good results for many applications such as fuel cells, gas sensors etc. However, this technique has its limitation. There are many factors that need to be considered when designing this system such as half-cell electrochemical reaction, absorption rate and etc. Due to these constraints, the type of membrane should be selected and pump should be sized accordingly. Therefore, this characterization method is not one size fits all and will need to be modified base on the experimental parameters. Therefore, next step of development for DEMS is not only to improve its functions, but also to be utilized beyond the academic laboratory.


