
12.4: Phase Diagrams
- Page ID
- 6393
\( \newcommand{\vecs}[1]{\overset { \scriptstyle \rightharpoonup} {\mathbf{#1}} } \)
\( \newcommand{\vecd}[1]{\overset{-\!-\!\rightharpoonup}{\vphantom{a}\smash {#1}}} \)
\( \newcommand{\id}{\mathrm{id}}\) \( \newcommand{\Span}{\mathrm{span}}\)
( \newcommand{\kernel}{\mathrm{null}\,}\) \( \newcommand{\range}{\mathrm{range}\,}\)
\( \newcommand{\RealPart}{\mathrm{Re}}\) \( \newcommand{\ImaginaryPart}{\mathrm{Im}}\)
\( \newcommand{\Argument}{\mathrm{Arg}}\) \( \newcommand{\norm}[1]{\| #1 \|}\)
\( \newcommand{\inner}[2]{\langle #1, #2 \rangle}\)
\( \newcommand{\Span}{\mathrm{span}}\)
\( \newcommand{\id}{\mathrm{id}}\)
\( \newcommand{\Span}{\mathrm{span}}\)
\( \newcommand{\kernel}{\mathrm{null}\,}\)
\( \newcommand{\range}{\mathrm{range}\,}\)
\( \newcommand{\RealPart}{\mathrm{Re}}\)
\( \newcommand{\ImaginaryPart}{\mathrm{Im}}\)
\( \newcommand{\Argument}{\mathrm{Arg}}\)
\( \newcommand{\norm}[1]{\| #1 \|}\)
\( \newcommand{\inner}[2]{\langle #1, #2 \rangle}\)
\( \newcommand{\Span}{\mathrm{span}}\) \( \newcommand{\AA}{\unicode[.8,0]{x212B}}\)
\( \newcommand{\vectorA}[1]{\vec{#1}} % arrow\)
\( \newcommand{\vectorAt}[1]{\vec{\text{#1}}} % arrow\)
\( \newcommand{\vectorB}[1]{\overset { \scriptstyle \rightharpoonup} {\mathbf{#1}} } \)
\( \newcommand{\vectorC}[1]{\textbf{#1}} \)
\( \newcommand{\vectorD}[1]{\overrightarrow{#1}} \)
\( \newcommand{\vectorDt}[1]{\overrightarrow{\text{#1}}} \)
\( \newcommand{\vectE}[1]{\overset{-\!-\!\rightharpoonup}{\vphantom{a}\smash{\mathbf {#1}}}} \)
\( \newcommand{\vecs}[1]{\overset { \scriptstyle \rightharpoonup} {\mathbf{#1}} } \)
\( \newcommand{\vecd}[1]{\overset{-\!-\!\rightharpoonup}{\vphantom{a}\smash {#1}}} \)
\(\newcommand{\avec}{\mathbf a}\) \(\newcommand{\bvec}{\mathbf b}\) \(\newcommand{\cvec}{\mathbf c}\) \(\newcommand{\dvec}{\mathbf d}\) \(\newcommand{\dtil}{\widetilde{\mathbf d}}\) \(\newcommand{\evec}{\mathbf e}\) \(\newcommand{\fvec}{\mathbf f}\) \(\newcommand{\nvec}{\mathbf n}\) \(\newcommand{\pvec}{\mathbf p}\) \(\newcommand{\qvec}{\mathbf q}\) \(\newcommand{\svec}{\mathbf s}\) \(\newcommand{\tvec}{\mathbf t}\) \(\newcommand{\uvec}{\mathbf u}\) \(\newcommand{\vvec}{\mathbf v}\) \(\newcommand{\wvec}{\mathbf w}\) \(\newcommand{\xvec}{\mathbf x}\) \(\newcommand{\yvec}{\mathbf y}\) \(\newcommand{\zvec}{\mathbf z}\) \(\newcommand{\rvec}{\mathbf r}\) \(\newcommand{\mvec}{\mathbf m}\) \(\newcommand{\zerovec}{\mathbf 0}\) \(\newcommand{\onevec}{\mathbf 1}\) \(\newcommand{\real}{\mathbb R}\) \(\newcommand{\twovec}[2]{\left[\begin{array}{r}#1 \\ #2 \end{array}\right]}\) \(\newcommand{\ctwovec}[2]{\left[\begin{array}{c}#1 \\ #2 \end{array}\right]}\) \(\newcommand{\threevec}[3]{\left[\begin{array}{r}#1 \\ #2 \\ #3 \end{array}\right]}\) \(\newcommand{\cthreevec}[3]{\left[\begin{array}{c}#1 \\ #2 \\ #3 \end{array}\right]}\) \(\newcommand{\fourvec}[4]{\left[\begin{array}{r}#1 \\ #2 \\ #3 \\ #4 \end{array}\right]}\) \(\newcommand{\cfourvec}[4]{\left[\begin{array}{c}#1 \\ #2 \\ #3 \\ #4 \end{array}\right]}\) \(\newcommand{\fivevec}[5]{\left[\begin{array}{r}#1 \\ #2 \\ #3 \\ #4 \\ #5 \\ \end{array}\right]}\) \(\newcommand{\cfivevec}[5]{\left[\begin{array}{c}#1 \\ #2 \\ #3 \\ #4 \\ #5 \\ \end{array}\right]}\) \(\newcommand{\mattwo}[4]{\left[\begin{array}{rr}#1 \amp #2 \\ #3 \amp #4 \\ \end{array}\right]}\) \(\newcommand{\laspan}[1]{\text{Span}\{#1\}}\) \(\newcommand{\bcal}{\cal B}\) \(\newcommand{\ccal}{\cal C}\) \(\newcommand{\scal}{\cal S}\) \(\newcommand{\wcal}{\cal W}\) \(\newcommand{\ecal}{\cal E}\) \(\newcommand{\coords}[2]{\left\{#1\right\}_{#2}}\) \(\newcommand{\gray}[1]{\color{gray}{#1}}\) \(\newcommand{\lgray}[1]{\color{lightgray}{#1}}\) \(\newcommand{\rank}{\operatorname{rank}}\) \(\newcommand{\row}{\text{Row}}\) \(\newcommand{\col}{\text{Col}}\) \(\renewcommand{\row}{\text{Row}}\) \(\newcommand{\nul}{\text{Nul}}\) \(\newcommand{\var}{\text{Var}}\) \(\newcommand{\corr}{\text{corr}}\) \(\newcommand{\len}[1]{\left|#1\right|}\) \(\newcommand{\bbar}{\overline{\bvec}}\) \(\newcommand{\bhat}{\widehat{\bvec}}\) \(\newcommand{\bperp}{\bvec^\perp}\) \(\newcommand{\xhat}{\widehat{\xvec}}\) \(\newcommand{\vhat}{\widehat{\vvec}}\) \(\newcommand{\uhat}{\widehat{\uvec}}\) \(\newcommand{\what}{\widehat{\wvec}}\) \(\newcommand{\Sighat}{\widehat{\Sigma}}\) \(\newcommand{\lt}{<}\) \(\newcommand{\gt}{>}\) \(\newcommand{\amp}{&}\) \(\definecolor{fillinmathshade}{gray}{0.9}\)- To understand the basics of a one-component phase diagram as a function of temperature and pressure in a closed system.
- To be able to identify the triple point, the critical point, and four regions: solid, liquid, gas, and a supercritical fluid.
The state exhibited by a given sample of matter depends on the identity, temperature, and pressure of the sample. A phase diagram is a graphic summary of the physical state of a substance as a function of temperature and pressure in a closed system.
Introduction
A typical phase diagram consists of discrete regions that represent the different phases exhibited by a substance (Figure \(\PageIndex{1}\)). Each region corresponds to the range of combinations of temperature and pressure over which that phase is stable. The combination of high pressure and low temperature (upper left of Figure \(\PageIndex{1}\)) corresponds to the solid phase, whereas the gas phase is favored at high temperature and low pressure (lower right). The combination of high temperature and high pressure (upper right) corresponds to a supercritical fluid.

The solid phase is favored at low temperature and high pressure; the gas phase is favored at high temperature and low pressure.
The lines in a phase diagram correspond to the combinations of temperature and pressure at which two phases can coexist in equilibrium. In Figure \(\PageIndex{1}\), the line that connects points A and D separates the solid and liquid phases and shows how the melting point of a solid varies with pressure. The solid and liquid phases are in equilibrium all along this line; crossing the line horizontally corresponds to melting or freezing. The line that connects points A and B is the vapor pressure curve of the liquid, which we discussed in Section 11.5. It ends at the critical point, beyond which the substance exists as a supercritical fluid. The line that connects points A and C is the vapor pressure curve of the solid phase. Along this line, the solid is in equilibrium with the vapor phase through sublimation and deposition. Finally, point A, where the solid/liquid, liquid/gas, and solid/gas lines intersect, is the triple point; it is the only combination of temperature and pressure at which all three phases (solid, liquid, and gas) are in equilibrium and can therefore exist simultaneously. Because no more than three phases can ever coexist, a phase diagram can never have more than three lines intersecting at a single point.
Remember that a phase diagram, such as the one in Figure \(\PageIndex{1}\), is for a single pure substance in a closed system, not for a liquid in an open beaker in contact with air at 1 atm pressure. In practice, however, the conclusions reached about the behavior of a substance in a closed system can usually be extrapolated to an open system without a great deal of error.
The Phase Diagram of Water
Figure \(\PageIndex{2}\) shows the phase diagram of water and illustrates that the triple point of water occurs at 0.01°C and 0.00604 atm (4.59 mmHg). Far more reproducible than the melting point of ice, which depends on the amount of dissolved air and the atmospheric pressure, the triple point (273.16 K) is used to define the absolute (Kelvin) temperature scale. The triple point also represents the lowest pressure at which a liquid phase can exist in equilibrium with the solid or vapor. At pressures less than 0.00604 atm, therefore, ice does not melt to a liquid as the temperature increases; the solid sublimes directly to water vapor. Sublimation of water at low temperature and pressure can be used to “freeze-dry” foods and beverages. The food or beverage is first cooled to subzero temperatures and placed in a container in which the pressure is maintained below 0.00604 atm. Then, as the temperature is increased, the water sublimes, leaving the dehydrated food (such as that used by backpackers or astronauts) or the powdered beverage (as with freeze-dried coffee).

The phase diagram for water illustrated in Figure \(\PageIndex{2b}\) shows the boundary between ice and water on an expanded scale. The melting curve of ice slopes up and slightly to the left rather than up and to the right as in Figure \(\PageIndex{1}\); that is, the melting point of ice decreases with increasing pressure; at 100 MPa (987 atm), ice melts at −9°C. Water behaves this way because it is one of the few known substances for which the crystalline solid is less dense than the liquid (others include antimony and bismuth). Increasing the pressure of ice that is in equilibrium with water at 0°C and 1 atm tends to push some of the molecules closer together, thus decreasing the volume of the sample. The decrease in volume (and corresponding increase in density) is smaller for a solid or a liquid than for a gas, but it is sufficient to melt some of the ice.
In Figure \(\PageIndex{2b}\) point A is located at P = 1 atm and T = −1.0°C, within the solid (ice) region of the phase diagram. As the pressure increases to 150 atm while the temperature remains the same, the line from point A crosses the ice/water boundary to point B, which lies in the liquid water region. Consequently, applying a pressure of 150 atm will melt ice at −1.0°C. We have already indicated that the pressure dependence of the melting point of water is of vital importance. If the solid/liquid boundary in the phase diagram of water were to slant up and to the right rather than to the left, ice would be denser than water, ice cubes would sink, water pipes would not burst when they freeze, and antifreeze would be unnecessary in automobile engines.
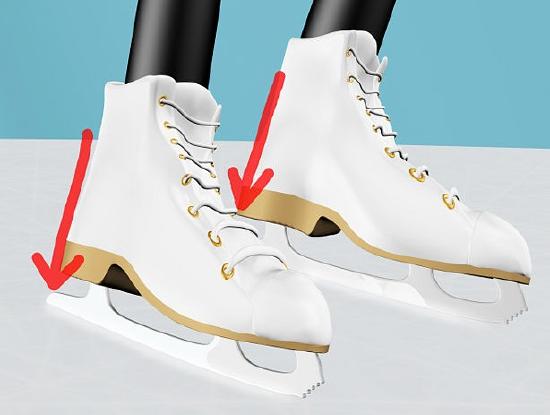
Until recently, many textbooks described ice skating as being possible because the pressure generated by the skater’s blade is high enough to melt the ice under the blade, thereby creating a lubricating layer of liquid water that enables the blade to slide across the ice. Although this explanation is intuitively satisfying, it is incorrect, as we can show by a simple calculation.
Recall that pressure (P) is the force (F) applied per unit area (A):
\[P=\dfrac{F}{A} \nonumber \]
To calculate the pressure an ice skater exerts on the ice, we need to calculate only the force exerted and the area of the skate blade. If we assume a 75.0 kg (165 lb) skater, then the force exerted by the skater on the ice due to gravity is
\[ F = mg \nonumber \]
where m is the mass and g is the acceleration due to Earth’s gravity (9.81 m/s2). Thus the force is
\[F = (75.0\; kg)(9.81\; m/s^2) = 736\; (kg•m)/s^2 = 736 N \nonumber \]
If we assume that the skate blades are 2.0 mm wide and 25 cm long, then the area of the bottom of each blade is
\[ A = (2.0 \times 10^{−3}\; m)(25 \times 10^{−2}\; m) = 5.0 \times 10^{−4} m^2 \nonumber \]
If the skater is gliding on one foot, the pressure exerted on the ice is
\[ P= \dfrac{736\;N}{5.0 \times 10^{-4} \; m^2} = 1.5 \times 10^6 \; N/m^2 = 1.5 \times 10^6\; Pa =15 \; atm \nonumber \]
The pressure is much lower than the pressure needed to decrease the melting point of ice by even 1°C, and experience indicates that it is possible to skate even when the temperature is well below freezing. Thus pressure-induced melting of the ice cannot explain the low friction that enables skaters (and hockey pucks) to glide. Recent research indicates that the surface of ice, where the ordered array of water molecules meets the air, consists of one or more layers of almost liquid water. These layers, together with melting induced by friction as a skater pushes forward, appear to account for both the ease with which a skater glides and the fact that skating becomes more difficult below about −7°C, when the number of lubricating surface water layers decreases.
Referring to the phase diagram of water in Figure \(\PageIndex{2}\):
- predict the physical form of a sample of water at 400°C and 150 atm.
- describe the changes that occur as the sample in part (a) is slowly allowed to cool to −50°C at a constant pressure of 150 atm.
Given: phase diagram, temperature, and pressure
Asked for: physical form and physical changes
Strategy:
- Identify the region of the phase diagram corresponding to the initial conditions and identify the phase that exists in this region.
- Draw a line corresponding to the given pressure. Move along that line in the appropriate direction (in this case cooling) and describe the phase changes.
Solution:
- A Locate the starting point on the phase diagram in part (a) in Figure \(\PageIndex{2}\). The initial conditions correspond to point A, which lies in the region of the phase diagram representing water vapor. Thus water at T = 400°C and P = 150 atm is a gas.
- B Cooling the sample at constant pressure corresponds to moving left along the horizontal line in part (a) in Figure \(\PageIndex{2}\). At about 340°C (point B), we cross the vapor pressure curve, at which point water vapor will begin to condense and the sample will consist of a mixture of vapor and liquid. When all of the vapor has condensed, the temperature drops further, and we enter the region corresponding to liquid water (indicated by point C). Further cooling brings us to the melting curve, the line that separates the liquid and solid phases at a little below 0°C (point D), at which point the sample will consist of a mixture of liquid and solid water (ice). When all of the water has frozen, cooling the sample to −50°C takes us along the horizontal line to point E, which lies within the region corresponding to solid water. At P = 150 atm and T = −50°C, therefore, the sample is solid ice.
Referring to the phase diagram of water in Figure \(\PageIndex{2}\), predict the physical form of a sample of water at −0.0050°C as the pressure is gradually increased from 1.0 mmHg to 218 atm.
- Answer
-
The sample is initially a gas, condenses to a solid as the pressure increases, and then melts when the pressure is increased further to give a liquid.
The Phase Diagram of Carbon Dioxide
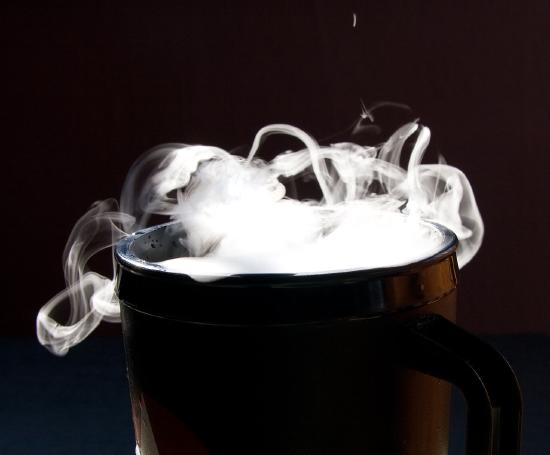
In contrast to the phase diagram of water, the phase diagram of CO2 (Figure \(\PageIndex{3}\)) has a more typical melting curve, sloping up and to the right. The triple point is −56.6°C and 5.11 atm, which means that liquid CO2 cannot exist at pressures lower than 5.11 atm. At 1 atm, therefore, solid CO2 sublimes directly to the vapor while maintaining a temperature of −78.5°C, the normal sublimation temperature. Solid CO2 is generally known as dry ice because it is a cold solid with no liquid phase observed when it is warmed.
Also notice the critical point at 30.98°C and 72.79 atm. Supercritical carbon dioxide is emerging as a natural refrigerant, making it a low carbon (and thus a more environmentally friendly) solution for domestic heat pumps.

The Critical Point
As the phase diagrams above demonstrate, a combination of high pressure and low temperature allows gases to be liquefied. As we increase the temperature of a gas, liquefaction becomes more and more difficult because higher and higher pressures are required to overcome the increased kinetic energy of the molecules. In fact, for every substance, there is some temperature above which the gas can no longer be liquefied, regardless of pressure. This temperature is the critical temperature (Tc), the highest temperature at which a substance can exist as a liquid. Above the critical temperature, the molecules have too much kinetic energy for the intermolecular attractive forces to hold them together in a separate liquid phase. Instead, the substance forms a single phase that completely occupies the volume of the container. Substances with strong intermolecular forces tend to form a liquid phase over a very large temperature range and therefore have high critical temperatures. Conversely, substances with weak intermolecular interactions have relatively low critical temperatures. Each substance also has a critical pressure (Pc), the minimum pressure needed to liquefy it at the critical temperature. The combination of critical temperature and critical pressure is called the critical point. The critical temperatures and pressures of several common substances are listed in Figure \(\PageIndex{1}\).
| Substance | Tc (°C) | Pc (atm) |
|---|---|---|
| NH3 | 132.4 | 113.5 |
| CO2 | 31.0 | 73.8 |
| CH3CH2OH (ethanol) | 240.9 | 61.4 |
| He | −267.96 | 2.27 |
| Hg | 1477 | 1587 |
| CH4 | −82.6 | 46.0 |
| N2 | −146.9 | 33.9 |
| H2O | 374.0 | 217.7 |
High-boiling-point, nonvolatile liquids have high critical temperatures and vice versa.
Supercritical Fluids
A Video Discussing Phase Diagrams. Video Source: Phase Diagrams(opens in new window) [youtu.be]