
2.2: Solubility Lab
- Page ID
- 339502

\( \newcommand{\vecs}[1]{\overset { \scriptstyle \rightharpoonup} {\mathbf{#1}} } \)
\( \newcommand{\vecd}[1]{\overset{-\!-\!\rightharpoonup}{\vphantom{a}\smash {#1}}} \)
\( \newcommand{\dsum}{\displaystyle\sum\limits} \)
\( \newcommand{\dint}{\displaystyle\int\limits} \)
\( \newcommand{\dlim}{\displaystyle\lim\limits} \)
\( \newcommand{\id}{\mathrm{id}}\) \( \newcommand{\Span}{\mathrm{span}}\)
( \newcommand{\kernel}{\mathrm{null}\,}\) \( \newcommand{\range}{\mathrm{range}\,}\)
\( \newcommand{\RealPart}{\mathrm{Re}}\) \( \newcommand{\ImaginaryPart}{\mathrm{Im}}\)
\( \newcommand{\Argument}{\mathrm{Arg}}\) \( \newcommand{\norm}[1]{\| #1 \|}\)
\( \newcommand{\inner}[2]{\langle #1, #2 \rangle}\)
\( \newcommand{\Span}{\mathrm{span}}\)
\( \newcommand{\id}{\mathrm{id}}\)
\( \newcommand{\Span}{\mathrm{span}}\)
\( \newcommand{\kernel}{\mathrm{null}\,}\)
\( \newcommand{\range}{\mathrm{range}\,}\)
\( \newcommand{\RealPart}{\mathrm{Re}}\)
\( \newcommand{\ImaginaryPart}{\mathrm{Im}}\)
\( \newcommand{\Argument}{\mathrm{Arg}}\)
\( \newcommand{\norm}[1]{\| #1 \|}\)
\( \newcommand{\inner}[2]{\langle #1, #2 \rangle}\)
\( \newcommand{\Span}{\mathrm{span}}\) \( \newcommand{\AA}{\unicode[.8,0]{x212B}}\)
\( \newcommand{\vectorA}[1]{\vec{#1}} % arrow\)
\( \newcommand{\vectorAt}[1]{\vec{\text{#1}}} % arrow\)
\( \newcommand{\vectorB}[1]{\overset { \scriptstyle \rightharpoonup} {\mathbf{#1}} } \)
\( \newcommand{\vectorC}[1]{\textbf{#1}} \)
\( \newcommand{\vectorD}[1]{\overrightarrow{#1}} \)
\( \newcommand{\vectorDt}[1]{\overrightarrow{\text{#1}}} \)
\( \newcommand{\vectE}[1]{\overset{-\!-\!\rightharpoonup}{\vphantom{a}\smash{\mathbf {#1}}}} \)
\( \newcommand{\vecs}[1]{\overset { \scriptstyle \rightharpoonup} {\mathbf{#1}} } \)
\(\newcommand{\longvect}{\overrightarrow}\)
\( \newcommand{\vecd}[1]{\overset{-\!-\!\rightharpoonup}{\vphantom{a}\smash {#1}}} \)
\(\newcommand{\avec}{\mathbf a}\) \(\newcommand{\bvec}{\mathbf b}\) \(\newcommand{\cvec}{\mathbf c}\) \(\newcommand{\dvec}{\mathbf d}\) \(\newcommand{\dtil}{\widetilde{\mathbf d}}\) \(\newcommand{\evec}{\mathbf e}\) \(\newcommand{\fvec}{\mathbf f}\) \(\newcommand{\nvec}{\mathbf n}\) \(\newcommand{\pvec}{\mathbf p}\) \(\newcommand{\qvec}{\mathbf q}\) \(\newcommand{\svec}{\mathbf s}\) \(\newcommand{\tvec}{\mathbf t}\) \(\newcommand{\uvec}{\mathbf u}\) \(\newcommand{\vvec}{\mathbf v}\) \(\newcommand{\wvec}{\mathbf w}\) \(\newcommand{\xvec}{\mathbf x}\) \(\newcommand{\yvec}{\mathbf y}\) \(\newcommand{\zvec}{\mathbf z}\) \(\newcommand{\rvec}{\mathbf r}\) \(\newcommand{\mvec}{\mathbf m}\) \(\newcommand{\zerovec}{\mathbf 0}\) \(\newcommand{\onevec}{\mathbf 1}\) \(\newcommand{\real}{\mathbb R}\) \(\newcommand{\twovec}[2]{\left[\begin{array}{r}#1 \\ #2 \end{array}\right]}\) \(\newcommand{\ctwovec}[2]{\left[\begin{array}{c}#1 \\ #2 \end{array}\right]}\) \(\newcommand{\threevec}[3]{\left[\begin{array}{r}#1 \\ #2 \\ #3 \end{array}\right]}\) \(\newcommand{\cthreevec}[3]{\left[\begin{array}{c}#1 \\ #2 \\ #3 \end{array}\right]}\) \(\newcommand{\fourvec}[4]{\left[\begin{array}{r}#1 \\ #2 \\ #3 \\ #4 \end{array}\right]}\) \(\newcommand{\cfourvec}[4]{\left[\begin{array}{c}#1 \\ #2 \\ #3 \\ #4 \end{array}\right]}\) \(\newcommand{\fivevec}[5]{\left[\begin{array}{r}#1 \\ #2 \\ #3 \\ #4 \\ #5 \\ \end{array}\right]}\) \(\newcommand{\cfivevec}[5]{\left[\begin{array}{c}#1 \\ #2 \\ #3 \\ #4 \\ #5 \\ \end{array}\right]}\) \(\newcommand{\mattwo}[4]{\left[\begin{array}{rr}#1 \amp #2 \\ #3 \amp #4 \\ \end{array}\right]}\) \(\newcommand{\laspan}[1]{\text{Span}\{#1\}}\) \(\newcommand{\bcal}{\cal B}\) \(\newcommand{\ccal}{\cal C}\) \(\newcommand{\scal}{\cal S}\) \(\newcommand{\wcal}{\cal W}\) \(\newcommand{\ecal}{\cal E}\) \(\newcommand{\coords}[2]{\left\{#1\right\}_{#2}}\) \(\newcommand{\gray}[1]{\color{gray}{#1}}\) \(\newcommand{\lgray}[1]{\color{lightgray}{#1}}\) \(\newcommand{\rank}{\operatorname{rank}}\) \(\newcommand{\row}{\text{Row}}\) \(\newcommand{\col}{\text{Col}}\) \(\renewcommand{\row}{\text{Row}}\) \(\newcommand{\nul}{\text{Nul}}\) \(\newcommand{\var}{\text{Var}}\) \(\newcommand{\corr}{\text{corr}}\) \(\newcommand{\len}[1]{\left|#1\right|}\) \(\newcommand{\bbar}{\overline{\bvec}}\) \(\newcommand{\bhat}{\widehat{\bvec}}\) \(\newcommand{\bperp}{\bvec^\perp}\) \(\newcommand{\xhat}{\widehat{\xvec}}\) \(\newcommand{\vhat}{\widehat{\vvec}}\) \(\newcommand{\uhat}{\widehat{\uvec}}\) \(\newcommand{\what}{\widehat{\wvec}}\) \(\newcommand{\Sighat}{\widehat{\Sigma}}\) \(\newcommand{\lt}{<}\) \(\newcommand{\gt}{>}\) \(\newcommand{\amp}{&}\) \(\definecolor{fillinmathshade}{gray}{0.9}\)
Learning Objectives
Goals:
- Collect experimental data and create a solubility curve.
By the end of this lab, students should be able to:
- Properly use an analytical balance to measure mass.
- Set up an experimental work station to measure the solubility of a salt in water as a function of the temperature.
- Generate a Workbook using Google Sheets.
Prior knowledge:
Safety
- Emergency Preparedness
- Eye protection is mandatory in this lab, and you should not wear shorts or open toed shoes.
- KClO3 PubChem LCSS
- Minimize Risk
- Check the cord on the hotplate, inform the instructor if it is frayed.
- Make sure the electrical cord never touches the surface of the hotplate
- Recognize Hazards
- You will be working with an alcohol thermometer and care must be taken when handling it. You will be using a water bath to heat your solution and must always take care not to let the thermometer touch the bottom of the glass where it is in contact with the hot plate.
- All waste is placed in the labeled container in the hood and will be recycled when the lab is over. Contact your instructor if the waste container is full, or about full.
Please see UPenn EHRS Hot Plate Malfunctions and Misuse site for more information on accidents involving hot plates.
 Figure \(\PageIndex{1}\): The hotplate on the left shows the aftermath of a fire when when a non-heat resistant container was placed on a hotplate. The worker thought they were only using the magnetic stirrer. (2021) The hot plate on the right should be discarded (CC0)
Equipment and materials needed
| Burette | 500 mL beaker | 250 ml beaker |
| 8 in test tube | Thermometer | Wire Stirrer |
| Cork for 8 in test tube w/slot for stirrer and thermometer | Test tube clamp | Ring stand |
| 5 small test tubes and rack | analytical balance | Hot plate |
| KClO3(s) | Ice |

Figure \(\PageIndex{2}\): Experimental setup. See how the thermometer goes through the stirrer. When placing the test tube into the water bath do not have it touch the bottom, but add enough water to the bath so that it goes up to about an 2 inches from the top when the thermometer is inserted. (Copyright; Belford CC-BY)
Background
We are dissolving a salt in water and like most (not all) salts the solubility increases when the temperature increases and you need to figure out the concentration of a saturated solution as a function of the temperature, make 5 measurements and plot them. In each measurement you mix known masses of the salt and the water.
Problem 1: Figure \(\PageIndex{2}\)(a) is reading the temperature of a saturated solution, the problem is we do not know the concentration of the salt that dissolved. That is, the total salt added is the mass of the salt dissolved and the mass of the precipitate.
\[m_{Total \; Salt} = m_{Dissolved \; Salt} \; + \; m_{Precipitated \; Salt}\]
So even though the solution is saturated, we do no know its concentration of the solution, only the total concentration.
 Figure \(\PageIndex{3}\): (a) left image shows a saturated solution with precipitate on the bottom, (b) middle image shows refluxing that can occur for high temperatures and (c) shows crystals forming where the cooler condensed water from the refluxing flows down the tube and hits the hotter water. (Copyright; Belford CC-BY)
Problem 2: Figure\(\PageIndex{2}\)(b) shows refluxing where hot water vapor rises up inside the test tube and hits the colder glass surface that is exposed to the air and condenses. When enough condensed water forms it flows back into the solution. When this cooler water hits the bulk hot water it cools it down, figure \(\PageIndex{2}\)(c), the solubility goes down and crystals form in a ring on the surface of the test tube at the interface of the hot liquid and the air. These crystals are a false reading and due to a temperature gradient, and we do not know the temperature that they were formed at, just that it is colder than the bulk temperature, which is the temperature the thermometer is reading.
Experimental Design Considerations
In designing experiments we want to think about the principles of green chemistry and the first principle is to avoid waste.
Consideration \(\PageIndex{1}\): Measuring the concentration of a saturated solution
If you know the total mass of solute from eq. 3.2.1 how can you calculate the amount dissolved? Think of a way to run the experiment, and then look at the suggestions.
- Suggestions
-
You heat the solution until it all dissolves. You then cool it and read the temperature at the moment the very first crystal appears. Initially the solution was unsaturated as it was cooling, and the moment it became saturated the next decrease in temperature would result in precipitate forming. So the value you read is actually slightly lower. The other alternative is to slowly heat it until the last piece of solid disappears. You need to be careful in understanding what a saturated solution means. Whenever there is solid it is saturated, the problem is we do not know how to measure the mass dissolved. But when we do not see solid that does not mean it is saturated, as it could be unsaturated. This has often lead this experiment to lead to misconceptions about what a saturated solution is, and in the postlab we will look at this from the perspective of a virtual lab, where we can directly measure mDissolved Salt.
So we want to know the temperature at which the first fleck of crystal appears, and say that at that temperature, all the salt was dissolved, anything above was unsaturated, and anything below is saturated.
Consideration \(\PageIndex{2}\): Reducing Waste
Instead of making 5 different solutions, think of how you could design an experimental protocol that minimizes waste. After spending a minute or so look at the suggestions.
- Suggestions
-
You can start with one solution and either add water or salt to it and make multiple measurements at different temperatures of that solution as the concentration changes. Since the solubility goes up with temperature you want to start with the hotest solution, which would be the most concentrated solution with a small volume and then add cool water to dilute it. If the solubility went down with heat then you would start with a cold solution and add hot water to dilute it.
In this experiment you will start with around 10 mL of a solution and successively add water in 5 mL increments (see procedures).
You are running the experiment in the chemistry lab, which is the ultimate heat sink. That is, hot solutions will cool to ambient (room) temperature and cold ones will warm to ambient temperature The rate of heat transfer is related to the temperature difference between the hot and cold object and you will see that the hottest solutions cool really fast, while the cooler ones will take a longer amount of time. When you successively dilute your solution by adding 5 mL of water you will need to cool it to the temperature where the first crystal appears, and if it cools real fast, crystals will form the moment you add the 5 mL of water. This means you will need to heat the solution up, and it will take a lot longer to complete the lab.
Consideration \(\PageIndex{3}\): Adding your solutions fast enough so the hot ones do not cool below the saturation temperature of the next diluted solution
Using the material in the equipment and materials section, com up with an experimental protocol to allow you to rapidly transfer 5 mL of water the moment you read the temperature for when you first see crystals form. After spending a minute or so look at the suggestions.
- Suggestions
-
Before you heat the solution take the 5 small test tubes and pour 5 mL of water from the burette into each of them and place in the test tube rack. Have one student measure the temperature when the first crystal forms and have the other student quickly add the water. If you are quick enough, you will not have to reheat the solution. This is only a problem for the high temperature solutions.
Review the section on volumetric containers. Note some are labeled TD (To Deliver) and others are labeled TC (To Contain). The Burette is a TD and you delivered 5.00 mL of water to the test tube. When you then poured from the small test tube to the large one you notice some water clings to the side. So the small test tube contained 5.00mL, it did not deliver it.
Consideration \(\PageIndex{4}\): Accounting for water clinging to the side of the test tube when you diluted the hot solution
How can you transfer 5.00 mL from the small test tube when some water clings to it?
- Suggestions
-
You can "wet" the test tube before you add the 5.00 mL from the burette. When you wet it you should fill it up and then empty it, just like you will do when running the experiment. Hopefully the same amount of water clings to the test tube when you wet it, and when you run the experiment.
As stated earlier, the rate of heat transfer is proportional to the temperature difference. At some point you will reach room temperature and the solution will no longer cool.
Consideration \(\PageIndex{5}\): How can you speed up the rate of cooling for room temperature experiments, or even cool the solution below room temperature?
Using the material in the equipment and materials section, com up with an experimental protocol to allow you to speed up the rate of heat transfer, or make it cooler than the room. After spending a minute or so look at the suggestions.
- Suggestions
-
Slowly add ice to the water bath. You do not want to cool too quick, as you do not want the surface of the test tube to be a different temperature than the bulk solution. Read the temperature and quickly stirr if crystals form on the side of the test tube. If they redissolve it was a false reading.
Experimental Procedures
Teams of 2-3 individuals will work cooperatively to perform this experiment and fill out the solubility lab datasheet. Before leaving the lab they need to write their name on the sheet and get the instructor's dated signature. Each student individually submits a photocopy of the signed worksheet through the form in section 2.3 Solubility Lab Report of the LibreTexts lab manual.
- Weigh about 4.2 grams of KClO3 record this mass to the 0.0001 g in your datasheet.
- Quantitatively transfer the KClO3 to the 8 inch test tube
- Calculate the volume of DI (Deionized) water you would need to add to that mass to make a solution that is approximately 28% KClO3 by mass. Assume the density of water to be 1.000 g/mL.
- Using a burette transfer around that volume of water to the 8 in test tube containing the KClO3. Record in the datasheet the exact volume of water transferred.
- Place the four small test tubes in a rack,
- wet them with DI
- empty them like you would if you were pouring them into the large test tube
- fill a 250 mL about 70% full with DI water
- using a 5 mL pipette transfer 5.00 mL of the DI water from the beaker to each test tube in the rack.
- Place about 300 ml of water in a 500 mL beaker and heat to approximately 90o C. Make sure to inspect the electrical line and keep it from touching the hot surface. You will use this water bath to heat your solution.
- Place a notched stopper through which is suspended a thermometer probe and a wire stirrer, into the mouth of the test tube as shown in figures \(\PageIndex{1}\) and \(\PageIndex{4}\). Lower the tube into the hot water bath and stir the contents with the wire stirrer until the crystals have all dissolved. Remove the tube from the water bath and allow the contents to cool while continuing to stir the mixture. Carefully observe the contents of the tube while cooling is occurring and note and record the temperature at which crystals first appear.
 Figure \(\PageIndex{4}\): Solubility apparatus setup. (Copyright; Belford CC-BY)
- Add additional 5 mL of water and continue cooling if crystals dissolve upon dilution. If they do not dissolve, place back in water bath until they dissolve. If you do this step rapidly the solution will not have cooled enough to be saturated and they will not need to be reheated.
- Repeat steps 5 and 6 until you have recorded data for a total of 5 solutions, recording all values in your data sheet.
Data Analysis
In this lab you will work your data up in a Google Spreadsheet.
Sheet 1
The first sheet of your Workbook is always your cover page.
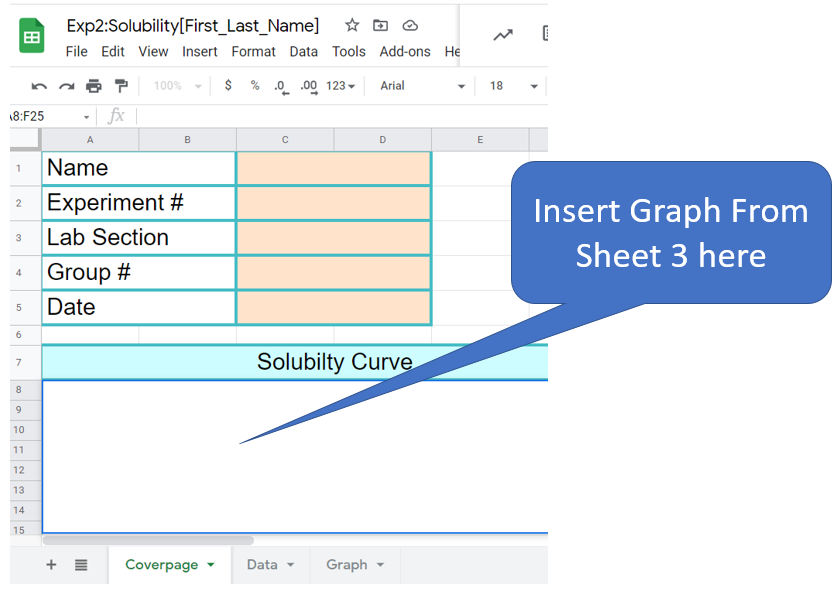 Figure \(\PageIndex{5}\): Cover Page. (Copyright; Belford CC 0.0)
Sheet 2
The second sheet will be where you work up your data. Copy the raw data from the datasheet you used in class and paste it into the "orange" cells. Then perform the calculations in the blue cells. You must put your answers in this table, as it is connected to the grader's workbook. If you choose, you can use functions in this sheet, or you can do the calculations by hand.
 Figure \(\PageIndex{6}\): Data Page. (Copyright; Belford CC 0.0)
Sheet 3
In this sheet you will insert a chart with a graph of the solubility (g salt/100 g H2O) as a function of temperature. Once the graph is complete you will copy it to the cover page. Do not fit a trend line to the graph, but use the smooth line chart, as indicated in figure \(\PageIndex{7}\)
 Figure \(\PageIndex{7}\): Do not add a trend line. In the Chart editor choose "Smooth line chart (Copyright; Belford cc 0.0)