
1.8: ADC and MQ Gas Sensors
- Page ID
- 374383
\( \newcommand{\vecs}[1]{\overset { \scriptstyle \rightharpoonup} {\mathbf{#1}} } \)
\( \newcommand{\vecd}[1]{\overset{-\!-\!\rightharpoonup}{\vphantom{a}\smash {#1}}} \)
\( \newcommand{\id}{\mathrm{id}}\) \( \newcommand{\Span}{\mathrm{span}}\)
( \newcommand{\kernel}{\mathrm{null}\,}\) \( \newcommand{\range}{\mathrm{range}\,}\)
\( \newcommand{\RealPart}{\mathrm{Re}}\) \( \newcommand{\ImaginaryPart}{\mathrm{Im}}\)
\( \newcommand{\Argument}{\mathrm{Arg}}\) \( \newcommand{\norm}[1]{\| #1 \|}\)
\( \newcommand{\inner}[2]{\langle #1, #2 \rangle}\)
\( \newcommand{\Span}{\mathrm{span}}\)
\( \newcommand{\id}{\mathrm{id}}\)
\( \newcommand{\Span}{\mathrm{span}}\)
\( \newcommand{\kernel}{\mathrm{null}\,}\)
\( \newcommand{\range}{\mathrm{range}\,}\)
\( \newcommand{\RealPart}{\mathrm{Re}}\)
\( \newcommand{\ImaginaryPart}{\mathrm{Im}}\)
\( \newcommand{\Argument}{\mathrm{Arg}}\)
\( \newcommand{\norm}[1]{\| #1 \|}\)
\( \newcommand{\inner}[2]{\langle #1, #2 \rangle}\)
\( \newcommand{\Span}{\mathrm{span}}\) \( \newcommand{\AA}{\unicode[.8,0]{x212B}}\)
\( \newcommand{\vectorA}[1]{\vec{#1}} % arrow\)
\( \newcommand{\vectorAt}[1]{\vec{\text{#1}}} % arrow\)
\( \newcommand{\vectorB}[1]{\overset { \scriptstyle \rightharpoonup} {\mathbf{#1}} } \)
\( \newcommand{\vectorC}[1]{\textbf{#1}} \)
\( \newcommand{\vectorD}[1]{\overrightarrow{#1}} \)
\( \newcommand{\vectorDt}[1]{\overrightarrow{\text{#1}}} \)
\( \newcommand{\vectE}[1]{\overset{-\!-\!\rightharpoonup}{\vphantom{a}\smash{\mathbf {#1}}}} \)
\( \newcommand{\vecs}[1]{\overset { \scriptstyle \rightharpoonup} {\mathbf{#1}} } \)
\( \newcommand{\vecd}[1]{\overset{-\!-\!\rightharpoonup}{\vphantom{a}\smash {#1}}} \)
\(\newcommand{\avec}{\mathbf a}\) \(\newcommand{\bvec}{\mathbf b}\) \(\newcommand{\cvec}{\mathbf c}\) \(\newcommand{\dvec}{\mathbf d}\) \(\newcommand{\dtil}{\widetilde{\mathbf d}}\) \(\newcommand{\evec}{\mathbf e}\) \(\newcommand{\fvec}{\mathbf f}\) \(\newcommand{\nvec}{\mathbf n}\) \(\newcommand{\pvec}{\mathbf p}\) \(\newcommand{\qvec}{\mathbf q}\) \(\newcommand{\svec}{\mathbf s}\) \(\newcommand{\tvec}{\mathbf t}\) \(\newcommand{\uvec}{\mathbf u}\) \(\newcommand{\vvec}{\mathbf v}\) \(\newcommand{\wvec}{\mathbf w}\) \(\newcommand{\xvec}{\mathbf x}\) \(\newcommand{\yvec}{\mathbf y}\) \(\newcommand{\zvec}{\mathbf z}\) \(\newcommand{\rvec}{\mathbf r}\) \(\newcommand{\mvec}{\mathbf m}\) \(\newcommand{\zerovec}{\mathbf 0}\) \(\newcommand{\onevec}{\mathbf 1}\) \(\newcommand{\real}{\mathbb R}\) \(\newcommand{\twovec}[2]{\left[\begin{array}{r}#1 \\ #2 \end{array}\right]}\) \(\newcommand{\ctwovec}[2]{\left[\begin{array}{c}#1 \\ #2 \end{array}\right]}\) \(\newcommand{\threevec}[3]{\left[\begin{array}{r}#1 \\ #2 \\ #3 \end{array}\right]}\) \(\newcommand{\cthreevec}[3]{\left[\begin{array}{c}#1 \\ #2 \\ #3 \end{array}\right]}\) \(\newcommand{\fourvec}[4]{\left[\begin{array}{r}#1 \\ #2 \\ #3 \\ #4 \end{array}\right]}\) \(\newcommand{\cfourvec}[4]{\left[\begin{array}{c}#1 \\ #2 \\ #3 \\ #4 \end{array}\right]}\) \(\newcommand{\fivevec}[5]{\left[\begin{array}{r}#1 \\ #2 \\ #3 \\ #4 \\ #5 \\ \end{array}\right]}\) \(\newcommand{\cfivevec}[5]{\left[\begin{array}{c}#1 \\ #2 \\ #3 \\ #4 \\ #5 \\ \end{array}\right]}\) \(\newcommand{\mattwo}[4]{\left[\begin{array}{rr}#1 \amp #2 \\ #3 \amp #4 \\ \end{array}\right]}\) \(\newcommand{\laspan}[1]{\text{Span}\{#1\}}\) \(\newcommand{\bcal}{\cal B}\) \(\newcommand{\ccal}{\cal C}\) \(\newcommand{\scal}{\cal S}\) \(\newcommand{\wcal}{\cal W}\) \(\newcommand{\ecal}{\cal E}\) \(\newcommand{\coords}[2]{\left\{#1\right\}_{#2}}\) \(\newcommand{\gray}[1]{\color{gray}{#1}}\) \(\newcommand{\lgray}[1]{\color{lightgray}{#1}}\) \(\newcommand{\rank}{\operatorname{rank}}\) \(\newcommand{\row}{\text{Row}}\) \(\newcommand{\col}{\text{Col}}\) \(\renewcommand{\row}{\text{Row}}\) \(\newcommand{\nul}{\text{Nul}}\) \(\newcommand{\var}{\text{Var}}\) \(\newcommand{\corr}{\text{corr}}\) \(\newcommand{\len}[1]{\left|#1\right|}\) \(\newcommand{\bbar}{\overline{\bvec}}\) \(\newcommand{\bhat}{\widehat{\bvec}}\) \(\newcommand{\bperp}{\bvec^\perp}\) \(\newcommand{\xhat}{\widehat{\xvec}}\) \(\newcommand{\vhat}{\widehat{\vvec}}\) \(\newcommand{\uhat}{\widehat{\uvec}}\) \(\newcommand{\what}{\widehat{\wvec}}\) \(\newcommand{\Sighat}{\widehat{\Sigma}}\) \(\newcommand{\lt}{<}\) \(\newcommand{\gt}{>}\) \(\newcommand{\amp}{&}\) \(\definecolor{fillinmathshade}{gray}{0.9}\)Task 1: View the following YouTube videos on Analog to Digital Converters
The explanation of the analog vs digital signals
MCP3008 Integrated Circuit Chip
The Raspberry Pi computer does not have the ability to read analog signals, therefore we need to change them to digital signals. This is accomplished using an MCP3008 integrated circuit chip. This is a 10 bit chip (1024 steps) from 0 to 1 in the range of voltages that we are using. It can monitor eight analog inputs using the SPI communication protocol we used in the last activity.
This chip has 16 pins, and are numbered according to the following diagram. Pin one is indicated on the chip with a little “dimple” on the top of the chip (indicated with the arrow in Figure \(\PageIndex{2}\)). The eight analog inputs are found on the side with the dimple, and all other connections are done on the other side.
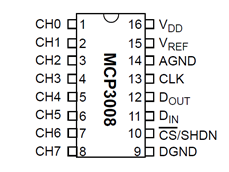
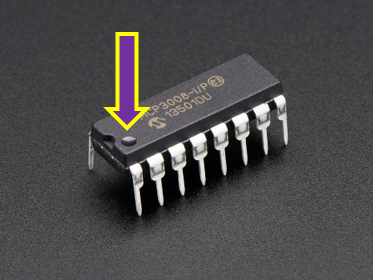
Figure \(\PageIndex{2}\): Pin one is indicated with a little “dimple”
VDD connected to 3.3V and provides the power for the chip. DGND (digital ground) is the ground for the chip itself.
The four SPI data pins are:
- DOUT (Data out from MCP3008) and connects to MISO (Master Input Slave Output)
- DIN (Data in from Raspberry Pi) and connects to MOSI (Master Output Slave Input)
- CLK (Clock Pin) and connects to the serial clock (CLK)
- CS (Chip Select) and connect to CE0
Finally, the last two pins are the VREF (Reference Voltage) and the AGND (Analog Ground), which are used to change the scale. We are using 3.3V for our scale.
Light Dependent Resistors
Light dependent resistors, also known as photoresistors, photocells or photo-conductive cell, work by reducing resistance when the light hits the sensitive surface. In the dark, the resistance is at the highest point (up to several megaohms), while it full light the resistance goes down to just a few hundred ohms.

Task 2A: Start to build a circuit with an MCP3008 ADC chip
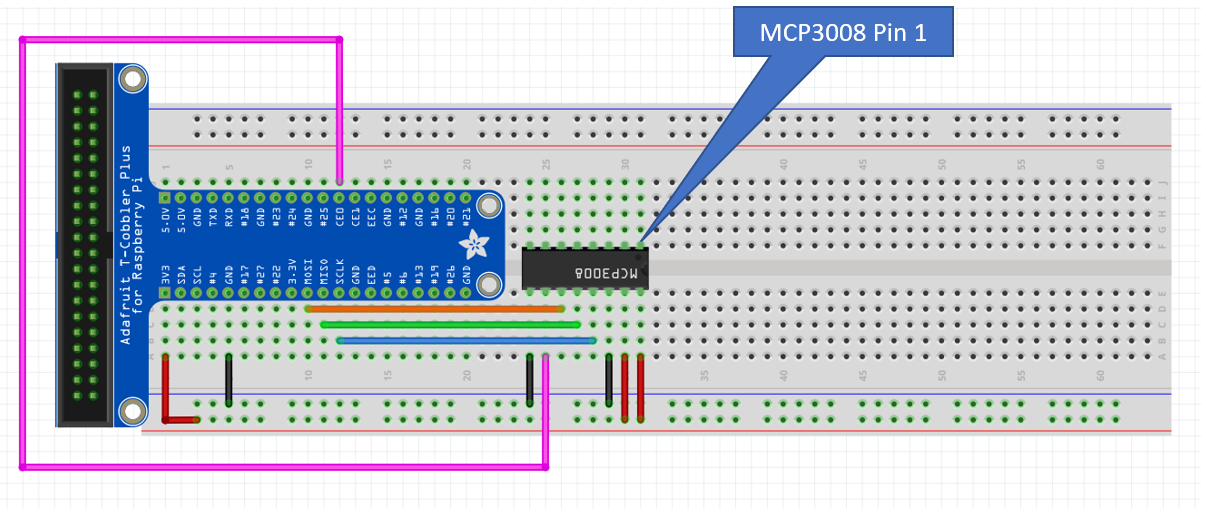
Using your breadboard with a T-cobbler, place the MCP3008 chip on the board. Connect the pins using the male to male leads in your kit. In the connection diagram shown in Figure \(\PageIndex{3}\), the MCP3008 is upside-down for easier connection. Pin 1 of the MCP3008 is marked in the diagram. You can identify it on your MCP3008 by a small circular indentation.
MCP3008:
- Pin 16 (VDD) connects to your positive rail
- Pin 15 (VREF) connects to your positive rail
- Pin 14 (AGND) connects to your ground rail
- Pin 13 (CLK) connects to SCLK on your T-cobbler (Board pin 23)
- Pin 12(DOUT) connects to MISO on your T-cobbler (Board pin 21)
- Pin 11(DIN) connects to MOSI on your T-cobbler (Board pin 19)
- Pin 10 (CS) connects to CE0 on your T-cobbler (Board pin 24)
- Pin 9(DGND) connects to your ground rail
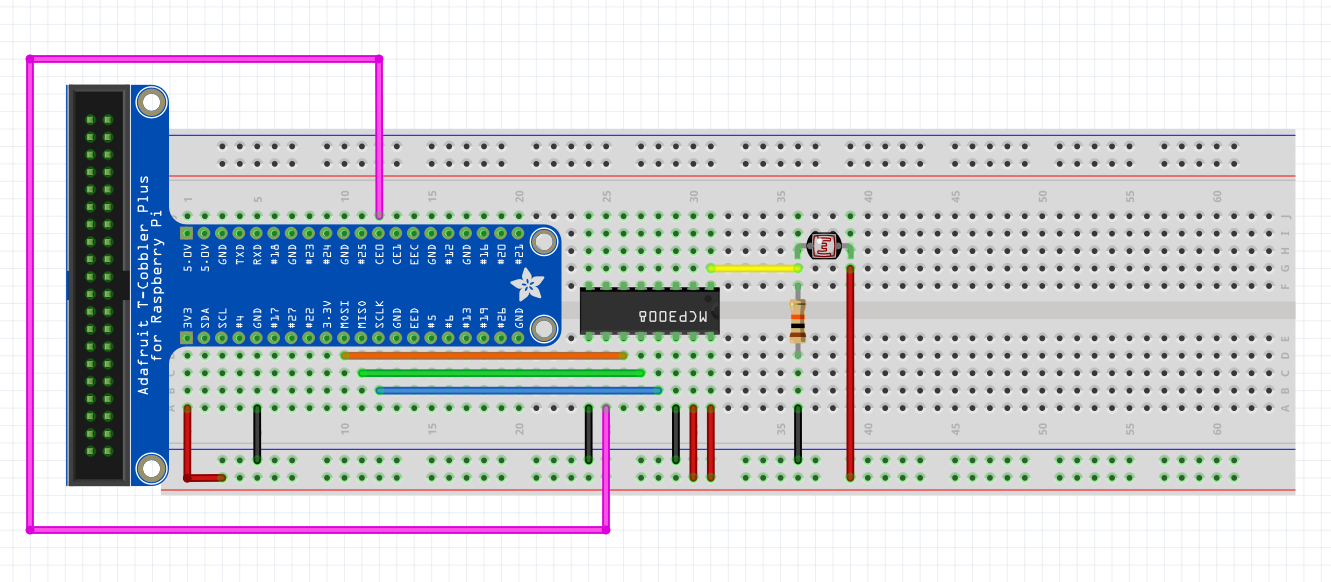
Task 2B: Connect a light sensor to your MCP3008 ADC chip
Connect one leg of the LDR to the hot rail and the other leg (signal) to pin 1 of the MCP3008 (remember that pin 1 is marked with a round indentation). Now you need to add a 10kΩ resistor between signal and ground rail.
Task 3: Measure light values
For this task, enter and execute the following program with your Thonny IDE on your Raspberry Pi. The value argument for MCP3008 returns a read value from the device scaled to a value between 0 and 1.
| Python Program 1 |
|---|
from gpiozero import MCP3008
from time import sleep

adc0 = MCP3008(channel=0)

while True:
    print(adc0.value)
    sleep(1)
|
Try covering the LDR or use a flashlight. If the value has changed as the result, then your circuit is working correctly, and you can proceed to the next task. If the value stays the same, or you are getting an error, go back and check the wiring. Remember to pay attention to the location of pin one.
Task 4: Introduction to Metal Oxide Sensors
The following short video illustrates how Metal oxide sensors can detect gases.
MQ-2 Gas Sensor
After you made sure that MCP3008 is connected correctly, you can start working on the next circuit. For this project, we will use the MQ-2 sensor, that can measure the concentration and/or presence of combustible gases in the air, such as hydrogen, LPG (liquid petroleum gas), methane, carbon monoxide, alcohol, smoke, and propane. This sensor is traditionally used to help detect gas leaks in many family and industrial practices.
MQ2 sensor (and other metal oxide sensors) has a built-in heating element that requires an initial burn-in, which takes 24 - 48 hours. You can start getting readings from the sensor right away, but they won't be accurate.
Logic Level Converter
The heating element needs at least 5V to operate properly, but Raspberry Pi can only read a signal at 3.3V. We are introducing a bi-directional logic level converter to this circuit to solve this problem.
The logic level converter has 6 pins on each side. Four of them are used to step down from 5V to 3.3V and to step up from 3.3V to 5V. Both sides need to be connected to hot and ground rails. The side marked HV corresponds to higher voltage (5V) and the side labeled LV corresponds to the lower voltage (3.3V).
Fritzing desn't have the exact model we are using, but it can be downloaded here and added to Fritzing. Read this tutorial to learn how to add parts and bins to Fritzing.
Task 5A: Get Readings from MQ-2 Sensor
You can continue working with the same circuit. Since we already know that MCP3008 is connected right, we can replace the LDR with the gas sensor and add a logic converter.
Before you begin, make sure you connected cobbler's 5.0V to the hot rail on the opposite side from 3.3V rail. Connect cobblers GND pin to the ground rail (same side as 5.0V). Refer to the connection diagram below.
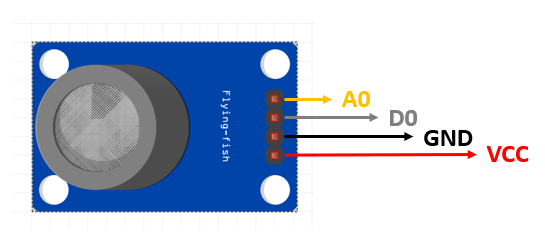
MQ-2 Sensor:
- VCC (voltage) pin connects to the 5.0V hot rail
- GND (ground) pin connects to the ground rail
- D0 (digital out) is not connected
- A0 (analog out) connects to channel 1 of the level converter
Logic Level Converter:
- HV connects to the 5.0V hot rail
- GND (on the HV side) connects to the ground rail (on the 5.0V side)
- LV connects to the 3.3V hot rail
- GND (on the LV side) connects to the ground rail (on the 3.3V side)
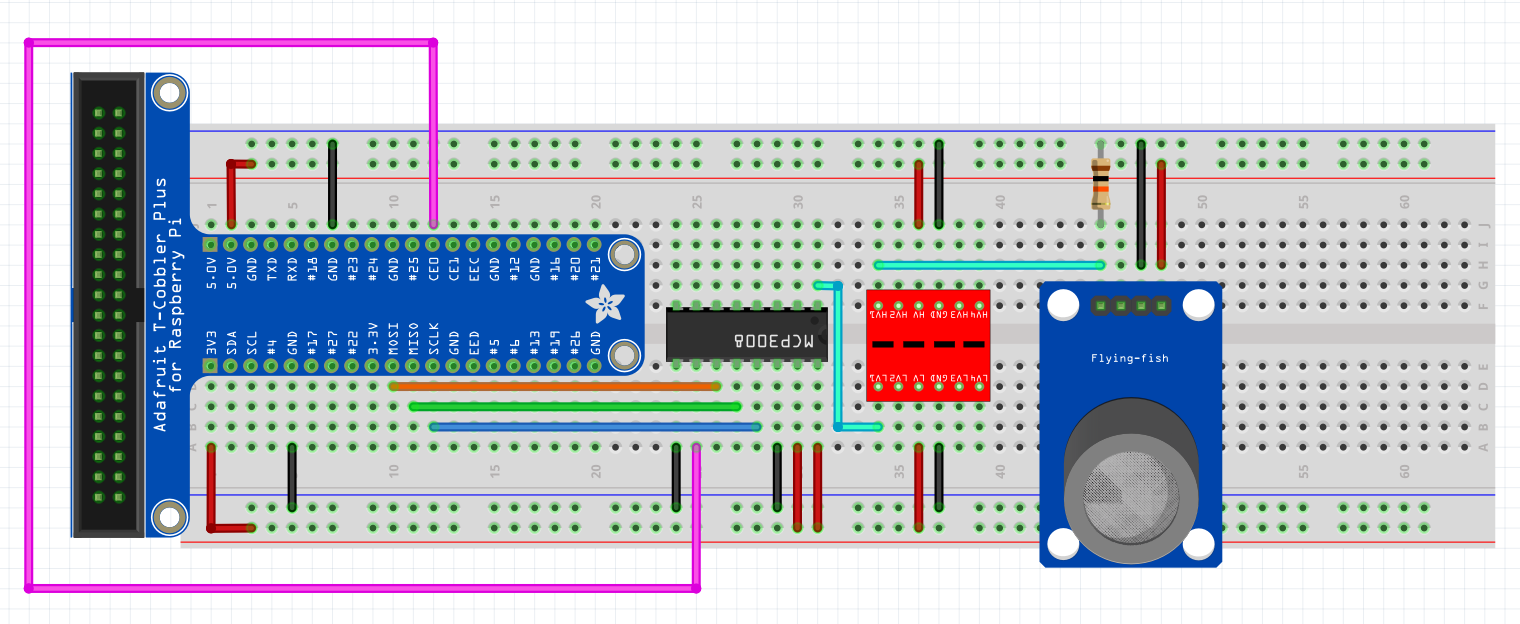
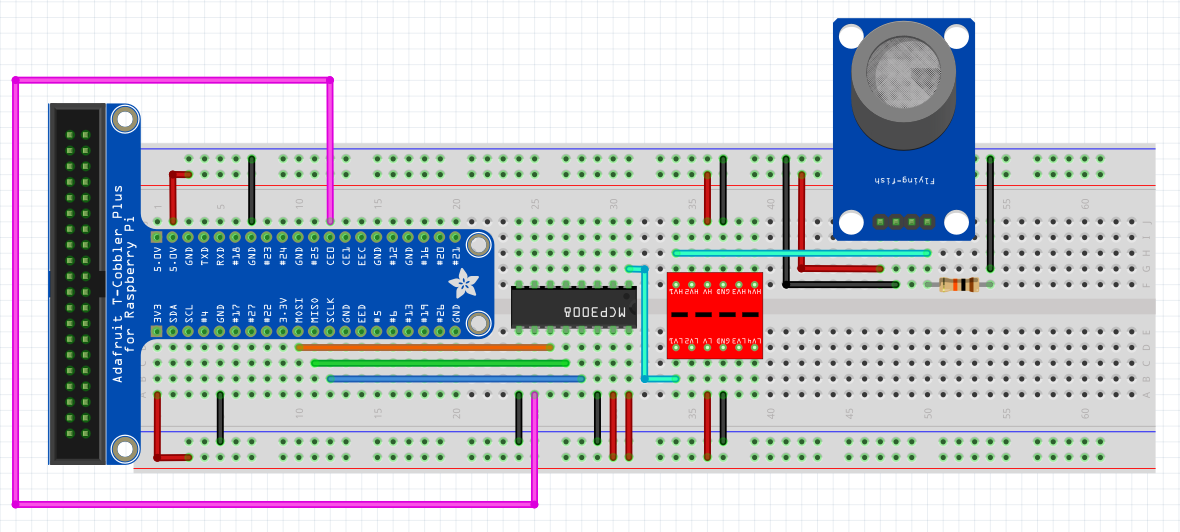 Figure \(\PageIndex{6}\): MQ-2 connection diagram (CC0; E. Lisitsyna)
Task 5B: Run the code
Note: in the code below, you will see two hard-coded values (LPGm and LPGb). Those values were calculated using the graph in the datasheet and Ohm's Law. If you are interested in the calculations, you can read this tutorial for the MQ-4 sensor. The whole process is described in great detail and can be applied to any of the gasses measured with the MQ sensors.
Run the code in Thonny.
| Python Program 2 |
|---|
#!/usr/bin/python3

import time
import math
import RPi.GPIO as GPIO
from gpiozero import MCP3008

def getR0():
    #set loop values to 0:
    value=0
    x=0

    for x in range (0,500): #get 500 consecutive readings
        value = value + adc0.raw_value #add all readings together
        x=x+1 #increase loop counter by 1

    sensorValue = value/500 #calculate the adc average value from 500 readings
    sensorVolt = ((sensorValue / 1023.0) * 3.3) #convert raw adc values to voltage

    #calculate R0 (sensor resistance in clean air)
    RSair = ((3.3*10)/sensorVolt)-10 #10 (load resistance or RL) value is taken from the datasheet
    R0=RSair/9.7 #from the datasheet Rs/R0 for clean air is constant, see graph (~9.7ppm)
    print ("Calculated R0: {:.5}".format (R0))
    return R0

adc0 = MCP3008(channel=0)
R0 = getR0()

while True:
    #LPM and LPGb values are calculated from the datasheet using Ohm's Law
    LPGm = -0.47 #slope (m)
    LPGb = 1.31 #y-intercept (b)

    sensorValue = adc0.raw_value
    sensorVolt=((sensorValue / 1023.0) * 3.3)
    RSgas = ((3.3*10)/sensorVolt)-10
    ratio = (RSgas/R0)

    LPGLog = (math.log10(ratio)-LPGb)/LPGm
    LPGppm = math.pow(10, LPGLog)
    LPGperc=LPGppm/10000

    print ("LPG concentration: {:.3}ppm".format(LPGppm))
    print ("LPG percent: {:.3}%".format (LPGperc))
    time.sleep(5)
|
- The code above will print out the concentration of liquid petroleum gas in ppm and percentage. Do you think those values are accurate? Explain.
- In your opinion, can the values provided by the MQ-2 sensor be used in science?
- Imagine that you were asked to set up a calibration procedure for the MQ-2 sensor. Describe the steps.
Homework Assignment
Using the code from Task 5B set up a data stream to a Google Sheet and add a scatter plot to your dashboard. Leave the Pi running for 24 hours and take a reading every 30 minutes (use cron for scheduling this task). As a result, you should see a nice graph showing how the change in readings during the burn-in process.