
9.4: Quantitative Analysis by Absorption Measurements
- Page ID
- 220470
\( \newcommand{\vecs}[1]{\overset { \scriptstyle \rightharpoonup} {\mathbf{#1}} } \)
\( \newcommand{\vecd}[1]{\overset{-\!-\!\rightharpoonup}{\vphantom{a}\smash {#1}}} \)
\( \newcommand{\id}{\mathrm{id}}\) \( \newcommand{\Span}{\mathrm{span}}\)
( \newcommand{\kernel}{\mathrm{null}\,}\) \( \newcommand{\range}{\mathrm{range}\,}\)
\( \newcommand{\RealPart}{\mathrm{Re}}\) \( \newcommand{\ImaginaryPart}{\mathrm{Im}}\)
\( \newcommand{\Argument}{\mathrm{Arg}}\) \( \newcommand{\norm}[1]{\| #1 \|}\)
\( \newcommand{\inner}[2]{\langle #1, #2 \rangle}\)
\( \newcommand{\Span}{\mathrm{span}}\)
\( \newcommand{\id}{\mathrm{id}}\)
\( \newcommand{\Span}{\mathrm{span}}\)
\( \newcommand{\kernel}{\mathrm{null}\,}\)
\( \newcommand{\range}{\mathrm{range}\,}\)
\( \newcommand{\RealPart}{\mathrm{Re}}\)
\( \newcommand{\ImaginaryPart}{\mathrm{Im}}\)
\( \newcommand{\Argument}{\mathrm{Arg}}\)
\( \newcommand{\norm}[1]{\| #1 \|}\)
\( \newcommand{\inner}[2]{\langle #1, #2 \rangle}\)
\( \newcommand{\Span}{\mathrm{span}}\) \( \newcommand{\AA}{\unicode[.8,0]{x212B}}\)
\( \newcommand{\vectorA}[1]{\vec{#1}} % arrow\)
\( \newcommand{\vectorAt}[1]{\vec{\text{#1}}} % arrow\)
\( \newcommand{\vectorB}[1]{\overset { \scriptstyle \rightharpoonup} {\mathbf{#1}} } \)
\( \newcommand{\vectorC}[1]{\textbf{#1}} \)
\( \newcommand{\vectorD}[1]{\overrightarrow{#1}} \)
\( \newcommand{\vectorDt}[1]{\overrightarrow{\text{#1}}} \)
\( \newcommand{\vectE}[1]{\overset{-\!-\!\rightharpoonup}{\vphantom{a}\smash{\mathbf {#1}}}} \)
\( \newcommand{\vecs}[1]{\overset { \scriptstyle \rightharpoonup} {\mathbf{#1}} } \)
\( \newcommand{\vecd}[1]{\overset{-\!-\!\rightharpoonup}{\vphantom{a}\smash {#1}}} \)
\(\newcommand{\avec}{\mathbf a}\) \(\newcommand{\bvec}{\mathbf b}\) \(\newcommand{\cvec}{\mathbf c}\) \(\newcommand{\dvec}{\mathbf d}\) \(\newcommand{\dtil}{\widetilde{\mathbf d}}\) \(\newcommand{\evec}{\mathbf e}\) \(\newcommand{\fvec}{\mathbf f}\) \(\newcommand{\nvec}{\mathbf n}\) \(\newcommand{\pvec}{\mathbf p}\) \(\newcommand{\qvec}{\mathbf q}\) \(\newcommand{\svec}{\mathbf s}\) \(\newcommand{\tvec}{\mathbf t}\) \(\newcommand{\uvec}{\mathbf u}\) \(\newcommand{\vvec}{\mathbf v}\) \(\newcommand{\wvec}{\mathbf w}\) \(\newcommand{\xvec}{\mathbf x}\) \(\newcommand{\yvec}{\mathbf y}\) \(\newcommand{\zvec}{\mathbf z}\) \(\newcommand{\rvec}{\mathbf r}\) \(\newcommand{\mvec}{\mathbf m}\) \(\newcommand{\zerovec}{\mathbf 0}\) \(\newcommand{\onevec}{\mathbf 1}\) \(\newcommand{\real}{\mathbb R}\) \(\newcommand{\twovec}[2]{\left[\begin{array}{r}#1 \\ #2 \end{array}\right]}\) \(\newcommand{\ctwovec}[2]{\left[\begin{array}{c}#1 \\ #2 \end{array}\right]}\) \(\newcommand{\threevec}[3]{\left[\begin{array}{r}#1 \\ #2 \\ #3 \end{array}\right]}\) \(\newcommand{\cthreevec}[3]{\left[\begin{array}{c}#1 \\ #2 \\ #3 \end{array}\right]}\) \(\newcommand{\fourvec}[4]{\left[\begin{array}{r}#1 \\ #2 \\ #3 \\ #4 \end{array}\right]}\) \(\newcommand{\cfourvec}[4]{\left[\begin{array}{c}#1 \\ #2 \\ #3 \\ #4 \end{array}\right]}\) \(\newcommand{\fivevec}[5]{\left[\begin{array}{r}#1 \\ #2 \\ #3 \\ #4 \\ #5 \\ \end{array}\right]}\) \(\newcommand{\cfivevec}[5]{\left[\begin{array}{c}#1 \\ #2 \\ #3 \\ #4 \\ #5 \\ \end{array}\right]}\) \(\newcommand{\mattwo}[4]{\left[\begin{array}{rr}#1 \amp #2 \\ #3 \amp #4 \\ \end{array}\right]}\) \(\newcommand{\laspan}[1]{\text{Span}\{#1\}}\) \(\newcommand{\bcal}{\cal B}\) \(\newcommand{\ccal}{\cal C}\) \(\newcommand{\scal}{\cal S}\) \(\newcommand{\wcal}{\cal W}\) \(\newcommand{\ecal}{\cal E}\) \(\newcommand{\coords}[2]{\left\{#1\right\}_{#2}}\) \(\newcommand{\gray}[1]{\color{gray}{#1}}\) \(\newcommand{\lgray}[1]{\color{lightgray}{#1}}\) \(\newcommand{\rank}{\operatorname{rank}}\) \(\newcommand{\row}{\text{Row}}\) \(\newcommand{\col}{\text{Col}}\) \(\renewcommand{\row}{\text{Row}}\) \(\newcommand{\nul}{\text{Nul}}\) \(\newcommand{\var}{\text{Var}}\) \(\newcommand{\corr}{\text{corr}}\) \(\newcommand{\len}[1]{\left|#1\right|}\) \(\newcommand{\bbar}{\overline{\bvec}}\) \(\newcommand{\bhat}{\widehat{\bvec}}\) \(\newcommand{\bperp}{\bvec^\perp}\) \(\newcommand{\xhat}{\widehat{\xvec}}\) \(\newcommand{\vhat}{\widehat{\vvec}}\) \(\newcommand{\uhat}{\widehat{\uvec}}\) \(\newcommand{\what}{\widehat{\wvec}}\) \(\newcommand{\Sighat}{\widehat{\Sigma}}\) \(\newcommand{\lt}{<}\) \(\newcommand{\gt}{>}\) \(\newcommand{\amp}{&}\) \(\definecolor{fillinmathshade}{gray}{0.9}\)Adsorption spectroscopy is one of the most useful and widely used tools in modern analytical chemistry for the quantitative analysis of analytes in solution. Important characteristics of spectrophotometric methods include:
1) wide applicability to many organic and inorganic species that absorb
2) sensitivities to 10-5 M
3) moderate to high selectivity by choice of wavelength
4) good accuracy
5) precision on the order of 1 - 3 % RSD
Numerous selective reagents are available to extend spectrophotometry to non absorbing species. An important examples is the Griess method for nitrite. As shown in Figure 9.4.1, the Griess method involves two acid catalyzed reactions to produce a strongly absorbing colored azo dye.

Figure\(\PageIndex {1}\): The reaction scheme for the conversion of the colorless nitite ion to a colored product by the Griess method.
Wavelength Selection
The best choice of wavelength for Beer's law analysis is one which is selective for the chosen analyte, has a large \({\epsilon}\) and where the absorption curve is relatively flat. As shown in Figure 9.4.1, a peak with a large \({\epsilon}\) will yield a better sensitivity than a peak with a smaller (\{\epsilon}\). Choosing a wavelength where the absorption curve is relatively flat will minimize polychromatic error and will minimize uncertainties form a failure to precisely set the instrument to the exact wavelength for each measurement.
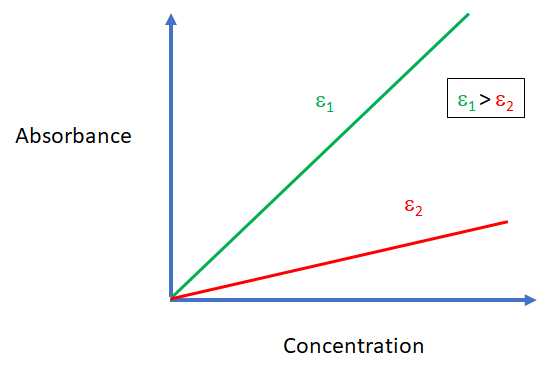
Figure\(\PageIndex {2}\): The cartoon above illustrates the better sensitivity for a Beer's law analysis when \({\epsilon_{2}}\) is larger than \({\epsilon_{1}}\)
Variables that Influence Absorbance
Common variables that influence the absorption spectrum of an analyte include pH, solvent, temperature, electrolyte concentration and the presence of interfering substances. The effect of these variables should be known and controlled if needed (i.e. buffered solutions). These effects are especially important for analytes that participate in association or dissociation reactions.
Cells
Accurate spectrophotometric analysies required good quality, matched cuvettes that are clean and transmit at the chosen wavelength. Care should be taken to avoid scratching and leaving fingerprints on the surfaces of the cuvettes. Prior to measurements, it is recommended that the outer surfaces of a cuvette be cleaned with lens paper wet with spectro-grade methanol.
Determination of the Relationship between Absorbance and Concentration
For any spectrophotometric analysis it is necessary to prepared a series of external standards that bracket the concentration range of the unknown sample and construct a calibration curve. It is unwise to use a single standard solution to determine the molar absorptivity and while literature values for the molar absorptivity are useful they should not be used to determine analytical results.
The composition of the external standards should approximate as best as possible the samples to be analyzed. Consideration should be given to the other species expected in the samples as well as the pH, ionic strength. Failure to do so leads to matrix matching errors.
If the non analyte components of the sample, the matrix, are not known but are expected to be a problem, the standard addition method is recommended (see section 5.3).
The Analysis of Mixtures
The total absorbance of a solution at a given wavelength is equal to the sum of the absorbances of the individual components present in the solution. Consider the cartoon spectra shown in Figure 9.4.3. for two absorbing species R and G. In Figure 9.4.3 the black curve is the sum of the red and green curves.
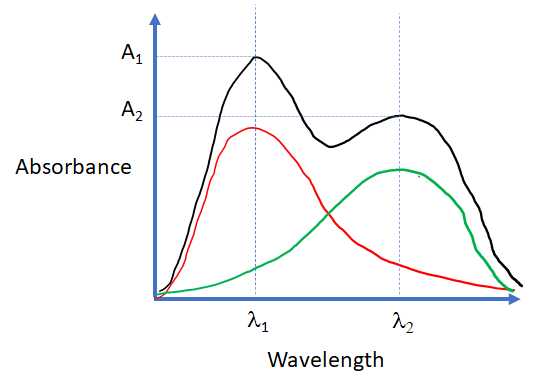
Figure\(\PageIndex {3}\): The illustration below shows the additivity of absorbances. In the cartoon, the black curve is the sum of the REd curve and hte Green curve.
The absorbance A1 is the sum of the absorbance of R and the absorbance of G at \({\lambda_{1}}\) and the absorbance A2 is is the sum of the absorbance of R and the absorbance of G at \({\lambda_{2}}\). This is described by the two equations shown below.
\(\begin{array}{l}
A_{1}=\epsilon_{R}^{1} b C_{R}+\epsilon_{G}^{1} b C_{G}\left(\text { at } \lambda_{1}\right) \\
A_{2}=\epsilon_{R}^{2} b C_{R}+\epsilon_{G}^{2} b C_{G}\left(\text { at } \lambda_{2}\right)
\end{array}\)
Beers law calibration curves standard solutions for R and G collected at \({\lambda_{2}}\) and \({\lambda_{2}}\) can be used to determine the four \({\epsilon}\)b terms. At this point the system of equations is minimally solvable for two unknowns, CR and CG.
Modern instruments employing the techniques of linear algebra will use absorbance values at many more wavelengths for both the standard solution and the mixture to over-determine the system and provided calculated uncertainties for the unknown concentrations