
2.1: The Concept of Equilibrium
- Page ID
- 292038
\( \newcommand{\vecs}[1]{\overset { \scriptstyle \rightharpoonup} {\mathbf{#1}} } \)
\( \newcommand{\vecd}[1]{\overset{-\!-\!\rightharpoonup}{\vphantom{a}\smash {#1}}} \)
\( \newcommand{\id}{\mathrm{id}}\) \( \newcommand{\Span}{\mathrm{span}}\)
( \newcommand{\kernel}{\mathrm{null}\,}\) \( \newcommand{\range}{\mathrm{range}\,}\)
\( \newcommand{\RealPart}{\mathrm{Re}}\) \( \newcommand{\ImaginaryPart}{\mathrm{Im}}\)
\( \newcommand{\Argument}{\mathrm{Arg}}\) \( \newcommand{\norm}[1]{\| #1 \|}\)
\( \newcommand{\inner}[2]{\langle #1, #2 \rangle}\)
\( \newcommand{\Span}{\mathrm{span}}\)
\( \newcommand{\id}{\mathrm{id}}\)
\( \newcommand{\Span}{\mathrm{span}}\)
\( \newcommand{\kernel}{\mathrm{null}\,}\)
\( \newcommand{\range}{\mathrm{range}\,}\)
\( \newcommand{\RealPart}{\mathrm{Re}}\)
\( \newcommand{\ImaginaryPart}{\mathrm{Im}}\)
\( \newcommand{\Argument}{\mathrm{Arg}}\)
\( \newcommand{\norm}[1]{\| #1 \|}\)
\( \newcommand{\inner}[2]{\langle #1, #2 \rangle}\)
\( \newcommand{\Span}{\mathrm{span}}\) \( \newcommand{\AA}{\unicode[.8,0]{x212B}}\)
\( \newcommand{\vectorA}[1]{\vec{#1}} % arrow\)
\( \newcommand{\vectorAt}[1]{\vec{\text{#1}}} % arrow\)
\( \newcommand{\vectorB}[1]{\overset { \scriptstyle \rightharpoonup} {\mathbf{#1}} } \)
\( \newcommand{\vectorC}[1]{\textbf{#1}} \)
\( \newcommand{\vectorD}[1]{\overrightarrow{#1}} \)
\( \newcommand{\vectorDt}[1]{\overrightarrow{\text{#1}}} \)
\( \newcommand{\vectE}[1]{\overset{-\!-\!\rightharpoonup}{\vphantom{a}\smash{\mathbf {#1}}}} \)
\( \newcommand{\vecs}[1]{\overset { \scriptstyle \rightharpoonup} {\mathbf{#1}} } \)
\( \newcommand{\vecd}[1]{\overset{-\!-\!\rightharpoonup}{\vphantom{a}\smash {#1}}} \)
\(\newcommand{\avec}{\mathbf a}\) \(\newcommand{\bvec}{\mathbf b}\) \(\newcommand{\cvec}{\mathbf c}\) \(\newcommand{\dvec}{\mathbf d}\) \(\newcommand{\dtil}{\widetilde{\mathbf d}}\) \(\newcommand{\evec}{\mathbf e}\) \(\newcommand{\fvec}{\mathbf f}\) \(\newcommand{\nvec}{\mathbf n}\) \(\newcommand{\pvec}{\mathbf p}\) \(\newcommand{\qvec}{\mathbf q}\) \(\newcommand{\svec}{\mathbf s}\) \(\newcommand{\tvec}{\mathbf t}\) \(\newcommand{\uvec}{\mathbf u}\) \(\newcommand{\vvec}{\mathbf v}\) \(\newcommand{\wvec}{\mathbf w}\) \(\newcommand{\xvec}{\mathbf x}\) \(\newcommand{\yvec}{\mathbf y}\) \(\newcommand{\zvec}{\mathbf z}\) \(\newcommand{\rvec}{\mathbf r}\) \(\newcommand{\mvec}{\mathbf m}\) \(\newcommand{\zerovec}{\mathbf 0}\) \(\newcommand{\onevec}{\mathbf 1}\) \(\newcommand{\real}{\mathbb R}\) \(\newcommand{\twovec}[2]{\left[\begin{array}{r}#1 \\ #2 \end{array}\right]}\) \(\newcommand{\ctwovec}[2]{\left[\begin{array}{c}#1 \\ #2 \end{array}\right]}\) \(\newcommand{\threevec}[3]{\left[\begin{array}{r}#1 \\ #2 \\ #3 \end{array}\right]}\) \(\newcommand{\cthreevec}[3]{\left[\begin{array}{c}#1 \\ #2 \\ #3 \end{array}\right]}\) \(\newcommand{\fourvec}[4]{\left[\begin{array}{r}#1 \\ #2 \\ #3 \\ #4 \end{array}\right]}\) \(\newcommand{\cfourvec}[4]{\left[\begin{array}{c}#1 \\ #2 \\ #3 \\ #4 \end{array}\right]}\) \(\newcommand{\fivevec}[5]{\left[\begin{array}{r}#1 \\ #2 \\ #3 \\ #4 \\ #5 \\ \end{array}\right]}\) \(\newcommand{\cfivevec}[5]{\left[\begin{array}{c}#1 \\ #2 \\ #3 \\ #4 \\ #5 \\ \end{array}\right]}\) \(\newcommand{\mattwo}[4]{\left[\begin{array}{rr}#1 \amp #2 \\ #3 \amp #4 \\ \end{array}\right]}\) \(\newcommand{\laspan}[1]{\text{Span}\{#1\}}\) \(\newcommand{\bcal}{\cal B}\) \(\newcommand{\ccal}{\cal C}\) \(\newcommand{\scal}{\cal S}\) \(\newcommand{\wcal}{\cal W}\) \(\newcommand{\ecal}{\cal E}\) \(\newcommand{\coords}[2]{\left\{#1\right\}_{#2}}\) \(\newcommand{\gray}[1]{\color{gray}{#1}}\) \(\newcommand{\lgray}[1]{\color{lightgray}{#1}}\) \(\newcommand{\rank}{\operatorname{rank}}\) \(\newcommand{\row}{\text{Row}}\) \(\newcommand{\col}{\text{Col}}\) \(\renewcommand{\row}{\text{Row}}\) \(\newcommand{\nul}{\text{Nul}}\) \(\newcommand{\var}{\text{Var}}\) \(\newcommand{\corr}{\text{corr}}\) \(\newcommand{\len}[1]{\left|#1\right|}\) \(\newcommand{\bbar}{\overline{\bvec}}\) \(\newcommand{\bhat}{\widehat{\bvec}}\) \(\newcommand{\bperp}{\bvec^\perp}\) \(\newcommand{\xhat}{\widehat{\xvec}}\) \(\newcommand{\vhat}{\widehat{\vvec}}\) \(\newcommand{\uhat}{\widehat{\uvec}}\) \(\newcommand{\what}{\widehat{\wvec}}\) \(\newcommand{\Sighat}{\widehat{\Sigma}}\) \(\newcommand{\lt}{<}\) \(\newcommand{\gt}{>}\) \(\newcommand{\amp}{&}\) \(\definecolor{fillinmathshade}{gray}{0.9}\)- To understand what is meant by chemical equilibrium.
In the last chapter, we discussed the principles of chemical kinetics, which deal with the rate of change, or how quickly a given chemical reaction occurs. We now turn our attention to the extent to which a reaction occurs and how reaction conditions affect the final concentrations of reactants and products. For most of the reactions that we have discussed so far, you may have assumed that once reactants are converted to products, they are likely to remain that way. In fact, however, virtually all chemical reactions are reversible to some extent. That is, an opposing reaction occurs in which the products react, to a greater or lesser degree, to re-form the reactants. Eventually, the forward and reverse reaction rates become the same, and the system reaches chemical equilibrium, the point at which the composition of the system no longer changes with time.
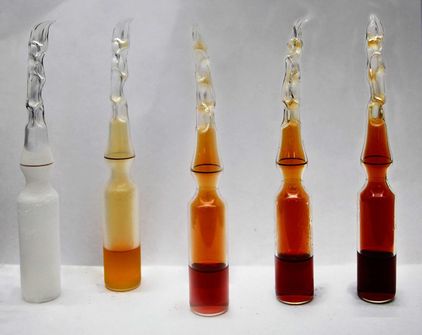
Chemical equilibrium is a dynamic process that consists of a forward reaction, in which reactants are converted to products, and a reverse reaction, in which products are converted to reactants. At equilibrium, the forward and reverse reactions proceed at equal rates. Consider, for example, a simple system that contains only one reactant and one product, the reversible dissociation of dinitrogen tetroxide (\(\ce{N_2O_4}\)) to nitrogen dioxide (\(\ce{NO_2}\)). You may recall that \(\ce{NO_2}\) is responsible for the brown color we associate with smog. When a sealed tube containing solid \(\ce{N_2O_4}\) (mp = −9.3°C; bp = 21.2°C) is heated from −78.4°C to 25°C, the red-brown color of \(\ce{NO_2}\) appears (Figure \(\PageIndex{1}\)). The reaction can be followed visually because the product (\(\ce{NO_2}\)) is colored, whereas the reactant (\(\ce{N_2O_4}\)) is colorless:
\[\underset{colorless }{\ce{N2O4 (g)}} \ce{ <=>[k_f][k_r] } \underset{red-brown }{\ce{2NO2(g)}}\label{Eq1} \]
The double arrow indicates that both the forward reaction
\[\ce{N2O4 (g) ->[k_f] 2NO2(g)} \label{eq1B} \]
and reverse reaction
\[\ce{2NO2(g) ->[k_r] N2O4 (g) } \label{eq1C} \]
occurring simultaneously (i.e, the reaction is reversible). However, this does not necessarily mean the system is equilibrium as the following chapter demonstrates.
Figure \(\PageIndex{2}\) shows how the composition of this system would vary as a function of time at a constant temperature. If the initial concentration of \(\ce{NO_2}\) were zero, then it increases as the concentration of \(\ce{N_2O_4}\) decreases. Eventually the composition of the system stops changing with time, and chemical equilibrium is achieved. Conversely, if we start with a sample that contains no \(\ce{N_2O_4}\) but an initial \(\ce{NO_2}\) concentration twice the initial concentration of \(\ce{N_2O_4}\) (Figure \(\PageIndex{2a}\)), in accordance with the stoichiometry of the reaction, we reach exactly the same equilibrium composition (Figure \(\PageIndex{2b}\)). Thus equilibrium can be approached from either direction in a chemical reaction.
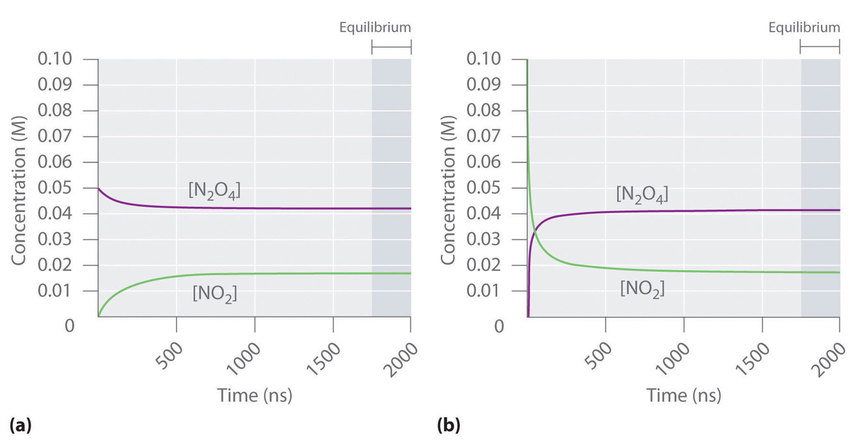
Figure \(\PageIndex{3}\) shows the forward and reverse reaction rates for a sample that initially contains pure \(\ce{NO_2}\). Because the initial concentration of \(\ce{N_2O_4}\) is zero, the forward reaction rate (dissociation of \(\ce{N_2O_4}\)) is initially zero as well. In contrast, the reverse reaction rate (dimerization of \(\ce{NO_2}\)) is initially very high (\(2.0 \times 10^6\, M/s\)), but it decreases rapidly as the concentration of \(\ce{NO_2}\) decreases. As the concentration of \(\ce{N_2O_4}\) increases, the rate of dissociation of \(\ce{N_2O_4}\) increases—but more slowly than the dimerization of \(\ce{NO_2}\)—because the reaction is only first order in \(\ce{N_2O_4}\) (rate = \(k_f[N_2O_4]\), where \(k_f\) is the rate constant for the forward reaction in Equations \(\ref{Eq1}\) and \(\ref{eq1B}\)). Eventually, the forward and reverse reaction rates become identical, \(k_f = k_r\), and the system has reached chemical equilibrium. If the forward and reverse reactions occur at different rates, then the system is not at equilibrium.
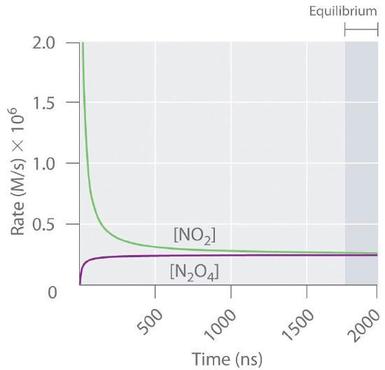
The rate of dimerization of \(\ce{NO_2}\) (reverse reaction) decreases rapidly with time, as expected for a second-order reaction. Because the initial concentration of \(\ce{N_2O_4}\) is zero, the rate of the dissociation reaction (forward reaction) at \(t = 0\) is also zero. As the dimerization reaction proceeds, the \(\ce{N_2O_4}\) concentration increases, and its rate of dissociation also increases. Eventually the rates of the two reactions are equal: chemical equilibrium has been reached, and the concentrations of \(\ce{N_2O_4}\) and \(\ce{NO_2}\) no longer change.
At equilibrium, the forward reaction rate is equal to the reverse reaction rate.
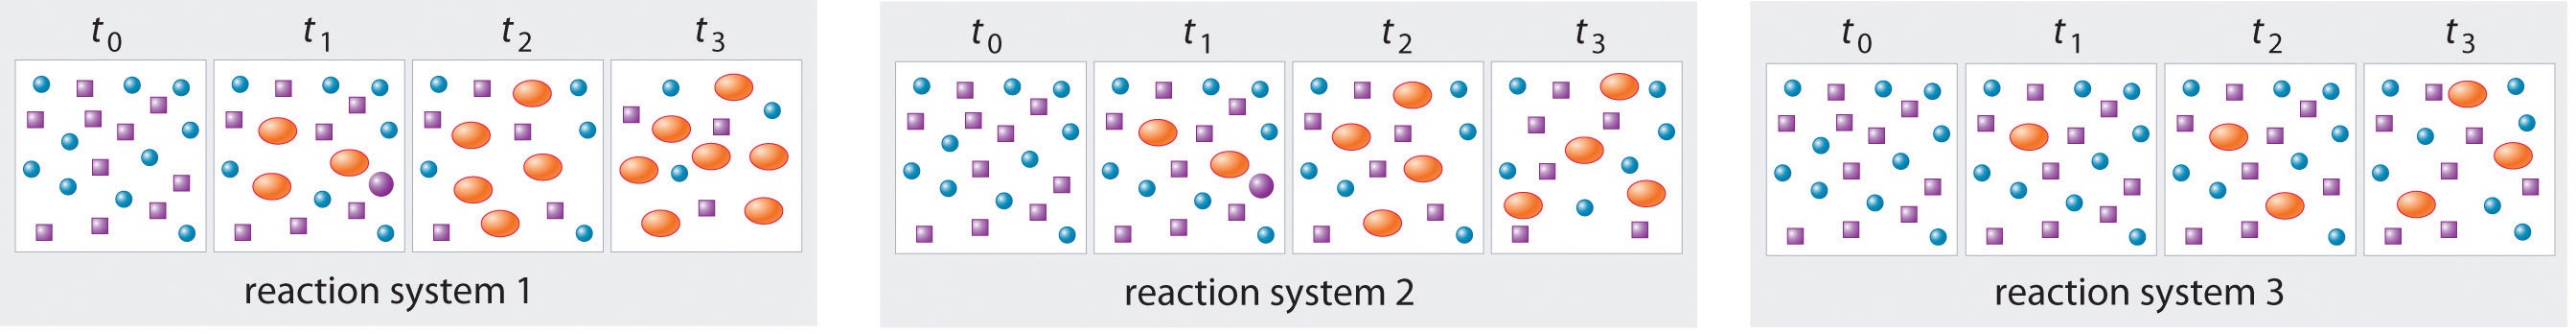
The three reaction systems (1, 2, and 3) depicted in the accompanying illustration can all be described by the equation:
\[2A \rightleftharpoons B \nonumber \]
where the blue circles are \(A\) and the purple ovals are \(B\). Each set of panels shows the changing composition of one of the three reaction mixtures as a function of time. Which system took the longest to reach chemical equilibrium?

Given: three reaction systems
Asked for: relative time to reach chemical equilibrium
Strategy:
Compare the concentrations of A and B at different times. The system whose composition takes the longest to stabilize took the longest to reach chemical equilibrium.
Solution:
In systems 1 and 3, the concentration of A decreases from \(t_0\) through \(t_2\) but is the same at both \(t_2\) and \(t_3\). Thus systems 1 and 3 are at equilibrium by \(t_3\). In system 2, the concentrations of A and B are still changing between \(t_2\) and \(t_3\), so system 2 may not yet have reached equilibrium by \(t_3\). Thus system 2 took the longest to reach chemical equilibrium.
In the following illustration, A is represented by blue circles, B by purple squares, and C by orange ovals; the equation for the reaction is A + B ⇌ C. The sets of panels represent the compositions of three reaction mixtures as a function of time. Which, if any, of the systems shown has reached equilibrium?
- Answer
-
system 2
A Video Introduction to Dynamic Equilibrium: https://youtu.be/4AJbFuzW2cs
Summary
At equilibrium, the forward and reverse reactions of a system proceed at equal rates. Chemical equilibrium is a dynamic process consisting of forward and reverse reactions that proceed at equal rates. At equilibrium, the composition of the system no longer changes with time. The composition of an equilibrium mixture is independent of the direction from which equilibrium is approached.