
1.2: The Meaning of Measure
- Page ID
- 152839

\( \newcommand{\vecs}[1]{\overset { \scriptstyle \rightharpoonup} {\mathbf{#1}} } \)
\( \newcommand{\vecd}[1]{\overset{-\!-\!\rightharpoonup}{\vphantom{a}\smash {#1}}} \)
\( \newcommand{\id}{\mathrm{id}}\) \( \newcommand{\Span}{\mathrm{span}}\)
( \newcommand{\kernel}{\mathrm{null}\,}\) \( \newcommand{\range}{\mathrm{range}\,}\)
\( \newcommand{\RealPart}{\mathrm{Re}}\) \( \newcommand{\ImaginaryPart}{\mathrm{Im}}\)
\( \newcommand{\Argument}{\mathrm{Arg}}\) \( \newcommand{\norm}[1]{\| #1 \|}\)
\( \newcommand{\inner}[2]{\langle #1, #2 \rangle}\)
\( \newcommand{\Span}{\mathrm{span}}\)
\( \newcommand{\id}{\mathrm{id}}\)
\( \newcommand{\Span}{\mathrm{span}}\)
\( \newcommand{\kernel}{\mathrm{null}\,}\)
\( \newcommand{\range}{\mathrm{range}\,}\)
\( \newcommand{\RealPart}{\mathrm{Re}}\)
\( \newcommand{\ImaginaryPart}{\mathrm{Im}}\)
\( \newcommand{\Argument}{\mathrm{Arg}}\)
\( \newcommand{\norm}[1]{\| #1 \|}\)
\( \newcommand{\inner}[2]{\langle #1, #2 \rangle}\)
\( \newcommand{\Span}{\mathrm{span}}\) \( \newcommand{\AA}{\unicode[.8,0]{x212B}}\)
\( \newcommand{\vectorA}[1]{\vec{#1}} % arrow\)
\( \newcommand{\vectorAt}[1]{\vec{\text{#1}}} % arrow\)
\( \newcommand{\vectorB}[1]{\overset { \scriptstyle \rightharpoonup} {\mathbf{#1}} } \)
\( \newcommand{\vectorC}[1]{\textbf{#1}} \)
\( \newcommand{\vectorD}[1]{\overrightarrow{#1}} \)
\( \newcommand{\vectorDt}[1]{\overrightarrow{\text{#1}}} \)
\( \newcommand{\vectE}[1]{\overset{-\!-\!\rightharpoonup}{\vphantom{a}\smash{\mathbf {#1}}}} \)
\( \newcommand{\vecs}[1]{\overset { \scriptstyle \rightharpoonup} {\mathbf{#1}} } \)
\( \newcommand{\vecd}[1]{\overset{-\!-\!\rightharpoonup}{\vphantom{a}\smash {#1}}} \)
\(\newcommand{\avec}{\mathbf a}\) \(\newcommand{\bvec}{\mathbf b}\) \(\newcommand{\cvec}{\mathbf c}\) \(\newcommand{\dvec}{\mathbf d}\) \(\newcommand{\dtil}{\widetilde{\mathbf d}}\) \(\newcommand{\evec}{\mathbf e}\) \(\newcommand{\fvec}{\mathbf f}\) \(\newcommand{\nvec}{\mathbf n}\) \(\newcommand{\pvec}{\mathbf p}\) \(\newcommand{\qvec}{\mathbf q}\) \(\newcommand{\svec}{\mathbf s}\) \(\newcommand{\tvec}{\mathbf t}\) \(\newcommand{\uvec}{\mathbf u}\) \(\newcommand{\vvec}{\mathbf v}\) \(\newcommand{\wvec}{\mathbf w}\) \(\newcommand{\xvec}{\mathbf x}\) \(\newcommand{\yvec}{\mathbf y}\) \(\newcommand{\zvec}{\mathbf z}\) \(\newcommand{\rvec}{\mathbf r}\) \(\newcommand{\mvec}{\mathbf m}\) \(\newcommand{\zerovec}{\mathbf 0}\) \(\newcommand{\onevec}{\mathbf 1}\) \(\newcommand{\real}{\mathbb R}\) \(\newcommand{\twovec}[2]{\left[\begin{array}{r}#1 \\ #2 \end{array}\right]}\) \(\newcommand{\ctwovec}[2]{\left[\begin{array}{c}#1 \\ #2 \end{array}\right]}\) \(\newcommand{\threevec}[3]{\left[\begin{array}{r}#1 \\ #2 \\ #3 \end{array}\right]}\) \(\newcommand{\cthreevec}[3]{\left[\begin{array}{c}#1 \\ #2 \\ #3 \end{array}\right]}\) \(\newcommand{\fourvec}[4]{\left[\begin{array}{r}#1 \\ #2 \\ #3 \\ #4 \end{array}\right]}\) \(\newcommand{\cfourvec}[4]{\left[\begin{array}{c}#1 \\ #2 \\ #3 \\ #4 \end{array}\right]}\) \(\newcommand{\fivevec}[5]{\left[\begin{array}{r}#1 \\ #2 \\ #3 \\ #4 \\ #5 \\ \end{array}\right]}\) \(\newcommand{\cfivevec}[5]{\left[\begin{array}{c}#1 \\ #2 \\ #3 \\ #4 \\ #5 \\ \end{array}\right]}\) \(\newcommand{\mattwo}[4]{\left[\begin{array}{rr}#1 \amp #2 \\ #3 \amp #4 \\ \end{array}\right]}\) \(\newcommand{\laspan}[1]{\text{Span}\{#1\}}\) \(\newcommand{\bcal}{\cal B}\) \(\newcommand{\ccal}{\cal C}\) \(\newcommand{\scal}{\cal S}\) \(\newcommand{\wcal}{\cal W}\) \(\newcommand{\ecal}{\cal E}\) \(\newcommand{\coords}[2]{\left\{#1\right\}_{#2}}\) \(\newcommand{\gray}[1]{\color{gray}{#1}}\) \(\newcommand{\lgray}[1]{\color{lightgray}{#1}}\) \(\newcommand{\rank}{\operatorname{rank}}\) \(\newcommand{\row}{\text{Row}}\) \(\newcommand{\col}{\text{Col}}\) \(\renewcommand{\row}{\text{Row}}\) \(\newcommand{\nul}{\text{Nul}}\) \(\newcommand{\var}{\text{Var}}\) \(\newcommand{\corr}{\text{corr}}\) \(\newcommand{\len}[1]{\left|#1\right|}\) \(\newcommand{\bbar}{\overline{\bvec}}\) \(\newcommand{\bhat}{\widehat{\bvec}}\) \(\newcommand{\bperp}{\bvec^\perp}\) \(\newcommand{\xhat}{\widehat{\xvec}}\) \(\newcommand{\vhat}{\widehat{\vvec}}\) \(\newcommand{\uhat}{\widehat{\uvec}}\) \(\newcommand{\what}{\widehat{\wvec}}\) \(\newcommand{\Sighat}{\widehat{\Sigma}}\) \(\newcommand{\lt}{<}\) \(\newcommand{\gt}{>}\) \(\newcommand{\amp}{&}\) \(\definecolor{fillinmathshade}{gray}{0.9}\)Skills to Develop
- Give an example of a measured numerical value, and explain what distinguishes it from a "pure" number.
- Give examples of random and systematic errors in measurements.
- Find the mean value of a series of similar measurements.
- State the principal factors that affect the difference between the mean value of a series of measurements, and the "true value" of the quantity being measured.
- Calculate the absolute and relative precisions of a given measurement, and explain why the latter is generally more useful.
- Distinguish between the accuracy and the precision of a measured value, and on the roles of random and systematic error.
In science, there are numbers and there are "numbers". What we ordinarily think of as a "number" and will refer to here as a pure number is just that: an expression of a precise value. The first of these you ever learned were the counting numbers, or integers; later on, you were introduced to the decimal numbers, and the rational numbers, which include numbers such as 1/3 and π (pi) that cannot be expressed as exact decimal values. The other kind of numeric quantity that we encounter in the natural sciences is a measured value of something– the length or weight of an object, the volume of a fluid, or perhaps the reading on an instrument. Although we express these values numerically, it would be a mistake to regard them as the kind of pure numbers described above.
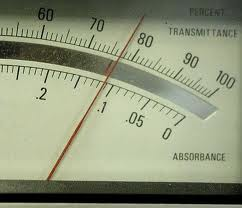
Confusing? Suppose our instrument has an indicator such as you see here. The pointer moves up and down so as to display the measured value on this scale. What number would you write in your notebook when recording this measurement? Clearly, the value is somewhere between 130 and 140 on the scale, but the graduations enable us to be more exact and place the value between 134 and 135. The indicator points more closely to the latter value, and we can go one more step by estimating the value as perhaps 134.8, so this is the value you would report for this measurement.
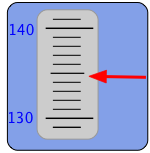
Now here’s the important thing to understand: although “134.8” is itself a number, the quantity we are measuring is almost certainly not 134.8 — at least, not exactly. The reason is obvious if you note that the instrument scale is such that we are barely able to distinguish between 134.7, 134.8, and 134.9. In reporting the value 134.8 we are effectively saying that the value is probably somewhere with the range 134.75 to 134.85. In other words, there is an uncertainty of ±0.05 unit in our measurement.
All measurements of quantities that can assume a continuous range of values (lengths, masses, volumes, etc.) consist of two parts: the reported value itself (never an exactly known number), and the uncertainty associated with the measurement. By “error”, we do not mean just outright mistakes, such as incorrect use of an instrument or failure to read a scale properly; although such gross errors do sometimes happen, they usually yield results that are sufficiently unexpected to call attention to themselves.
Scale-reading error
When you measure a volume or weight, you observe a reading on a scale of some kind, such as the one illustrated above. Scales, by their very nature, are limited to fixed increments of value, indicated by the division marks. The actual quantities we are measuring, in contrast, can vary continuously, so there is an inherent limitation in how finely we can discriminate between two values that fall between the marked divisions of the measuring scale. Scale-reading error is often classified as random error (see below), but it occurs so commonly that we treat it separately here.
The same problem remains if we substitute an instrument with a digital display; there will always be a point at which some value that lies between the two smallest divisions must arbitrarily toggle between two numbers on the readout display. This introduces an element of randomness into the value we observe, even if the "true" value remains unchanged. The more sensitive the measuring instrument, the less likely it is that two successive measurements of the same sample will yield identical results. In the example we discussed above, distinguishing between the values 134.8 and 134.9 may be too difficult to do in a consistent way, so two independent observers may record different values even when viewing the same reading.
Parallax error
One form of scale-reading error that often afflicts beginners in the science laboratory is failure to properly align the eye with the part of the scale you are reading. This gives rise to parallax error. Parallax refers to the change in the apparent position of an object when viewed from different points.
The most notorious example encountered in the introductory chemistry laboratory is failure to read the volume of a liquid properly in a graduated cylinder or burette. Getting all of their students trained to make sure their eye is level with the bottom of the meniscus is the lab instructors' hope and despair.
Proper use of a measuring device can help reduce the possibility of parallax error. For example, a length scale should be in direct contact with the object (left), not above it as on the right.
Analog meters (those having pointer needles) are most accurate when read at about 2/3 of the length of the scale. Analog-type meters, unlike those having digital readouts, are also subject to parallax error. Those intended for high-accuracy applications often have a mirrored arc along the scale in which a reflection of the pointer needle can be seen if the viewer is not properly aligned with the instrument.
- Random (indeterminate) error: Each measurement is also influenced by a myriad of minor events, such as building vibrations, electrical fluctuations, motions of the air, and friction in any moving parts of the instrument. These tiny influences constitute a kind of "noise" that also has a random character. Whether we are conscious of it or not, all measured values contain an element of random error.
- Systematic error: Suppose that you weigh yourself on a bathroom scale, not noticing that the dial reads “1.5 kg” even before you have placed your weight on it. Similarly, you might use an old ruler with a worn-down end to measure the length of a piece of wood. In both of these examples, all subsequent measurements, either of the same object or of different ones, will be off by a constant amount. Unlike random error, which is impossible to eliminate, these systematic error (also known as determinate error) is usually quite easy to avoid or compensate for, but only by a conscious effort in the conduct of the observation, usually by proper zeroing and calibration of the measuring instrument. However, once systematic error has found its way into the data, it is can be very hard to detect.


Accuracy and precision
We tend to use these two terms interchangeably in our ordinary conversation, but in the context of scientific measurement, they have very different meanings:
- Accuracy refers to how closely the measured value of a quantity corresponds to its “true” value.
- Precision expresses the degree of reproducibility, or agreement between repeated measurements.
Accuracy, of course, is the goal we strive for in scientific measurements. Unfortunately, however, there is no obvious way of knowing how closely we have achieved it; the “true” value, whether it be of a well-defined quantity such as the mass of a particular object, or an average that pertains to a collection of objects, can never be known — and thus we can never recognize it if we are fortunate enough to find it.
Four Scenarios
A target on a dart board serves as a convenient analogy. The results of four sets of measurements (or four dart games) are illustrated below. Each set is made up of ten observations (or throws of darts.) Each red dot corresponds to the point at which a dart has hit the target — or alternatively, to the value of an individual observation. For measurements, assume the true value of the quantity being measured lies at the center of each target. Now consider the following four sets of results:
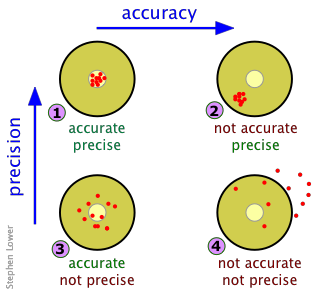
 Right on! You win the dart game, and get an A grade on your measurement results.
 Your results are beautifully replicable, but your measuring device may not have been calibrated properly or your observations suffer from a systematic error of some kind. Accuracy: F, Precision, A; overall grade C.
 Extremely unlikely, and probably due to pure luck; the only reason for the accurate mean is that your misses mostly canceled out. Grade D.
Pretty sad; consider switching to music or politics — or have your eyes examined.
Note
When we make real measurements, there is no dart board or target that enables one to immediately judge the quality of the result. If we make only a few observations, we may be unable distinguish between any of these scenarios.
The "true value" of a desired measurement can be quite elusive, and may not even be definable at all. This is a very common difficulty in both the social sciences (as in opinion surveys), in medicine (evaluating the efficacy of a drug or other treatment), and in all other natural sciences. The proper treatment of such problems is to make multiple observations of individual instances of what is being measured, and then use statistical methods to evaluate the results. In this introductory unit on measurement, we will defer discussion of concepts such as standard deviation and confidence intervals which become essential in courses at the second-year level and beyond. We will restrict our treatment here to the elementary considerations that are likely to be needed in a typical first-year course.
How many measurements do I need?
One measurement may be enough. If you wish to measure your height to the nearest centimeter or inch, or the volume of a liquid cooking ingredient to the nearest 1/8 “cup”, you don't ordinarily worry about random error. The error will still be present, but its magnitude will be such a small fraction of the value that it will not significantly affect whatever we are trying to achieve. Thus random error is not something we are concerned about in our daily lives. In the scientific laboratory, there are many contexts in which a single observation of a volume, mass, or instrument reading makes perfect sense; part of the "art" of science lies in making an informed judgment of how exact a given measurement must be. If we are measuring a directly observable quantity such as the weight of a solid or volume of a liquid, then a single measurement, carefully done and reported to a precision that is consistent with that of the measuring instrument, will usually be sufficient.
However more measurements are needed when there is no clearly-defined "true" value. A collection of objects (or of people) is known in statistics as a population. There is often a need to determine some quantity that describes a collection of objects. For example, a pharmaceutical researcher will need to determine the time required for half of a standard dose of a certain drug to be eliminated by the body, or a manufacturer of light bulbs might want to know how many hours a certain type of light bulb will operate before it burns out. In these cases a value for any individual sample can be determined easily enough, but since no two samples (patients or light bulbs) are identical, we are compelled to repeat the same measurement on multiple objects. And naturally, we get a variety of results, usually referred to as scatter. Even for a single object, there may be no clearly defined "true" value.
Suppose that you wish to determine the diameter of a certain type of coin. You make one measurement and record the results. If you then make a similar measurement along a different cross-section of the coin, you will likely get a different result. The same thing will happen if you make successive measurements on other coins of the same kind.
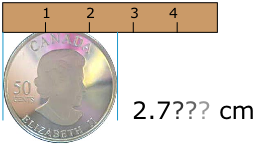
Here we are faced with two kinds of problems. First, there is the inherent limitation of the measuring device: we can never reliably measure more finely than the marked divisions on the ruler. Secondly, we cannot assume that the coin is perfectly circular; careful inspection will likely reveal some distortion resulting from a slight imperfection in the manufacturing process. In these cases, it turns out that there is no single, true value of the quantity we are trying to measure.
Mean, median, and range of a series of observations
There are a variety of ways to express the average, or central tendency of a series of measurements, with mean (more precisely, arithmetic mean) being most commonly employed. Our ordinary use of the term "average" also refers to the mean. These concepts are usually all you need as a first step in the analysis of data you are likely to collect in a first-year chemistry laboratory course.
The mean and its meaning
In our ordinary speech, the term "average" is synonymous with "mean". In statistics, however, "average" is a more general term that can refer to median, mode, and range, as well as to mean. When we obtain more than one result for a given measurement (either made repeatedly on a single sample, or more commonly, on different samples of the same material), the simplest procedure is to report the mean, or average value. The mean is defined mathematically as the sum of the values, divided by the number of measurements:
\[ x_m = \dfrac{\sum_{i=1}^n x_i}{n}\]
If you are not familiar with this notation, don’t let it scare you! It's no different from the average that you are likely already familiar with. Take a moment to see how it expresses the previous sentence; if there are \(n\) measurements, each yielding a value xi , then we sum over all \(i\) and divide by \(n\) to get the mean value \(x_m\). For example, if there are only two measurements, x1 and x1, then the mean is
\[ x_m = \dfrac{x_1 + x_2}{2}\]
The general problem of determining the uncertainty of a calculated result turns out to be rather more complicated than you might think, and will not be treated here. There are, however, some very simple rules that are sufficient for most practical purposes.
Absolute and Relative Uncertainty
If you weigh out 74.1 mg of a solid sample on a laboratory balance that is accurate to within 0.1 milligram, then the actual weight of the sample is likely to fall somewhere in the range of 74.0 to 74.2 mg; the absolute uncertainty in the weight you observe is 0.2 mg, or ±0.1 mg. If you use the same balance to weigh out 3.2914 g of another sample, the actual weight is between 3.2913 g and 3.2915 g, and the absolute uncertainty is still ±0.1 mg.
Although the absolute uncertainties in these two examples are identical, we would probably consider the second measurement to be more precise because the uncertainty is a smaller fraction of the measured value. The relative uncertainties of the two results would be
0.2 ÷ 74.1 = 0.0027 (about 3 parts in 1000 (PPT), or 0.3%)
0.0002 ÷ 3.2913 = 0.000084 (about 0.8 PPT , or 0.008 %)
Relative uncertainties are widely used to express the reliability of measurements, even those for a single observation, in which case the uncertainty is that of the measuring device. Relative uncertainties can be expressed as parts per hundred (percent), per thousand (PPT), per million, (PPM), and so on.
Questions
- 1. Addition and subtraction, both numbers have uncertainties
- The simplest method is to just add the absolute uncertainties.
Example: (6.3 ± 0.05 cm) – (2.1 ± 0.05 cm) = 4.2 ± 0.10 cm
However, this tends to over-estimate the uncertainty by assuming the worst possible case in which the error in one of the quantities is at its maximum positive value, while that of the other quantity is at its maximum minimum value. -
Statistical theory informs us that a more realistic value for the uncertainty of a sum or difference is to add the squares of each absolute uncertainty, and then take the square root of this sum. Applying this to the above values, we have
-
[(.05)2 + (.05)2]½ = 0.07, so the result is 4.2 ± 0.07 cm.
- 2. Multiplication or division, both numbers have uncertainties.
- Convert the absolute uncertainties into relative uncertainties, and add these. Or better, add their squares and take the square root of the sum.
-
Problem Example 3
Estimate the absolute error in the density calculated by dividing (12.7 ± .05 g) by (10.0 ± 0.02 mL).
Solution: Relative uncertainty of the mass: 0.05 / 12.7 = 0.0039 = 0.39%
Relative uncertainty of the volume: 0.02 / 10.0 = 0.002 = 0.2%
Relative uncertainty of the density: [(.39)2 + (0.2)2]½ = 0.44 %
Mass ÷ volume: (12.7 g) ÷ (10.0 mL) = 1.27 g mL–1
Absolute uncertainty of the density: (± 0.044) x (1.27 g mL–1) = ±0.06 g mL–1 - 3. Multiplication or division by a pure number
- Trivial case; multiply or divide the uncertainty by the pure number.
Contributors
Stephen Lower, Professor Emeritus (Simon Fraser U.) Chem1 Virtual Textbook