
1.12: UV-Vis Absorption Spectroscopy
- Page ID
- 71921
\( \newcommand{\vecs}[1]{\overset { \scriptstyle \rightharpoonup} {\mathbf{#1}} } \)
\( \newcommand{\vecd}[1]{\overset{-\!-\!\rightharpoonup}{\vphantom{a}\smash {#1}}} \)
\( \newcommand{\dsum}{\displaystyle\sum\limits} \)
\( \newcommand{\dint}{\displaystyle\int\limits} \)
\( \newcommand{\dlim}{\displaystyle\lim\limits} \)
\( \newcommand{\id}{\mathrm{id}}\) \( \newcommand{\Span}{\mathrm{span}}\)
( \newcommand{\kernel}{\mathrm{null}\,}\) \( \newcommand{\range}{\mathrm{range}\,}\)
\( \newcommand{\RealPart}{\mathrm{Re}}\) \( \newcommand{\ImaginaryPart}{\mathrm{Im}}\)
\( \newcommand{\Argument}{\mathrm{Arg}}\) \( \newcommand{\norm}[1]{\| #1 \|}\)
\( \newcommand{\inner}[2]{\langle #1, #2 \rangle}\)
\( \newcommand{\Span}{\mathrm{span}}\)
\( \newcommand{\id}{\mathrm{id}}\)
\( \newcommand{\Span}{\mathrm{span}}\)
\( \newcommand{\kernel}{\mathrm{null}\,}\)
\( \newcommand{\range}{\mathrm{range}\,}\)
\( \newcommand{\RealPart}{\mathrm{Re}}\)
\( \newcommand{\ImaginaryPart}{\mathrm{Im}}\)
\( \newcommand{\Argument}{\mathrm{Arg}}\)
\( \newcommand{\norm}[1]{\| #1 \|}\)
\( \newcommand{\inner}[2]{\langle #1, #2 \rangle}\)
\( \newcommand{\Span}{\mathrm{span}}\) \( \newcommand{\AA}{\unicode[.8,0]{x212B}}\)
\( \newcommand{\vectorA}[1]{\vec{#1}} % arrow\)
\( \newcommand{\vectorAt}[1]{\vec{\text{#1}}} % arrow\)
\( \newcommand{\vectorB}[1]{\overset { \scriptstyle \rightharpoonup} {\mathbf{#1}} } \)
\( \newcommand{\vectorC}[1]{\textbf{#1}} \)
\( \newcommand{\vectorD}[1]{\overrightarrow{#1}} \)
\( \newcommand{\vectorDt}[1]{\overrightarrow{\text{#1}}} \)
\( \newcommand{\vectE}[1]{\overset{-\!-\!\rightharpoonup}{\vphantom{a}\smash{\mathbf {#1}}}} \)
\( \newcommand{\vecs}[1]{\overset { \scriptstyle \rightharpoonup} {\mathbf{#1}} } \)
\(\newcommand{\longvect}{\overrightarrow}\)
\( \newcommand{\vecd}[1]{\overset{-\!-\!\rightharpoonup}{\vphantom{a}\smash {#1}}} \)
\(\newcommand{\avec}{\mathbf a}\) \(\newcommand{\bvec}{\mathbf b}\) \(\newcommand{\cvec}{\mathbf c}\) \(\newcommand{\dvec}{\mathbf d}\) \(\newcommand{\dtil}{\widetilde{\mathbf d}}\) \(\newcommand{\evec}{\mathbf e}\) \(\newcommand{\fvec}{\mathbf f}\) \(\newcommand{\nvec}{\mathbf n}\) \(\newcommand{\pvec}{\mathbf p}\) \(\newcommand{\qvec}{\mathbf q}\) \(\newcommand{\svec}{\mathbf s}\) \(\newcommand{\tvec}{\mathbf t}\) \(\newcommand{\uvec}{\mathbf u}\) \(\newcommand{\vvec}{\mathbf v}\) \(\newcommand{\wvec}{\mathbf w}\) \(\newcommand{\xvec}{\mathbf x}\) \(\newcommand{\yvec}{\mathbf y}\) \(\newcommand{\zvec}{\mathbf z}\) \(\newcommand{\rvec}{\mathbf r}\) \(\newcommand{\mvec}{\mathbf m}\) \(\newcommand{\zerovec}{\mathbf 0}\) \(\newcommand{\onevec}{\mathbf 1}\) \(\newcommand{\real}{\mathbb R}\) \(\newcommand{\twovec}[2]{\left[\begin{array}{r}#1 \\ #2 \end{array}\right]}\) \(\newcommand{\ctwovec}[2]{\left[\begin{array}{c}#1 \\ #2 \end{array}\right]}\) \(\newcommand{\threevec}[3]{\left[\begin{array}{r}#1 \\ #2 \\ #3 \end{array}\right]}\) \(\newcommand{\cthreevec}[3]{\left[\begin{array}{c}#1 \\ #2 \\ #3 \end{array}\right]}\) \(\newcommand{\fourvec}[4]{\left[\begin{array}{r}#1 \\ #2 \\ #3 \\ #4 \end{array}\right]}\) \(\newcommand{\cfourvec}[4]{\left[\begin{array}{c}#1 \\ #2 \\ #3 \\ #4 \end{array}\right]}\) \(\newcommand{\fivevec}[5]{\left[\begin{array}{r}#1 \\ #2 \\ #3 \\ #4 \\ #5 \\ \end{array}\right]}\) \(\newcommand{\cfivevec}[5]{\left[\begin{array}{c}#1 \\ #2 \\ #3 \\ #4 \\ #5 \\ \end{array}\right]}\) \(\newcommand{\mattwo}[4]{\left[\begin{array}{rr}#1 \amp #2 \\ #3 \amp #4 \\ \end{array}\right]}\) \(\newcommand{\laspan}[1]{\text{Span}\{#1\}}\) \(\newcommand{\bcal}{\cal B}\) \(\newcommand{\ccal}{\cal C}\) \(\newcommand{\scal}{\cal S}\) \(\newcommand{\wcal}{\cal W}\) \(\newcommand{\ecal}{\cal E}\) \(\newcommand{\coords}[2]{\left\{#1\right\}_{#2}}\) \(\newcommand{\gray}[1]{\color{gray}{#1}}\) \(\newcommand{\lgray}[1]{\color{lightgray}{#1}}\) \(\newcommand{\rank}{\operatorname{rank}}\) \(\newcommand{\row}{\text{Row}}\) \(\newcommand{\col}{\text{Col}}\) \(\renewcommand{\row}{\text{Row}}\) \(\newcommand{\nul}{\text{Nul}}\) \(\newcommand{\var}{\text{Var}}\) \(\newcommand{\corr}{\text{corr}}\) \(\newcommand{\len}[1]{\left|#1\right|}\) \(\newcommand{\bbar}{\overline{\bvec}}\) \(\newcommand{\bhat}{\widehat{\bvec}}\) \(\newcommand{\bperp}{\bvec^\perp}\) \(\newcommand{\xhat}{\widehat{\xvec}}\) \(\newcommand{\vhat}{\widehat{\vvec}}\) \(\newcommand{\uhat}{\widehat{\uvec}}\) \(\newcommand{\what}{\widehat{\wvec}}\) \(\newcommand{\Sighat}{\widehat{\Sigma}}\) \(\newcommand{\lt}{<}\) \(\newcommand{\gt}{>}\) \(\newcommand{\amp}{&}\) \(\definecolor{fillinmathshade}{gray}{0.9}\)CHEM 174 Physical Chemistry Laboratory II
Visible Absorption Spectroscopy and Beer’s Law
Theory: Beers Law
Beer’s law describes how radiation interacts with matter. A completely transparent container contains some compound and there is an incident monochromatic radiation beam of intensity Io. The greater the concentration of the compound and the longer the path length, L, the lower the intensity of the emerging beam, I.
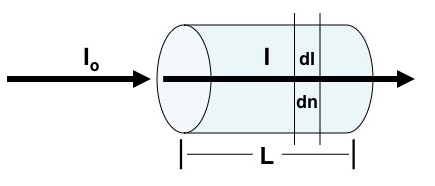
A more precise way of saying this is that “successive increments in the number of identical absorbing molecules in the path of a beam of monochromatic radiation absorb equal fractions of the radiant energy transversing them” (Ewing, 1969). Mathematically dI is the change of radiation intensity at intensity I caused by the absorbance of dn molecules with σ as a proportionally constant.
\[\frac{dI}{dn}=-\sigma I \nonumber \]
This equation can be rearranged and integrated between the limits of Io to I and 0 to N where N is the total number of molecules transversed.
\[\int_{I_{o}}^{I}\frac{dI}{I}=-\sigma \int_{0}^{N}dn \nonumber \] \[\ln \left ( I \right )-\ln \left (I_{o} \right )=-\sigma N \nonumber \] \[\ln \left ( \frac{I_{o}}{I} \right )=\sigma N \nonumber \]
The absorbance, A, is defined as:
\[A=\ln \left ( \frac{I_{o}}{I} \right ) \nonumber \]
The number N is more conveniently written as the product of the concentration [C] and the path length, L. Beer’s Law is then:
\[A=\left [ C \right ]\sigma L \nonumber \]
If [C] is expressed in molecules cm-3 and L in cm than σ is the absorption cross section per molecule cm2. Note: Divide a concentration in moles liter-1 by 1 × 103 to convert to moles cm-3.
Electronic Absorption and Dipole Strength
Molecules only absorb photons that lead to a change of state. Visible radiation typically corresponds to changes in electronic states. For example the figure below shows two different electronic states, ψm and ψn, rotational states represented by the horizontal lined and two possible transitions between the electronic states.
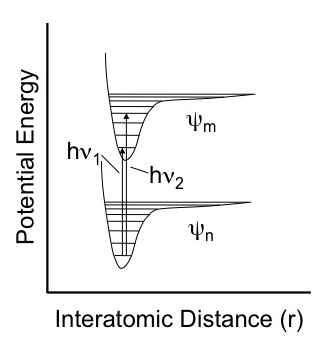
Figure 2. Absorption of visible or ultraviolet radiation between two stable electronic states.
In general the stronger absorbances are related to stronger dipole moments and a greater degree of overlap between the lower and upper states. The strength of the transition is proportional to the following integral where is the dipole moment operator.
\[f \propto \int_{z}^{ } \psi _{n}\widehat{d_{e}}\psi _{m} dz \nonumber \]
In this lab we will quantitatively determine the absorption cross sections for Congo Red. This compound is an acid base indicator that is blue-violet in acidic solutions and red at higher pH. “Its spectral properties can be approximated by the quantum mechanical particle in a box” (see the lab lecture). Congo Red is composed of four aromatic rings and two –N=N- groups. Its structure is given below.
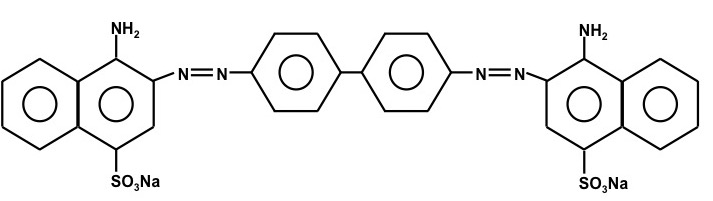
Figure 3. The chemical structure of Congo Red. The molecular weight of Congo Red is 696.67 g mole-1.
Procedure
- An aqueous stock solution (Red) of Congo Red solution has been prepared at pH 7 with a concentration of about 7.5 × 10⁻⁵ moles liter-1.
- Prepare series of dilute solutions by quantitatively diluting the Red stock solution to make 5 or 6 solutions. Use a 1 or 2 ml pipet to transfer different increments of the solution to small volumetric flasks and fill with distilled water.
- Fill a cuvette with distilled water and record a spectrum. This spectrum will be your first background spectrum (Io).
- Record a spectrum of the stock Congo Red solution.
- Wash the cuvette and fill it with distilled water and record a spectrum. This spectrum will be your second background spectrum (Io).
- Repeat steps 3 to 5 for each of the more dilute solutions.
- Finally after running all the solutions fill the cuvette with distilled water and record one more background spectrum.
- An acidified (Blue-Violet) aqueous stock solution of Congo Red solution has been prepared with a concentration of about 1.5 × 10⁻⁷ moles liter-1. A small amount of acetic acid with used to acidify the solution. Prepare series of dilute solutions by quantitatively diluting the Blue-Violet stock solution to make 5 or 6 solutions. Use a 1 or 2 ml pipet to transfer different increments of the solution to small volumetric flasks and fill with distilled water.
Calculations
Calculate absorbance spectra for the dye solutions by taking the natural log of the ratio between the background spectra and the Congo Red solutions.
\[A=\ln \left ( \frac{I_{o}}{I} \right ) \nonumber \]
For the background spectrum (Io) average the background taken before and after the Congo Red spectrum.
Correct the wavelength scale using the calibrations you developed during the calibration laboratory.
Plot the spectra. Make one set of plots for the Red Congo Red solution and another set of plots for the Blue-Violet Congo Red solution.
For both sets of solutions determine the numerical value of the extinction coefficient for the maximum absorption peak, \(λ_{max}\), by plotting the absorbance as a function of the concentration for both sets of solutions. Determine the slope of the best-fit line and the correlation coefficient for both plots. The slope is the product of the maximum extinction coefficient and the path length (1 cm). Divide the slope by 1 cm to get the maximum extinction coefficient and its unit will be liter mole-1 cm-1.
Convert the extinction coefficient (liter mole-1 cm-1) to the cross section of one molecule \(σ_{max}\). Multiply by the conversion factors 103 cm3/ 1 liter and 1 mole / 6.02 × 10²³ molecules. The units should now be in cm2 molecule-1.
Take the ratio of \(σ_{max}\) to the measured absorbance at \(λ_{max}\). Multiply the absorbances for each spectra by this ratio to determine the cross sections for all the wavelengths.
Average the spectra after you calculated the cross sections to get a single spectrum of cross sections. Calculate the average and the standard deviation of the cross sections as a function of the wavelengths for the Red and for the Blue-Violet Congo Red solutions.
Questions for Discussion Section in Your Report
- Why is it necessary to calibrate the wavelength scale but not the light intensity measurement for this experiment?
- Which form of Congo Red has the greatest σmax?