
Thermogravimetric analysis (TGA)
- Page ID
- 214241
\( \newcommand{\vecs}[1]{\overset { \scriptstyle \rightharpoonup} {\mathbf{#1}} } \)
\( \newcommand{\vecd}[1]{\overset{-\!-\!\rightharpoonup}{\vphantom{a}\smash {#1}}} \)
\( \newcommand{\dsum}{\displaystyle\sum\limits} \)
\( \newcommand{\dint}{\displaystyle\int\limits} \)
\( \newcommand{\dlim}{\displaystyle\lim\limits} \)
\( \newcommand{\id}{\mathrm{id}}\) \( \newcommand{\Span}{\mathrm{span}}\)
( \newcommand{\kernel}{\mathrm{null}\,}\) \( \newcommand{\range}{\mathrm{range}\,}\)
\( \newcommand{\RealPart}{\mathrm{Re}}\) \( \newcommand{\ImaginaryPart}{\mathrm{Im}}\)
\( \newcommand{\Argument}{\mathrm{Arg}}\) \( \newcommand{\norm}[1]{\| #1 \|}\)
\( \newcommand{\inner}[2]{\langle #1, #2 \rangle}\)
\( \newcommand{\Span}{\mathrm{span}}\)
\( \newcommand{\id}{\mathrm{id}}\)
\( \newcommand{\Span}{\mathrm{span}}\)
\( \newcommand{\kernel}{\mathrm{null}\,}\)
\( \newcommand{\range}{\mathrm{range}\,}\)
\( \newcommand{\RealPart}{\mathrm{Re}}\)
\( \newcommand{\ImaginaryPart}{\mathrm{Im}}\)
\( \newcommand{\Argument}{\mathrm{Arg}}\)
\( \newcommand{\norm}[1]{\| #1 \|}\)
\( \newcommand{\inner}[2]{\langle #1, #2 \rangle}\)
\( \newcommand{\Span}{\mathrm{span}}\) \( \newcommand{\AA}{\unicode[.8,0]{x212B}}\)
\( \newcommand{\vectorA}[1]{\vec{#1}} % arrow\)
\( \newcommand{\vectorAt}[1]{\vec{\text{#1}}} % arrow\)
\( \newcommand{\vectorB}[1]{\overset { \scriptstyle \rightharpoonup} {\mathbf{#1}} } \)
\( \newcommand{\vectorC}[1]{\textbf{#1}} \)
\( \newcommand{\vectorD}[1]{\overrightarrow{#1}} \)
\( \newcommand{\vectorDt}[1]{\overrightarrow{\text{#1}}} \)
\( \newcommand{\vectE}[1]{\overset{-\!-\!\rightharpoonup}{\vphantom{a}\smash{\mathbf {#1}}}} \)
\( \newcommand{\vecs}[1]{\overset { \scriptstyle \rightharpoonup} {\mathbf{#1}} } \)
\(\newcommand{\longvect}{\overrightarrow}\)
\( \newcommand{\vecd}[1]{\overset{-\!-\!\rightharpoonup}{\vphantom{a}\smash {#1}}} \)
\(\newcommand{\avec}{\mathbf a}\) \(\newcommand{\bvec}{\mathbf b}\) \(\newcommand{\cvec}{\mathbf c}\) \(\newcommand{\dvec}{\mathbf d}\) \(\newcommand{\dtil}{\widetilde{\mathbf d}}\) \(\newcommand{\evec}{\mathbf e}\) \(\newcommand{\fvec}{\mathbf f}\) \(\newcommand{\nvec}{\mathbf n}\) \(\newcommand{\pvec}{\mathbf p}\) \(\newcommand{\qvec}{\mathbf q}\) \(\newcommand{\svec}{\mathbf s}\) \(\newcommand{\tvec}{\mathbf t}\) \(\newcommand{\uvec}{\mathbf u}\) \(\newcommand{\vvec}{\mathbf v}\) \(\newcommand{\wvec}{\mathbf w}\) \(\newcommand{\xvec}{\mathbf x}\) \(\newcommand{\yvec}{\mathbf y}\) \(\newcommand{\zvec}{\mathbf z}\) \(\newcommand{\rvec}{\mathbf r}\) \(\newcommand{\mvec}{\mathbf m}\) \(\newcommand{\zerovec}{\mathbf 0}\) \(\newcommand{\onevec}{\mathbf 1}\) \(\newcommand{\real}{\mathbb R}\) \(\newcommand{\twovec}[2]{\left[\begin{array}{r}#1 \\ #2 \end{array}\right]}\) \(\newcommand{\ctwovec}[2]{\left[\begin{array}{c}#1 \\ #2 \end{array}\right]}\) \(\newcommand{\threevec}[3]{\left[\begin{array}{r}#1 \\ #2 \\ #3 \end{array}\right]}\) \(\newcommand{\cthreevec}[3]{\left[\begin{array}{c}#1 \\ #2 \\ #3 \end{array}\right]}\) \(\newcommand{\fourvec}[4]{\left[\begin{array}{r}#1 \\ #2 \\ #3 \\ #4 \end{array}\right]}\) \(\newcommand{\cfourvec}[4]{\left[\begin{array}{c}#1 \\ #2 \\ #3 \\ #4 \end{array}\right]}\) \(\newcommand{\fivevec}[5]{\left[\begin{array}{r}#1 \\ #2 \\ #3 \\ #4 \\ #5 \\ \end{array}\right]}\) \(\newcommand{\cfivevec}[5]{\left[\begin{array}{c}#1 \\ #2 \\ #3 \\ #4 \\ #5 \\ \end{array}\right]}\) \(\newcommand{\mattwo}[4]{\left[\begin{array}{rr}#1 \amp #2 \\ #3 \amp #4 \\ \end{array}\right]}\) \(\newcommand{\laspan}[1]{\text{Span}\{#1\}}\) \(\newcommand{\bcal}{\cal B}\) \(\newcommand{\ccal}{\cal C}\) \(\newcommand{\scal}{\cal S}\) \(\newcommand{\wcal}{\cal W}\) \(\newcommand{\ecal}{\cal E}\) \(\newcommand{\coords}[2]{\left\{#1\right\}_{#2}}\) \(\newcommand{\gray}[1]{\color{gray}{#1}}\) \(\newcommand{\lgray}[1]{\color{lightgray}{#1}}\) \(\newcommand{\rank}{\operatorname{rank}}\) \(\newcommand{\row}{\text{Row}}\) \(\newcommand{\col}{\text{Col}}\) \(\renewcommand{\row}{\text{Row}}\) \(\newcommand{\nul}{\text{Nul}}\) \(\newcommand{\var}{\text{Var}}\) \(\newcommand{\corr}{\text{corr}}\) \(\newcommand{\len}[1]{\left|#1\right|}\) \(\newcommand{\bbar}{\overline{\bvec}}\) \(\newcommand{\bhat}{\widehat{\bvec}}\) \(\newcommand{\bperp}{\bvec^\perp}\) \(\newcommand{\xhat}{\widehat{\xvec}}\) \(\newcommand{\vhat}{\widehat{\vvec}}\) \(\newcommand{\uhat}{\widehat{\uvec}}\) \(\newcommand{\what}{\widehat{\wvec}}\) \(\newcommand{\Sighat}{\widehat{\Sigma}}\) \(\newcommand{\lt}{<}\) \(\newcommand{\gt}{>}\) \(\newcommand{\amp}{&}\) \(\definecolor{fillinmathshade}{gray}{0.9}\)Student authors: Luis F. Garcia-Herrera & Henry Price 2020
How TGA works
In thermogravimetric analysis (TGA), a sample is continually weighted while heating, as an inert gas atmosphere is passed over it. Many solids undergo reactions that evolve gaseous byproducts. In TGA, these gaseous byproducts are removed and changes in the remaining mass of the sample are recorded. Three variations are commonly employed:
- Dynamic TGA - Temperature continues to increase over time as mass is recorded. This allows simulataneous identification of how much gas is removed and the temperature at which it occurs.
- Static TGA - Temperature is held constant as the mass is measured. This can be used to gain more information on a decomposition that happens at a certain temperature or to investigate a material’s ability to withstand a given temperature.
- Quasistatic TGA - Sample is heated in multiple temperature intervals, and held at those intervals for a time, often until the mass stabilizes. This is ideal for investigating substances that are known to decompose in various ways at different temperatures, and better characterizing the way in which they decompose.
How to interpret the data
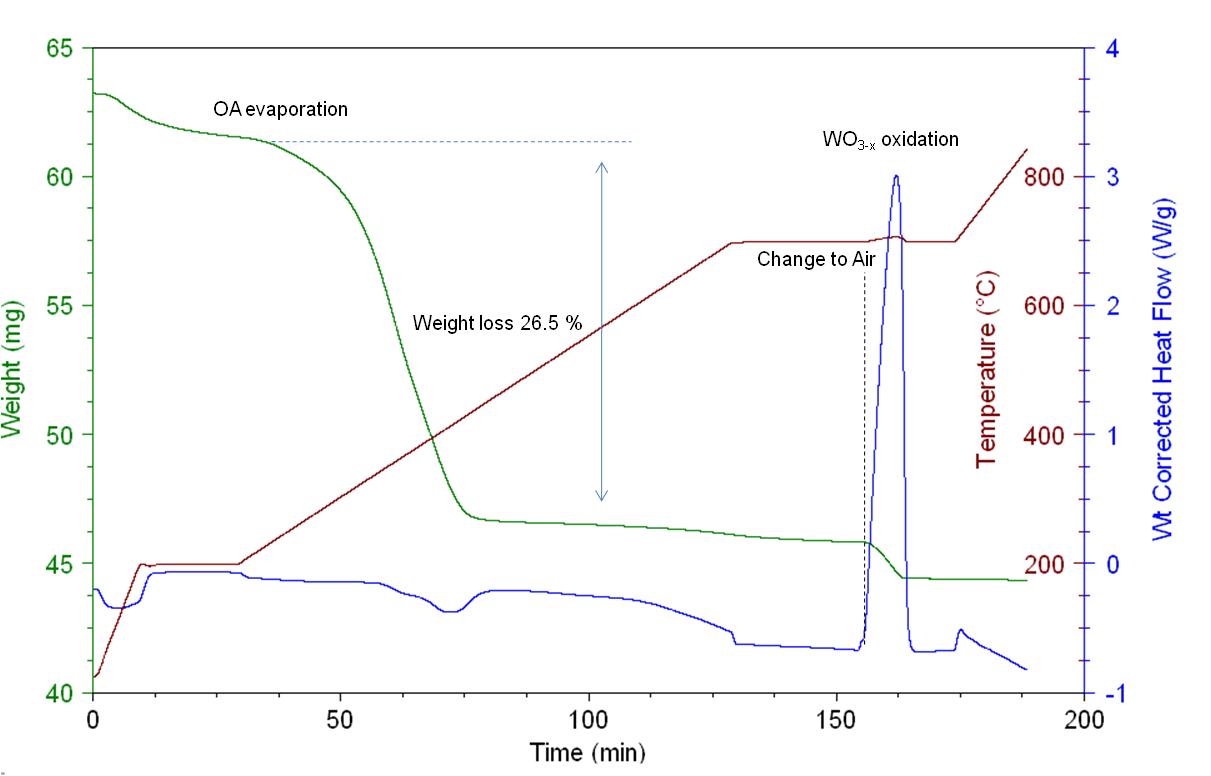
Figure 1 shows a TGA curve in green. Figure from Physical Methods in Chemistry and Nanoscience by Pavan M.V. Raja and Andrew R. Barron (chemlibretext link).
Data from thermogravimetric analysis is often shown by a graph representing mass as a function of temperature for dynamic TGA. For static TGA, mass is instead plotted as a function of time at a given temperature. Quasistatic TGA produces multiple mass vs. time plots for various temperatures. The derivative of the mass change with temperature is often plotted on the same graph to improve ease of identifying the points at which different mass changes occur; especially helpful in cases where multiple decomposition reactions happen in close proximity to one another.
Examples of some characteristic TGA curves for dynamic TGA
Figure 1. Classification of the different observable TGA Curves. Image source
In general, mass fluctuations correspond to chemical reactions, with some exceptions. A common example is drying, which can easily be seen as a quick initial drop at the beginning of heating that isn’t known to correspond to any chemical reactions. Evaporation/sublimation may also appear on the plot depending on the material to be analyzed. Multistage decomposition is also common, and shows as a step-like pattern. In some cases, these steps may blend together during dynamic TGA, necessitating either far slower heating rates, or step-wise methods like quasistatic TGA. Note that TGA itself may not be sufficient to identify the decomposition products; chemical testing of the sample after TGA analysis is often required to ascertain the identities of suspected decomposition products. TGA itself does not identify substances; other methods such as chemical testing or differential calorimetry must performed alongside TGA to verify the identity of products.
Good literature examples
TGA is vital when designing materials that are intended to withstand high temperatures, as if there is even slight decomposition of the material at a temperature that the material would be expected to encounter, devices made of the material may fail over repeated use. The carefully controlled environment of the TGA analyzer also allows for measuring decomposition reaction kinetics. Differential scanning calorimetry can be incorporated into the TGA analyzer to allow for monitoring potential phase changes. Phase changes generally require addition of heat, yet do not increase the temperature of the sample undergoing a phase change. Furthermore, different phases of a material have different heat capacity, and the temperature change per joule of heat applied will vary with phase. By adding a reference pan to the TGA analyzer, changes in the heat capacity in addition to mass changes can be monitored. In this way, both phase changes and thermal decomposition reactions can be simultaneously measured by TGA.
TGA used for decomposition reaction:
Figure S6. Thermogravimetric analysis (TGA) under pure nitrogen flow at 100 mL/min to show a) clean decomposition of 3DP-HKUST-1gel and b) decomposition of 3DP-HKUST-1gelTEA showing that it has several side products during decomposition. (Lim et al. 2019)
Figure 2b. Thermogravimetric analysis (TGA) under simulated ambient conditions (SI section 5), showing desolvation followed by oxidation of 3DP-HKUST-1gel to CuO.
The authors are looking to use colloidal gels containing only ethanol and Cu3(BTC)2 (BTC = 1,3,5-benzenetricarboxylate) (HKUST-1) nanoparticles as ink for the direct ink writing (DIW) of pure densely packed and self-standing Metal-organic frameworks (MOF) monoliths. Traditionally they are synthesized in powder form. The authors are observing the decomposition behavior of the 3DP-HKUST-1gel (made using DIW) and 3DP-HKUST-1gel-TEA (made by triethylamine-induced HKUST-1 gels). It can be observed in the sudden change in weight over the 100-200 °C for Figure S6b that several side products have formed as oppsed to Figure S6a which shows a much cleaner decomposition. The Figure seen in the paper was Figure 2b, the authors attibute the first weight change (16.2 mg) to residual molecules such as H2O, acetate from the copper (II) acetate monohydrate precursor, and excess ethanolic solvent that is trapped inside the 3DP-HKUST-1gel structure. The second weight change (6.2 mg) was observed at 300 °C and is caused by the decomposition of the organic linkers and network.
In-depth reading and works cited
- Physical Methods in Chemistry and Nanoscience by Pavan M.V. Raja and Andrew R. Barron (chemlibretext link).
- A Beginners Guide Thermogravimetric Analysis (TGA): A Beginners Guide to TGA that has FAQ and basic information.
- Thermogravimetry Analysis (TGA) – online training course: Youtube training course that as good explanation about how the TGA works. Also has good examples of plots and how to understand them.
- Thermogravimetric Analysis (TGA) & Differential Scanning Calorimetry (DSC): Slideshow with information about the TGA. Includes figures on classification of curves, how balance works, analyis of curves, effects of heat rate, shifts caused by heat rate, etc.
- THERMAL ANALYSIS OF POLYMERS - Fundamentals and Applications: (WARNING!: This link will download a whole 388 pg. book!) Has a whole chapter dedicated to TGA.