
3.5: Instructions for Viewing and Exporting Data using Syngistics Software
- Page ID
- 454151

\( \newcommand{\vecs}[1]{\overset { \scriptstyle \rightharpoonup} {\mathbf{#1}} } \)
\( \newcommand{\vecd}[1]{\overset{-\!-\!\rightharpoonup}{\vphantom{a}\smash {#1}}} \)
\( \newcommand{\dsum}{\displaystyle\sum\limits} \)
\( \newcommand{\dint}{\displaystyle\int\limits} \)
\( \newcommand{\dlim}{\displaystyle\lim\limits} \)
\( \newcommand{\id}{\mathrm{id}}\) \( \newcommand{\Span}{\mathrm{span}}\)
( \newcommand{\kernel}{\mathrm{null}\,}\) \( \newcommand{\range}{\mathrm{range}\,}\)
\( \newcommand{\RealPart}{\mathrm{Re}}\) \( \newcommand{\ImaginaryPart}{\mathrm{Im}}\)
\( \newcommand{\Argument}{\mathrm{Arg}}\) \( \newcommand{\norm}[1]{\| #1 \|}\)
\( \newcommand{\inner}[2]{\langle #1, #2 \rangle}\)
\( \newcommand{\Span}{\mathrm{span}}\)
\( \newcommand{\id}{\mathrm{id}}\)
\( \newcommand{\Span}{\mathrm{span}}\)
\( \newcommand{\kernel}{\mathrm{null}\,}\)
\( \newcommand{\range}{\mathrm{range}\,}\)
\( \newcommand{\RealPart}{\mathrm{Re}}\)
\( \newcommand{\ImaginaryPart}{\mathrm{Im}}\)
\( \newcommand{\Argument}{\mathrm{Arg}}\)
\( \newcommand{\norm}[1]{\| #1 \|}\)
\( \newcommand{\inner}[2]{\langle #1, #2 \rangle}\)
\( \newcommand{\Span}{\mathrm{span}}\) \( \newcommand{\AA}{\unicode[.8,0]{x212B}}\)
\( \newcommand{\vectorA}[1]{\vec{#1}} % arrow\)
\( \newcommand{\vectorAt}[1]{\vec{\text{#1}}} % arrow\)
\( \newcommand{\vectorB}[1]{\overset { \scriptstyle \rightharpoonup} {\mathbf{#1}} } \)
\( \newcommand{\vectorC}[1]{\textbf{#1}} \)
\( \newcommand{\vectorD}[1]{\overrightarrow{#1}} \)
\( \newcommand{\vectorDt}[1]{\overrightarrow{\text{#1}}} \)
\( \newcommand{\vectE}[1]{\overset{-\!-\!\rightharpoonup}{\vphantom{a}\smash{\mathbf {#1}}}} \)
\( \newcommand{\vecs}[1]{\overset { \scriptstyle \rightharpoonup} {\mathbf{#1}} } \)
\(\newcommand{\longvect}{\overrightarrow}\)
\( \newcommand{\vecd}[1]{\overset{-\!-\!\rightharpoonup}{\vphantom{a}\smash {#1}}} \)
\(\newcommand{\avec}{\mathbf a}\) \(\newcommand{\bvec}{\mathbf b}\) \(\newcommand{\cvec}{\mathbf c}\) \(\newcommand{\dvec}{\mathbf d}\) \(\newcommand{\dtil}{\widetilde{\mathbf d}}\) \(\newcommand{\evec}{\mathbf e}\) \(\newcommand{\fvec}{\mathbf f}\) \(\newcommand{\nvec}{\mathbf n}\) \(\newcommand{\pvec}{\mathbf p}\) \(\newcommand{\qvec}{\mathbf q}\) \(\newcommand{\svec}{\mathbf s}\) \(\newcommand{\tvec}{\mathbf t}\) \(\newcommand{\uvec}{\mathbf u}\) \(\newcommand{\vvec}{\mathbf v}\) \(\newcommand{\wvec}{\mathbf w}\) \(\newcommand{\xvec}{\mathbf x}\) \(\newcommand{\yvec}{\mathbf y}\) \(\newcommand{\zvec}{\mathbf z}\) \(\newcommand{\rvec}{\mathbf r}\) \(\newcommand{\mvec}{\mathbf m}\) \(\newcommand{\zerovec}{\mathbf 0}\) \(\newcommand{\onevec}{\mathbf 1}\) \(\newcommand{\real}{\mathbb R}\) \(\newcommand{\twovec}[2]{\left[\begin{array}{r}#1 \\ #2 \end{array}\right]}\) \(\newcommand{\ctwovec}[2]{\left[\begin{array}{c}#1 \\ #2 \end{array}\right]}\) \(\newcommand{\threevec}[3]{\left[\begin{array}{r}#1 \\ #2 \\ #3 \end{array}\right]}\) \(\newcommand{\cthreevec}[3]{\left[\begin{array}{c}#1 \\ #2 \\ #3 \end{array}\right]}\) \(\newcommand{\fourvec}[4]{\left[\begin{array}{r}#1 \\ #2 \\ #3 \\ #4 \end{array}\right]}\) \(\newcommand{\cfourvec}[4]{\left[\begin{array}{c}#1 \\ #2 \\ #3 \\ #4 \end{array}\right]}\) \(\newcommand{\fivevec}[5]{\left[\begin{array}{r}#1 \\ #2 \\ #3 \\ #4 \\ #5 \\ \end{array}\right]}\) \(\newcommand{\cfivevec}[5]{\left[\begin{array}{c}#1 \\ #2 \\ #3 \\ #4 \\ #5 \\ \end{array}\right]}\) \(\newcommand{\mattwo}[4]{\left[\begin{array}{rr}#1 \amp #2 \\ #3 \amp #4 \\ \end{array}\right]}\) \(\newcommand{\laspan}[1]{\text{Span}\{#1\}}\) \(\newcommand{\bcal}{\cal B}\) \(\newcommand{\ccal}{\cal C}\) \(\newcommand{\scal}{\cal S}\) \(\newcommand{\wcal}{\cal W}\) \(\newcommand{\ecal}{\cal E}\) \(\newcommand{\coords}[2]{\left\{#1\right\}_{#2}}\) \(\newcommand{\gray}[1]{\color{gray}{#1}}\) \(\newcommand{\lgray}[1]{\color{lightgray}{#1}}\) \(\newcommand{\rank}{\operatorname{rank}}\) \(\newcommand{\row}{\text{Row}}\) \(\newcommand{\col}{\text{Col}}\) \(\renewcommand{\row}{\text{Row}}\) \(\newcommand{\nul}{\text{Nul}}\) \(\newcommand{\var}{\text{Var}}\) \(\newcommand{\corr}{\text{corr}}\) \(\newcommand{\len}[1]{\left|#1\right|}\) \(\newcommand{\bbar}{\overline{\bvec}}\) \(\newcommand{\bhat}{\widehat{\bvec}}\) \(\newcommand{\bperp}{\bvec^\perp}\) \(\newcommand{\xhat}{\widehat{\xvec}}\) \(\newcommand{\vhat}{\widehat{\vvec}}\) \(\newcommand{\uhat}{\widehat{\uvec}}\) \(\newcommand{\what}{\widehat{\wvec}}\) \(\newcommand{\Sighat}{\widehat{\Sigma}}\) \(\newcommand{\lt}{<}\) \(\newcommand{\gt}{>}\) \(\newcommand{\amp}{&}\) \(\definecolor{fillinmathshade}{gray}{0.9}\)It is a good habit to use the "offline" version of the software to view and export data that has already been collected. If you use the "online" version (the version used to control the instrument) you could be "locked out" of some features or you can accidentally interfere with someone else's data collection. Follow the steps below to view, capture, and export data collected using the Avio 220 max.
Open Results in the Offline Syngistics
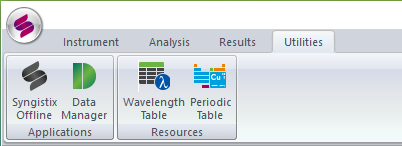
- Open the Offline version of the Syngistics software. You can do this by selecting the grey Syngistics icon
 from the desktop or by selecting it from the Utilities tab in the online software.
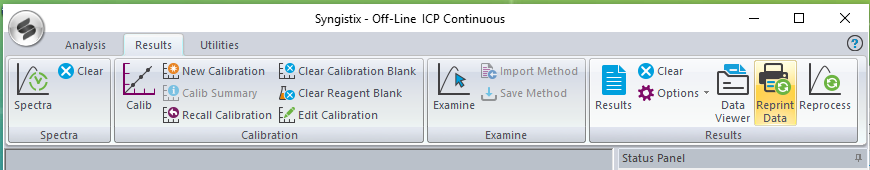
- In the top ribbon menu, choose open the Results tab and select Reprint Data.
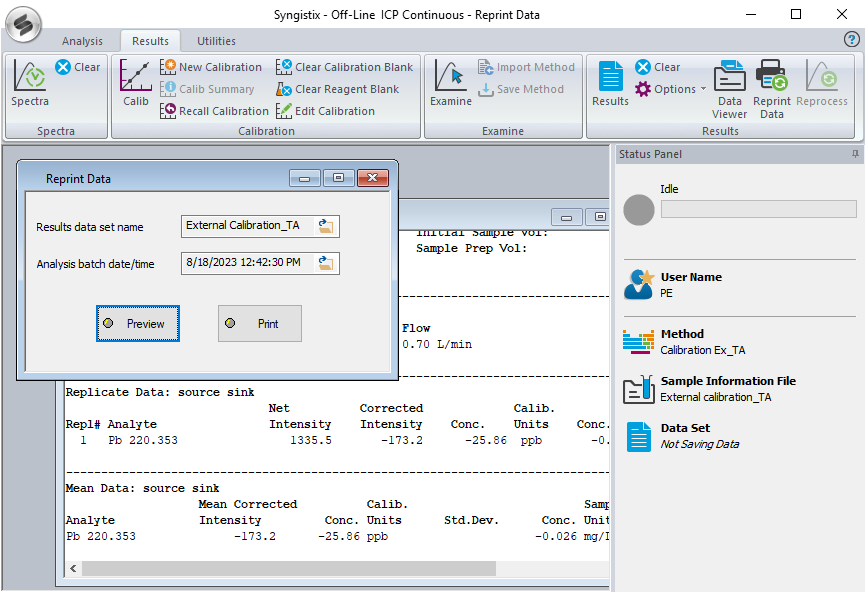
- Choose the Data Set and the batch date/time that you wish to view by clicking on the folder icon
 in the Reprint Data window. Then press Preview and wait until the data has been compiled. The Results window will open with a typed list of each standard and sample result.
View, Capture, and Export Spectra and Qualitative Data
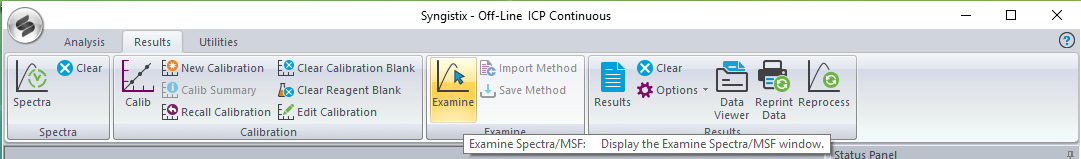
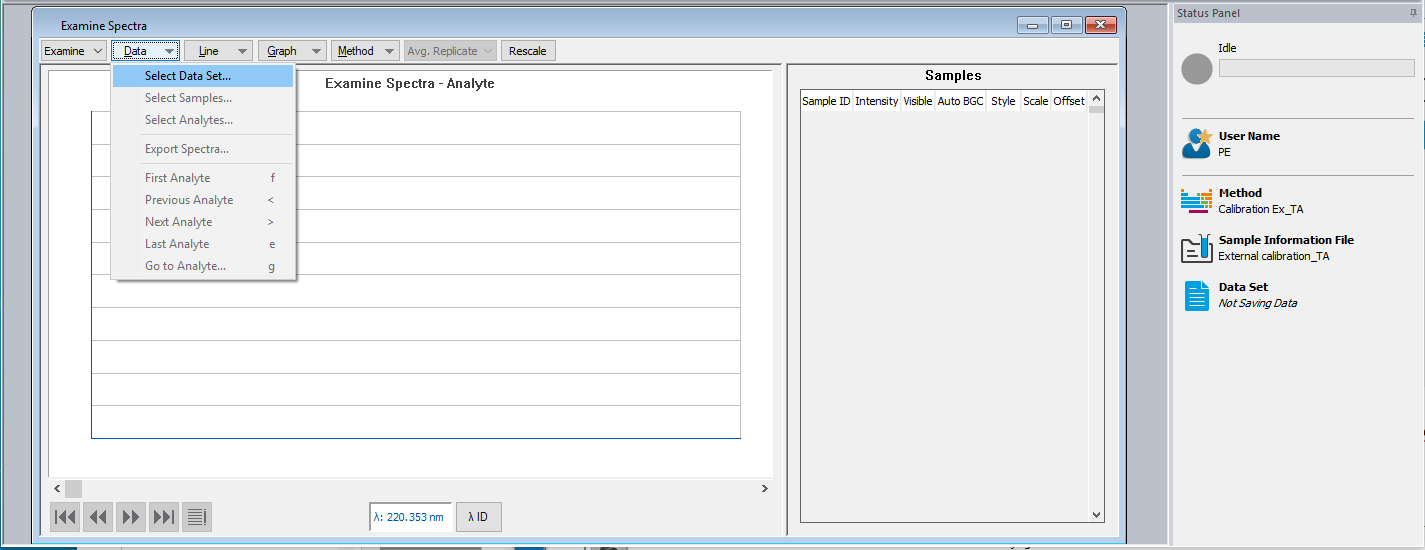
- To view spectral data, use the Examine window. Open the Examine window from the Results tab on the ribbon toolbar.
- From the Examine window, select the data set using Data --> Select Data Set.
- Choose which samples from the data set to view. Then press Next.
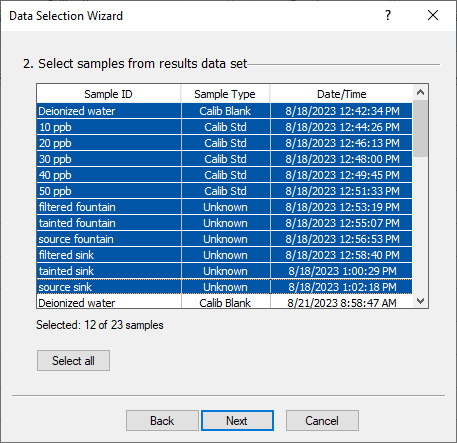
- Select the analytes from each sample that you want to view. Then select Finish.
- The Examine Spectra window should now contain the spectra from each sample and analyte that you choose.
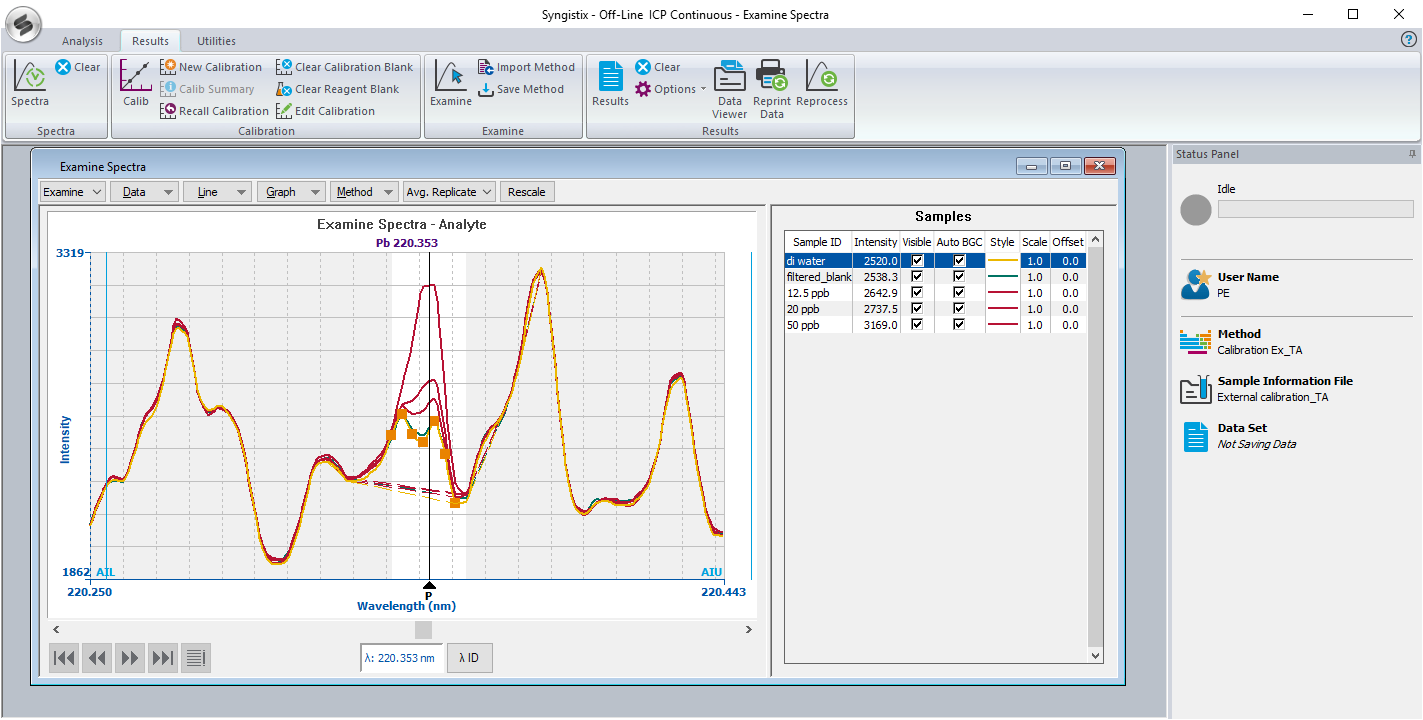
- Adjust view options in Examine Spectra window:
- The spectrum of each sample is shown in the window. Each spectrum also has a dashed line that is the "automatic background correction" - this shows how each peak is integrated.
- There is a list of samples at the right side of the window, and you can click on each sample to make it the "active" sample.
- The highlighted trace should become active in the main spectral window when you click on the sample name.
- The analyte is listed at the top of the spectrum (eg Pb measured at 220.353 nm is shown in the example above).
- You can change the analyte shown using the arrow buttons at the bottom left of the window, or by using the "Data" drop-down menu at the top of the "Examine Spectra" window.
- If the options are chosen to show the "Analytical Points, small orange-yellow boxes called "analytical points" will appear on the active spectrum and the window will be "greyed out" on either side of the anayte peak. To change this, right click anywhere on the list of samples and deselect the "Show Analytical Points" option.
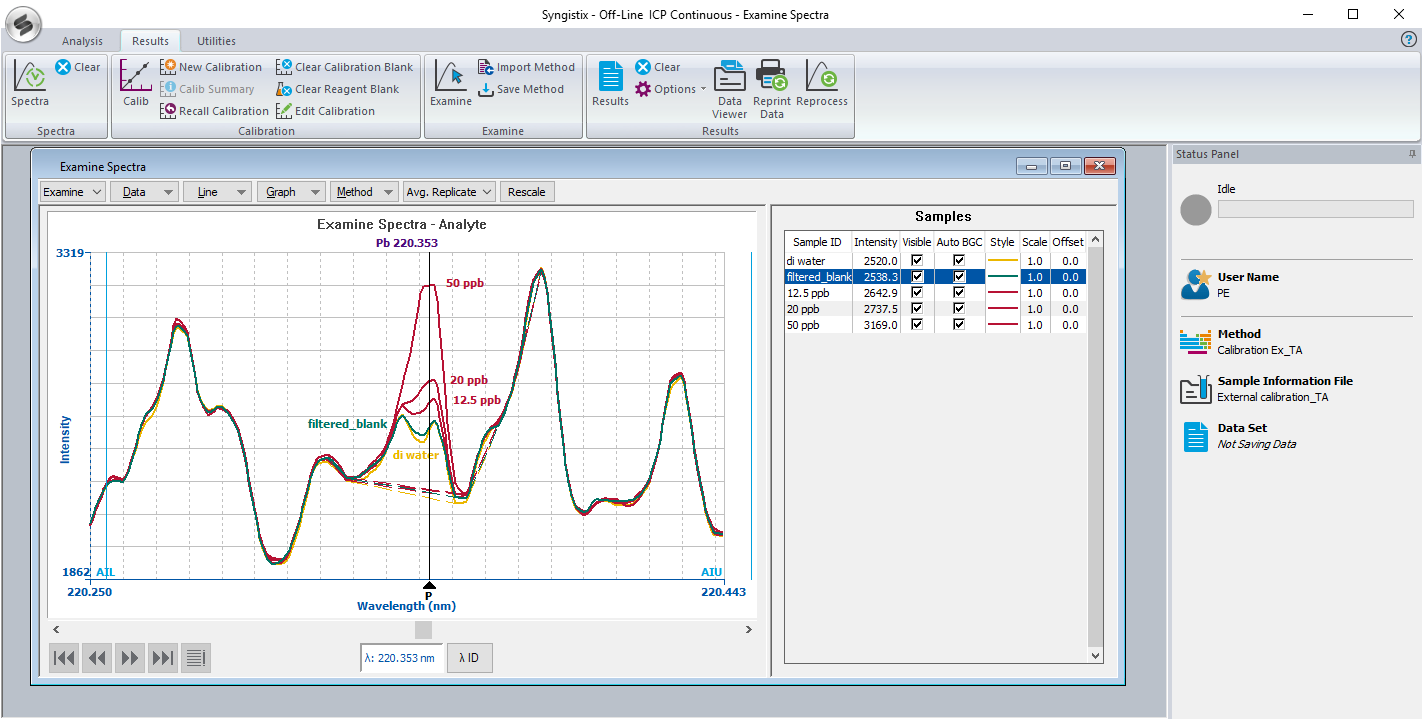
- You can annotate the data with the names of each sample using the Graph options: Graph --> Add Label. To move a label after it is added, highlight the sample to which the label is attached and press SHIFT + CTRL simultaneously, then click on the new location where you would like the label to appear.
- When you have a view that you think is appropriate for capturing your spectra, you can capture the view using the Snipping Tool
 .
. - You can export spectra into a comma delineated or text file using Data--> Export Spectra option. If you export as a comma delineated file, then you can import the file into excel or another similar program to create customized plots of the data.
View and Export Quantitative Data
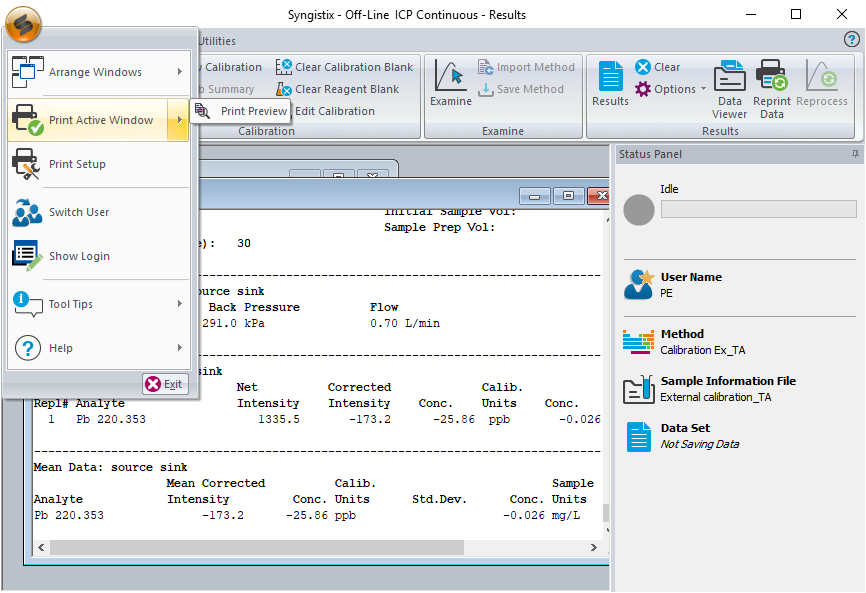
- To export the Results window, click on it to make it active. Then go to the Ball icon at the top left-hand corner of the Syngistix window, and select Print Active Window. Then choose the printer as "Microsoft Print to PDF". Give the report a name begining with "YYYMMDD..." and a specifier that you recognize. Please specify the directory folder as C:\Users\Public\PerkinElmer Syngistix\ICP\Data\Reports\YYYY_reportsCHEM401L (YYYY is the current year). This will produce a pdf containing the calcuated results.
- After the results have been reprinted, you can also open them in the Data Viewer. Choose the Data Viewer from the Results tab. Notice that there are different views of the data available using the tabs at the top of this window. The data in each tab depends on how you set up your method. For a quantitative method, you can view calibration curves in some of the tabs.
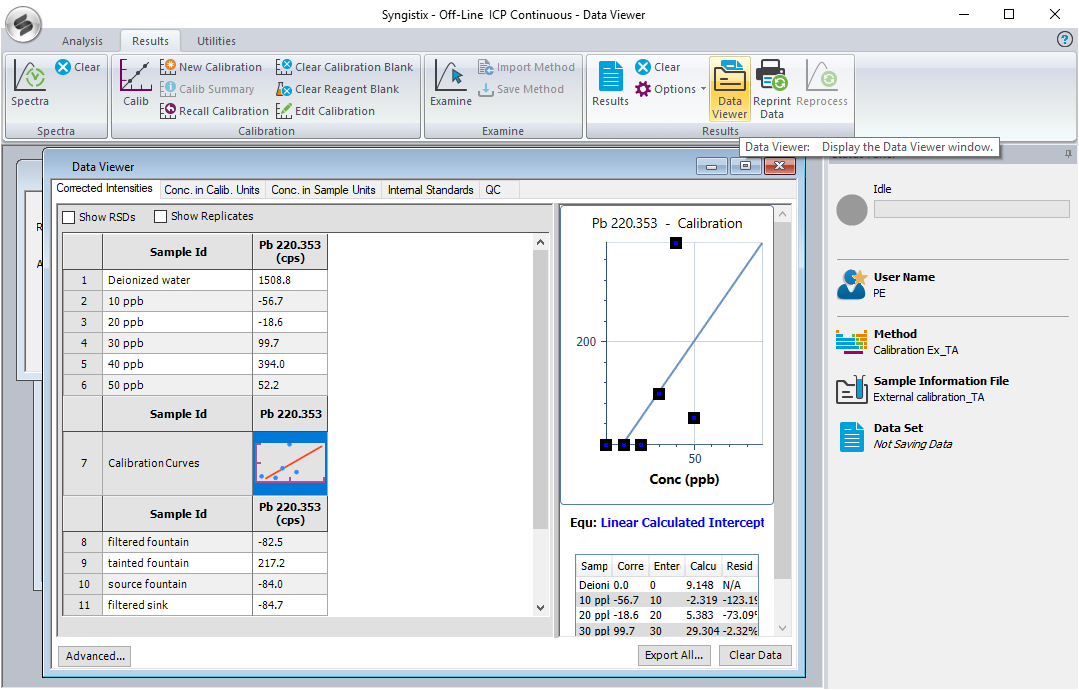
- Export the data from the Data Viewer window into an .xlsx (Microsoft Excel) file by clicking the "Export All..." button at the bottom right of the Data Viewer window. Please choose the same directory specified above and name your .xlsx file using the same root name as the pdf.
Creating figures for your Report
The simples way to show the emission spectra is to use the Synergistics software, then capturing the figure as it appears in the software. To date this is the only way we have figured out to show spectra. On the other hand, calibration data can be exported and plotted in any software you prefer.
To create overlaid emission spectra from multiple samples, you can use the Examine feature and then use a screen capture or printing the active screen (ball menu, see Figure \(\PageIndex{1}\)).
If you'd like to create multi-panel figures, or do more customized labeling of emission spectra, one way is to copy and past each figure into a powerpoint slide and arrange the plots, add annotations. An example spectral figure is given below in Figure \(\PageIndex{2}\). This was created by putting two screen captures in the same powerpoint slide, annotating the panels, and taking a screen shot.