Remove trace metals from any glassware or reusable sample containers
All sample containers and glassware should be rinsed well with dilute nitric acid (0.1 M) to dissolve and remove any trace metal ions that are bound to the interior surface of the container. Expose the interior of the container to 0.1 M nitric acid (\(\ce{HNO3}\)) in deionized water for 10 minutes, then rinse with deionized water.
Sample Collection
Each member of your group should collect a unique water sample. The members of your group should take water from unique locations on campus; or from the same locations at a different time of day. (See where other groups have collected samples on google maps). Each sample should be approximately 1 L of water, and collected using a clean metal-free container. The water should be chosen from a drinking water source on Duke's campus.*
*If you would also like to analyze additional water sources from your home or another place of interest, you are welcome to do so. We can perform qualitative analysis for almost any element - feel free to follow your interests! Additional samples should be collected in smaller 50 mL tubes or in your own containers.
Sample Preparation
Figure \(\PageIndex{1}\): Scheme for sample preparation (CC BY SA; Kathryn Haas)
Source water sample:
Reserve approximately 100 mL of your source water sample for direct analysis using the ICP-OES. (In other words, save some and don't taint it or filter it so we can measure its "original" contents.) Prepare each sample for analysis by filling a 15 or 50 mL sample tube (leave room at the top).
Tainted water sample:
We really hope, and expect, that you won't find much, if any, toxic metal in the water on our campus! To give you some Pb to work with, you will use a certified multi-element standard to contaminate 500 mL of water sample to a final concentration of 25.0 ppb Pb. This is your "tainted" water sample. After you prepare the tainted water solution, prepare each sample for analysis by putting about 10-12 mL in a labeled 15 mL tube.
The detection limit of ICP-OES is close to 1 ppb for Pb under some conditions. Adding a known amount of Pb to your sample will give you a better chance to measure any trace amounts less than the limit of detection that are in the water sample.
Filtered water:
You will use a Brita water filter cartridge to filter a portion of your tainted water and then measure the Pb concentration of the filtered water.
Start by rinsing the filter and pitcher with deionized water three times.
Remove all water from the pitcher and gently shake the pitcher to remove excess water from the entire unit; then remove any of the water.
Filter a small portion of your tainted water three times, discard the filtered water each time into a waste container.
Filter a fourth portion of the tainted water, and collect the filtrate into a clean 15 mL tube. This is the filtered water sample for analysis.
Calibration Standards:
The calibration method is up to you! Review the different methods of calibration (external calibration, standard addition, internal standard) that you have learned about in this course and in the complimentary Analytical Chemistry Lecture Course. You should choose a method of multi-point calibration and plan how you will create the standard solutions necessary to calibrate the instrument. The goal is to accurately measure a solution of approximately 25 ppb Pb. Your group will be provided with the following materials:
Up to 3 mL of a certified Pb standard that contains \(1000 \pm 4\) mg/L (ppm) Pb.
deionized water
0.1 M nitric acid in deionized water
any flasks and containers available in the lab
digital pipettes (for delivering volumes less than 1 mL, or odd volumes <5 mL for which volumetric pipets are unavailable)
volumetric pipets (for most volumes > 1 mL)
You will be given a certified Pb standard that you can use to create the standard solutions or spikes necessary to calibrate the method. You should use volumetric glassware and techniques as you've practiced earlier in this course. If you need to transfer a volume of <5 mL that does no correspond to a typical capacity of a volumetric pipet, a digital pipette can be used to transfer volumes between 10-5000 \(\mu L\). Take note of the errors associated with different types and sizes of pipet(te)s (see orientation module). Make sure that all the glassware is cleaned well to remove any trace contamination (see instructions above).
Data Collection
Qualitative Analysis (Qual-What's in it? )
You can choose to measure for the presence of any analytes you wish (aside from Pb) in the water samples. Each team member should choose at least one unique analyte for qualitative analysis (see the pre-lab assignment) and you should measure for that analyte in the three samples (source water, tainted water, filtered water).
Quantitative Analysis (Quant -How much Pb?)
Determine the Pb concentration of the source (untainted) water samples, the tainted water samples, and the filtered water samples.
Create a calibration curve
Use your calibration to determine the amount of Pb in your water samples.
Validate your method by performing a spiked recovery. If you cannot validate your method, revise your strategy and try again.
Treatment of Data
The general criteria for writing and submitting lab reports are found in the orientation module. Specific additional expectations for this module are given below.
State what analytes your group chose for qualitative analysis, and justify each choice with a pithy statement in your lab report introduction.
Determine whether you have detected the presence of your chosen analytes in your source water, tainted water, and filtered water.
Show the overlaid spectra of each analyte in the water samples (Similar to Figure \(\PageIndex{2}\)).
Discuss whether the analyte concentrations are changed before and after tainting and filtration, and explain how you would quantitate the analytes to determine if there are matrix effects.
Quantitative analysis:
Include the following in your report:
An example figure is given below in Figure \(\PageIndex{2}\). This was created by putting two screen captures in the same powerpoint slide, annotating the panels, and taking a screen shot.
Description of calibration strategy and its validation (include data on spiked recovery).
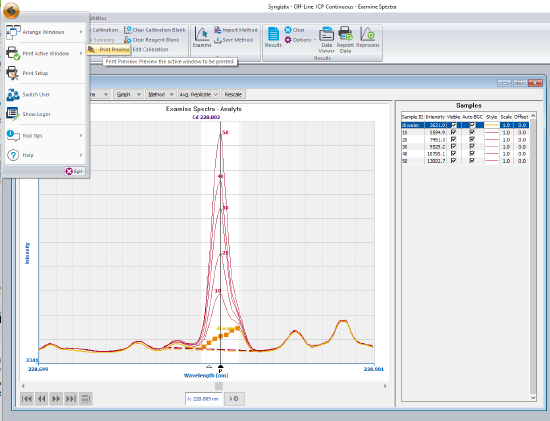
Overlaid spectra of Pb emission from the calibration. You can create such a figure using the Examine Spectra and then use a screen capture or printing the active screen (ball menu, see Figure \(\PageIndex{1}\)).
Figure \(\PageIndex{1}\): Spectra can be viewed using the Examine button in the Results Tab, and then printed to a pdf using the ball menu (top right) and then choose Print Active Window. Alternatively a screen shot can be taken using Shift + Windows + s. (CC-BY-SA; Kathryn Haas)
If you'd like to create multi-panel figures, or do more customized labeling of emission spectra, one way is to copy and past each figure into a powerpoint slide and arrange the plots, add annotations, etc (see example below in Figure \(\PageIndex{2}\)). Then take a screen shot of your figure and paste it in a word document.
Figure \(\PageIndex{2}\): Emission spectra from Cd and Pb in calibration standards detected by ICP-OES, monitored at 228.802 and 220.353 nm, respectively. Spectra from deionized water (di water) are shown in yellow. Standards that contain 10, 20, 30, 40, and 50 ppb of Pb and Cd are shown in red and indicated using red labels (units in ppb = \(\mu g/L\)).
Plots of calibration curve for Pb including a best fit line, R, and error in slope and intercept. These plots should be generated by you, not by the software's automatic analysis.
Overlaid spectra of Pb in water samples (similar to Figure \(\PageIndex{1}\)) .
Quantitative determination of Pb and Cd in each water sample, including error in the derived concentrations.
In the discussion, compare the Pb concentration in each of the samples and determine (1) the concentration of Pb in the source, (2) the concentration of Pb in the tainted water, and (3) the concentration of Pb in the filtered water. Comparison of (2) and (3) will indicate the efficacy of the filter for removing each metal.