
5.9: Instructions for Data Processing using MSD ChemStation Data Analysis Software
- Page ID
- 456277
Data analysis is accomplished using a different software than was used for data collection. The software that is used for data analysis is the MSD Chem Station Data Analysis software, and it is available on the GCMS computers using the "Data Analysis" shortcut on the desktop.

Open and view your data file(s) using the Data Analysis software
- If not already open, open the Data Analysis program
 .
. - Find your data file in the file navigator at the left side of the window - double click on the file name to load the data. **If you do not see the file you want in the lefthand file navigator, go to File--> Load Data File.
- The default view shows the chromatograms. TIC means "total ion chromatogram". The TIC of the scan and of the single ion monitoring (SIM) modes will be shown.
- You can zoom in on a peak or region by clicking and dragging the cursor over the region you want to enlarge. Un-zoom by double clicking on the spectrum window.
- To view the Mass Spectrum (MS), double right-click on the peak of interest or right click and drag to see the MS of a region. The MS should appear as a new window at the bottom of the screen. Notice the peak’s retention time is displayed at the top of the mass spectrum sub window. The abundance is observed as the y-axis of both the chromatogram and mass spectrum.
- Different regions of the peak can give varying information; therefore, it is important to survey places within the same peak.
- Abundances should be in the 1x10⁵- 1x10⁶ range. Abundances of 1x10⁷ and greater are too large and indicate a possible over-injection, too concentrated of a sample, and/or wrong method. Extremely large abundances will shorten the filament lifetime. Conversely, abundances less than 1x10⁵ are also not desired and indicate injector problems, diluted sample, and/or the wrong method. Report abundances that are too high or too low to your TA immediately.
Qualitative Data Processing
- Search for compounds: Do this for one of your standards and for each of your analyte samples. Go to Spectrum--> Library Search Report. Choose the screen as a destination and choose the genie.e integration parameter file. Press OK, and in moments the report should appear on the screen. You can copy/paste the report or save it as a text file.
- NOTE: The default library, "DEMO" is quite limited. To discover more compounds present in your samples, you may switch to the more comprehensive NIST library. To do this, navigate to Spectrum --> Select Library.
- Replace the library path in "Search Order 1" by selecting Browse... on row 1 and selecting "NIST.L"
- Hit "OK" and perform the Library Search Report as described above.
- Extract Ion Chromatograms (EIC): Go to Chromatograms --> Extract Ion Chromatograms. Choose at least one of the masses expected for cocaine (303,182,82 m/z), and one for doxepin (58 amu). Then click on the peaks in the chromatogram to view the MS and determine the retention time for each compound. Record the extracted masses that you use and the retention time of each compound in your notebook - you will need it for the next step.
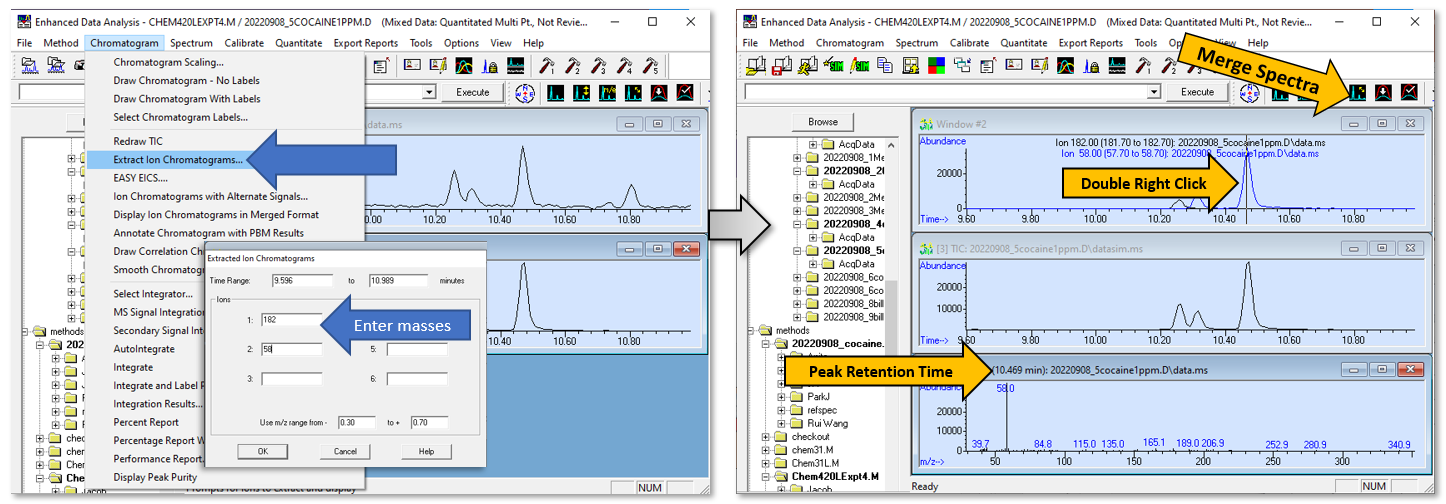
Figure \(\PageIndex{1}\): Infographic showing how to create an extracted ion chromatogram (EIC) from the total ion chromatogram (TIC). (CC-BY-SA; Kathryn Haas for Duke Chem.)
Quantitative Processing
To generate a calibration curve, you will plot \(C_A\) (cocaine concentration) vs \(\frac{S_A}{S_{IS}}\), which is the ratio of the peak area of the cocaine analyte (\(S_A\)) divided by the peak area of the doxepin internal standard (\(S_{IS}\)). Those peak areas may be calculated by the following method:
- Make a compounds list for Quantitation: Now you will create a quantitation method for cocaine and for doxepin.
- Go to Method --> Load Method... and select Default.M. Then press OK.
- Go to Method --> Save Method... and create a name for your method with the format YYYMMDD_cocaine_YOURINITIALS.M. Then press OK. This will create a copy of the Default.M method that you can edit according to your data analysis needs.
- Go to Calibrate --> Edit Compounds... The Edit Compounds window will appear.
- At the left of the Edit Compounds window, right-click on the "Compound Database" line and choose Insert Compound Below Current Compound. Repeat three times so that there are four compounds in the list.
- Edit the compound name to indicate the compound, quant signal, and target mass (e.g. "doxepin_SCAN_58" and "doxepin_SIM_58").
- Enter the compound name, the retention time of the compound, the type of signal for quantitation and the target mass. In the type of signal, use both Scan Ion and SIM Ion for each compound.

Figure \(\PageIndex{2}\): Infographic showing the steps for creating a method for quantitative analysis. (CC-BY-SA; Kathryn Haas for Duke Chem.)
- After you have created the compound list, press OK.
- Save the method using Method-->Save Method...
- Run the quantitation: Quantitate--> Calculate.
- A report will be generated and will appear at the bottom of the window. Scroll down to view the quantitation results.
- Check and edit the peak integration as necessary. Before assuming that the results are correct, view the integration and adjust if necessary.
- Go to View-->QEdit QUANT Results. Click "start" on the list of compounds to view the integration of each peak.
- If necessary, adjust the integration by choosing the compound in the "Quick Qedit" window. Then right click and drag across the bottom of the peak to be integrated.
- If the quantitation shows a nonsense result, or there is no integration because the peak was not found, it may be because the target peak was very small or absent. Choose the analyte that appeared as a strange result in the "Quick Qedit" window. In the chromatogram window, right-click and drag over the baseline where the peak should be. A red line will appear over where you dragged to indicate where the software will integrate the peak.
- Press Exit in the "Quick Qedit" window when you are finished, and choose "Yes" to the prompt that asks you if you'd like to save the changes to the quantitation.
- If you changed the integrations, go to Quantitate--> Generate Report to generate an updated report using the adjusted integration.
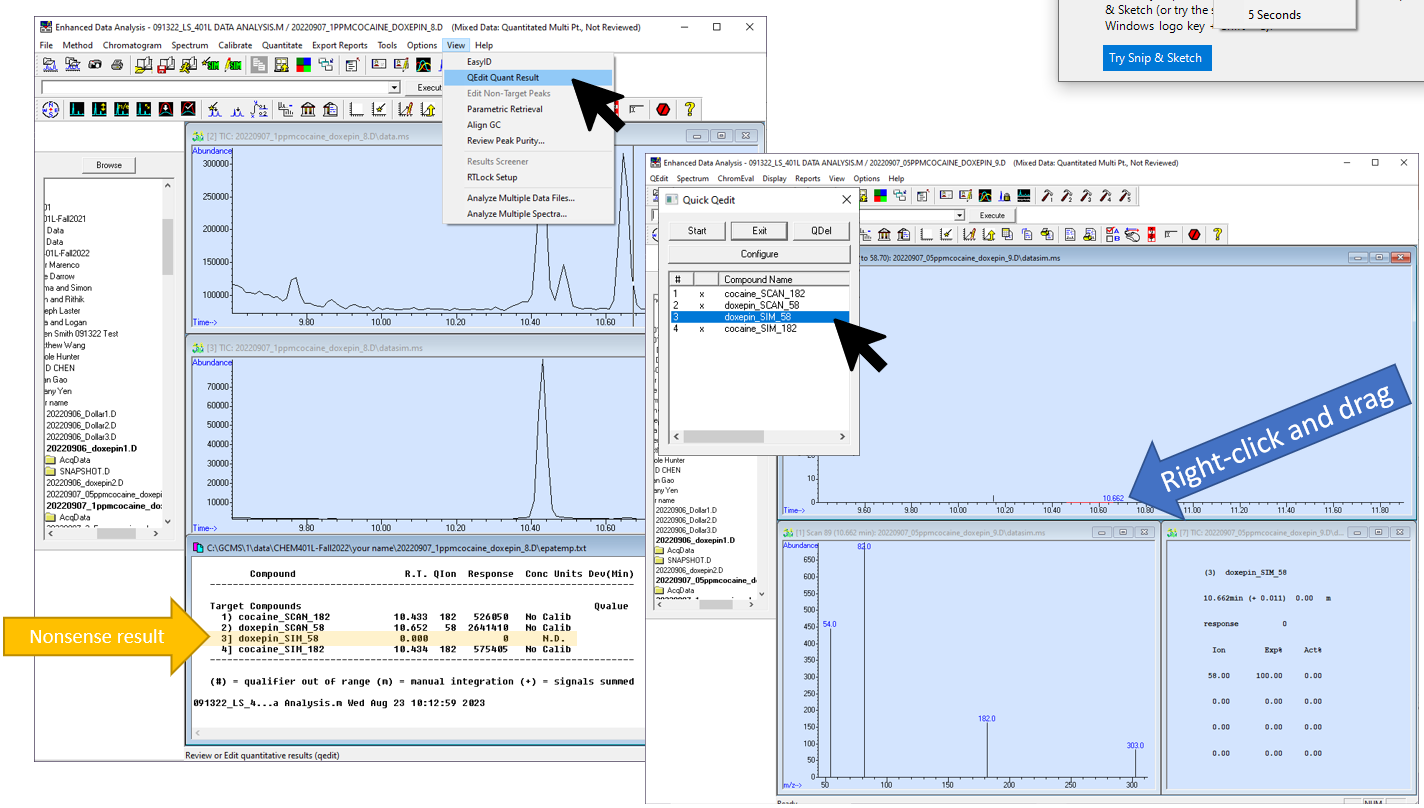
Figure \(\PageIndex{3}\): How to manually change the quantitation in the case that peaks are not integrated correctly or there is no peak and the result is nonsense. (CC-BY-SA; Kathryn Haas for Duke Chem.)
- Copy the Results into a spreadsheet or text file. Probably the easiest way to do this is using Excel. Copy the text block exactly as shown below. Then copy/paste into excel. Use the Text Import Wizard to convert the text into spreadsheet format. Then you can copy/pase the relevant cells into another spreadsheet where you will organize and precess your data.
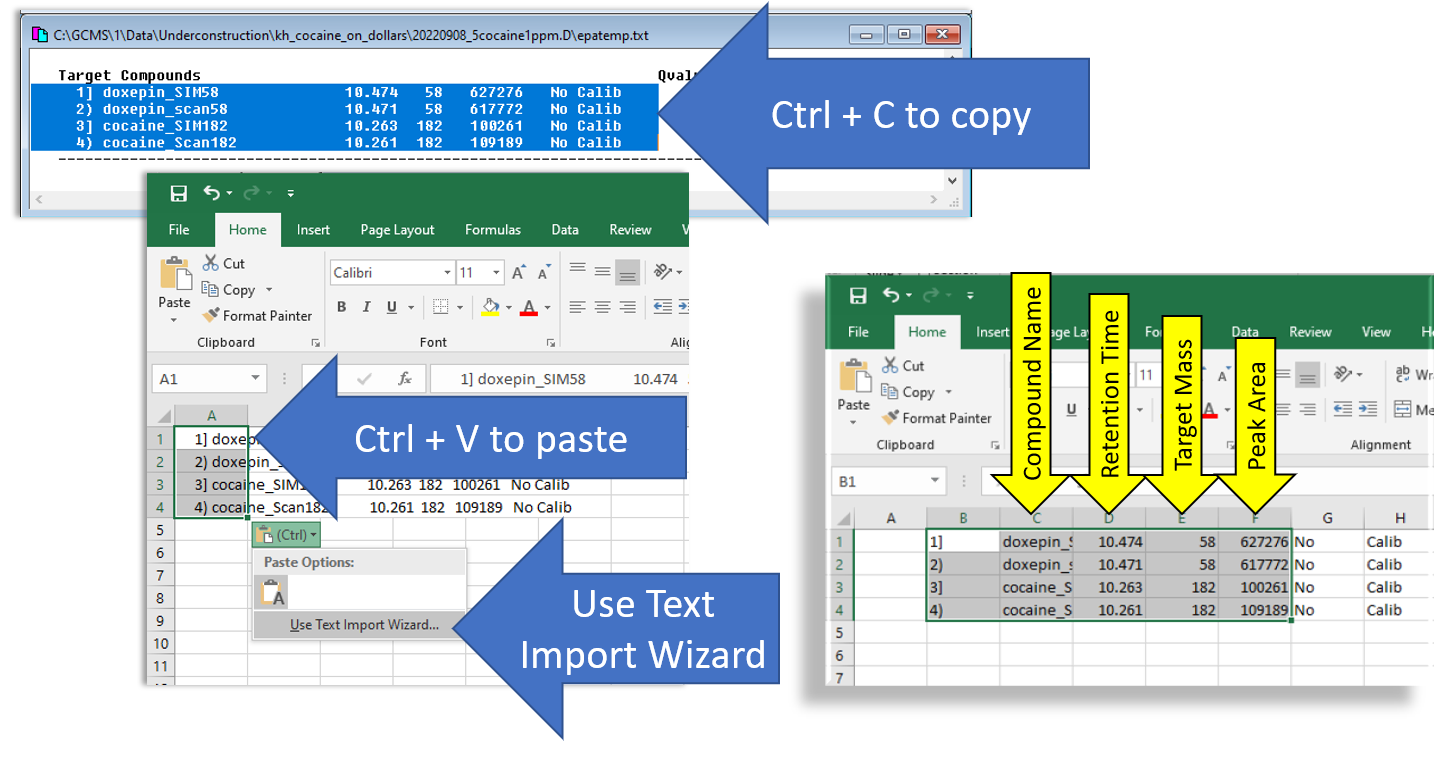
Figure \(\PageIndex{4}\): Infographic showing the steps for copying and pasting the quantitative data into Microsoft Excel. (CC-BY-SA; Kathryn Haas for Duke Chem.) - Now you can repeat the quantitation for the next file. Simply open the next file for quantitation and choose Quantitate--->Calculate and repeat the process outlined in steps 2-3 above.
How to Create figures for reports
Creating nice figures from the Data Analysis program is a bit harder than it should be. Here are some instructions for creating "ok" figures. If you figure out a way to export data and create figures in a better way, please let us know!
General tips
- Double click with both mouse buttons to annotate. The annotation doesn't show up on the screen (ugh!) but it will be there when you copy/paste.
- Capturing data: One option is to copy the spectrum using the "copy" button in the toolbar and paste it into a powerpoint or word file.
 The other option is to copy the screen using the Snipping Tool software.
- From the powerpoint, you can annotate and arrange spectra easily, then screen shot to caputer your work (shift + windows + S)
Arranging chromatograms in the Data Analysis Program
- To create a figure with overlaid chromatograms, like the one shown below in Figure \(\PageIndex{5}\), start by opening a "fresh" copy of the Data Analysis program.
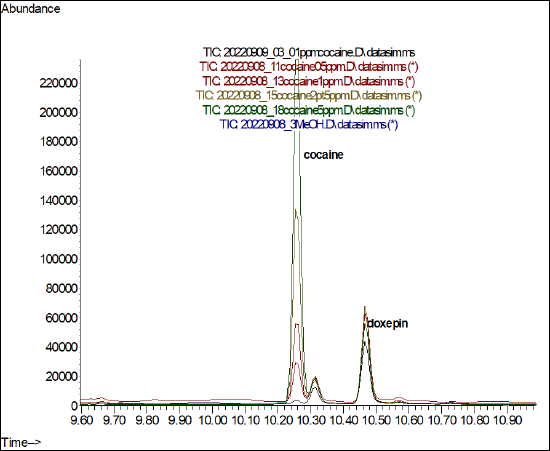
Figure \(\PageIndex{5}\): An example set of overlaid (aka merged) TIC chromatograms with analytes annotated. (CC-BY-SA; Kathryn Haas for Duke Chem.) - Go to the folder where your data is stored and open one of the files. Then choose View-->Analyze multiple data files... and choose a representative data file for each chromatogram you want to view.
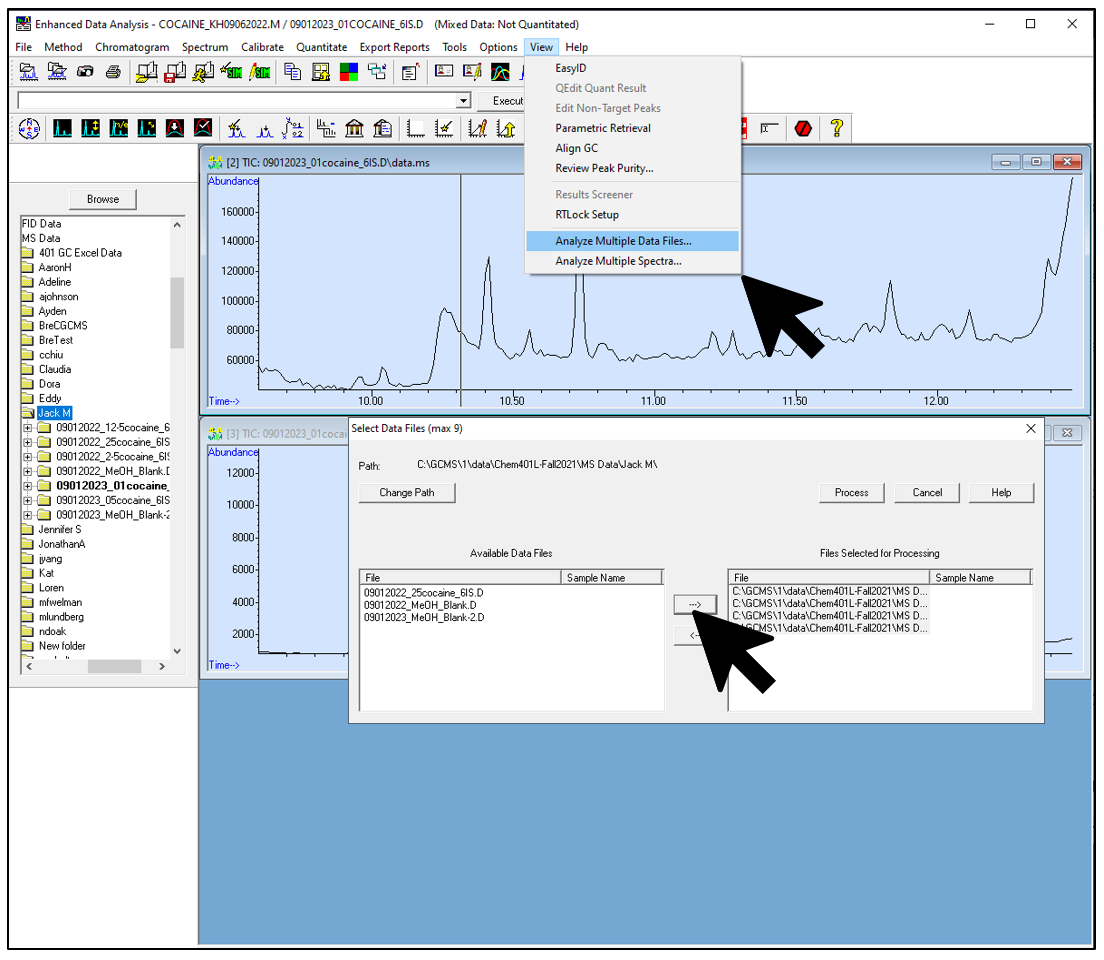
Figure \(\PageIndex{6}\): Inforgraphic that shows how to choose files for an overlaid set of chromatograms. (CC-BY-SA; Kathryn Haas for Duke Chem.) - Choose whether you want to view the TIC or a specific mass. You will need to repeat this for each file, and be sure all are the same!
- Enter "0" (zero) for the TIC
- Enter a specific m/z value for the SIM chromatogram.
- Leave all other lines as "-1" (negative 1) to indicate they are unused.
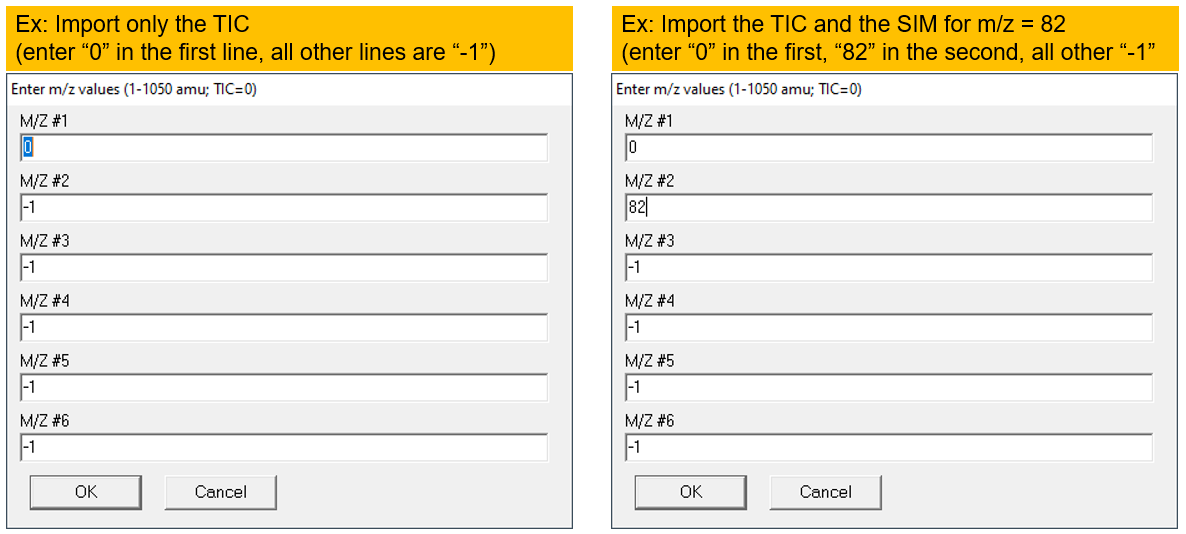
Figure \(\PageIndex{7}\): How to choose the appropriate chromatograms to view multiple data files at once. 0 = TIC, -1 = nothing. (CC-BY-SA; Kathryn Haas for Duke Chem.) - Go to Chromatogram--> Overlay Chromatograms to overlay them. Choose only one "type" of chromatogram for each file (for example, select only "M/Z: 0" for each file to overlay the TIC's for each file. The figure below shows an "overlay" of TIC from four files. Note that this is actually a "stacked" view though the software seems to call this an "overlay".
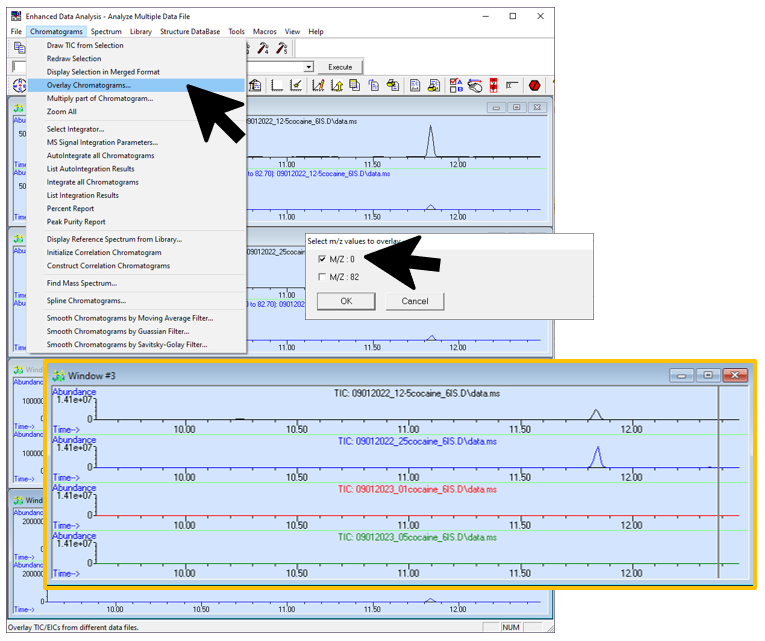
Figure \(\PageIndex{8}\): How combine the appropriate chromatograms into one window. (CC-BY-SA; Kathryn Haas for Duke Chem.) - With the multiple spectra window (the stacked view) highlighted, go to Chromatogram--> Display Selected in Merge Format to "merge" the stacked spectra. Now the view is what most people refer to as an "overlay".
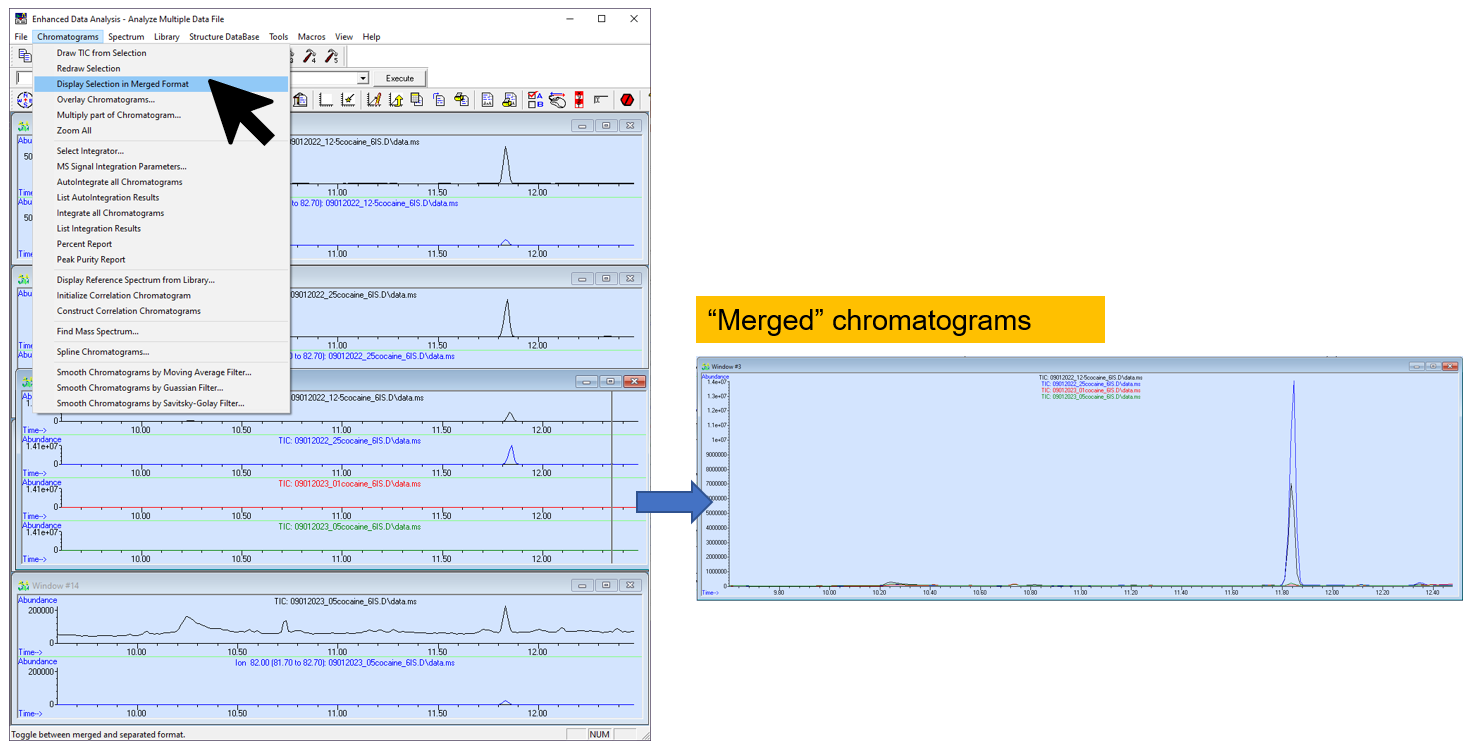
Figure \(\PageIndex{9}\): How to merge (overlay) the chromatograms. (CC-BY-SA; Kathryn Haas for Duke Chem.) - To annotate, double-click near the location where you would like to add an annotation. Specify the justification of the text. Then click "Add". To remove the annotation, double click on it and select "Delete".
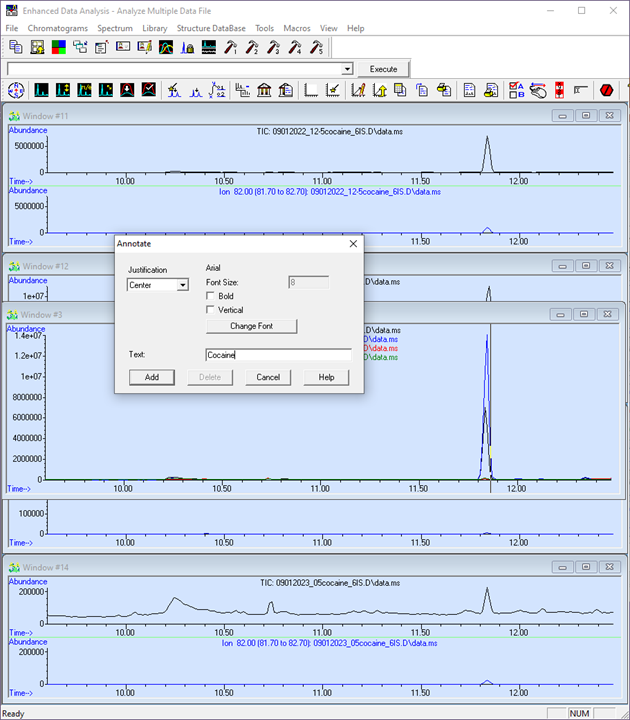
Figure \(\PageIndex{10}\): Double click on the chromatogram to add annotations. (CC-BY-SA; Kathryn Haas for Duke Chem.) - Choose the "Edit Colors" tool
 from the top menu and specify colors of background or other aspects of the plot.
 - Use the Snip tool to capture your chromatograms and then paste the chromatograms in your report or other Word document.
Using a plotting program to generate better chromatograms
As seen in the above figure, the jpg chromatograms generated by Data Analysis are difficult to label and interpret. An alternate qualitative data analysis approach is to export individual chromatograms as CSV files which may be analyzed in Excel to produce cleaner plots.
- Open your data file of interest in Data Analysis
- Go to File --> Export Data To CSV File... and select Current File - Select Destination
- Select Chromatogram in R0
- Navigate to Desktop --> 401L Fall YYYY and create a folder with your name to store your data analysis files, if you haven't already done so. Rename and save the CSV file here.
- Open this CSV file using a program that can plot data (MatLab, Excel, Origin, etc.)
- You will notice that Data Analysis has exported your chromatogram as a series of points where Column A is retention time (min) and Column B is abundance.
- This file contains both data from the TIC (marked by a cell containing "TIC: [sample name]\data.ms") and the SIM (found below the TIC data, marked by "TIC: [sample name]\datasim.ms")
- To plot one of these chromatograms, highlight over all of the data points for either the TIC or SIM and navigate to Insert --> Scatter --> Scatter with Straight Lines
- Repeat this process for all other samples and overlay the data into a single plot to produce a merged chromatogram similar to the one in the figure above.