
4.5: Instructions for using the UV-Vis Spectrophotometers
- Page ID
- 371578
\( \newcommand{\vecs}[1]{\overset { \scriptstyle \rightharpoonup} {\mathbf{#1}} } \)
\( \newcommand{\vecd}[1]{\overset{-\!-\!\rightharpoonup}{\vphantom{a}\smash {#1}}} \)
\( \newcommand{\id}{\mathrm{id}}\) \( \newcommand{\Span}{\mathrm{span}}\)
( \newcommand{\kernel}{\mathrm{null}\,}\) \( \newcommand{\range}{\mathrm{range}\,}\)
\( \newcommand{\RealPart}{\mathrm{Re}}\) \( \newcommand{\ImaginaryPart}{\mathrm{Im}}\)
\( \newcommand{\Argument}{\mathrm{Arg}}\) \( \newcommand{\norm}[1]{\| #1 \|}\)
\( \newcommand{\inner}[2]{\langle #1, #2 \rangle}\)
\( \newcommand{\Span}{\mathrm{span}}\)
\( \newcommand{\id}{\mathrm{id}}\)
\( \newcommand{\Span}{\mathrm{span}}\)
\( \newcommand{\kernel}{\mathrm{null}\,}\)
\( \newcommand{\range}{\mathrm{range}\,}\)
\( \newcommand{\RealPart}{\mathrm{Re}}\)
\( \newcommand{\ImaginaryPart}{\mathrm{Im}}\)
\( \newcommand{\Argument}{\mathrm{Arg}}\)
\( \newcommand{\norm}[1]{\| #1 \|}\)
\( \newcommand{\inner}[2]{\langle #1, #2 \rangle}\)
\( \newcommand{\Span}{\mathrm{span}}\) \( \newcommand{\AA}{\unicode[.8,0]{x212B}}\)
\( \newcommand{\vectorA}[1]{\vec{#1}} % arrow\)
\( \newcommand{\vectorAt}[1]{\vec{\text{#1}}} % arrow\)
\( \newcommand{\vectorB}[1]{\overset { \scriptstyle \rightharpoonup} {\mathbf{#1}} } \)
\( \newcommand{\vectorC}[1]{\textbf{#1}} \)
\( \newcommand{\vectorD}[1]{\overrightarrow{#1}} \)
\( \newcommand{\vectorDt}[1]{\overrightarrow{\text{#1}}} \)
\( \newcommand{\vectE}[1]{\overset{-\!-\!\rightharpoonup}{\vphantom{a}\smash{\mathbf {#1}}}} \)
\( \newcommand{\vecs}[1]{\overset { \scriptstyle \rightharpoonup} {\mathbf{#1}} } \)
\( \newcommand{\vecd}[1]{\overset{-\!-\!\rightharpoonup}{\vphantom{a}\smash {#1}}} \)
\(\newcommand{\avec}{\mathbf a}\) \(\newcommand{\bvec}{\mathbf b}\) \(\newcommand{\cvec}{\mathbf c}\) \(\newcommand{\dvec}{\mathbf d}\) \(\newcommand{\dtil}{\widetilde{\mathbf d}}\) \(\newcommand{\evec}{\mathbf e}\) \(\newcommand{\fvec}{\mathbf f}\) \(\newcommand{\nvec}{\mathbf n}\) \(\newcommand{\pvec}{\mathbf p}\) \(\newcommand{\qvec}{\mathbf q}\) \(\newcommand{\svec}{\mathbf s}\) \(\newcommand{\tvec}{\mathbf t}\) \(\newcommand{\uvec}{\mathbf u}\) \(\newcommand{\vvec}{\mathbf v}\) \(\newcommand{\wvec}{\mathbf w}\) \(\newcommand{\xvec}{\mathbf x}\) \(\newcommand{\yvec}{\mathbf y}\) \(\newcommand{\zvec}{\mathbf z}\) \(\newcommand{\rvec}{\mathbf r}\) \(\newcommand{\mvec}{\mathbf m}\) \(\newcommand{\zerovec}{\mathbf 0}\) \(\newcommand{\onevec}{\mathbf 1}\) \(\newcommand{\real}{\mathbb R}\) \(\newcommand{\twovec}[2]{\left[\begin{array}{r}#1 \\ #2 \end{array}\right]}\) \(\newcommand{\ctwovec}[2]{\left[\begin{array}{c}#1 \\ #2 \end{array}\right]}\) \(\newcommand{\threevec}[3]{\left[\begin{array}{r}#1 \\ #2 \\ #3 \end{array}\right]}\) \(\newcommand{\cthreevec}[3]{\left[\begin{array}{c}#1 \\ #2 \\ #3 \end{array}\right]}\) \(\newcommand{\fourvec}[4]{\left[\begin{array}{r}#1 \\ #2 \\ #3 \\ #4 \end{array}\right]}\) \(\newcommand{\cfourvec}[4]{\left[\begin{array}{c}#1 \\ #2 \\ #3 \\ #4 \end{array}\right]}\) \(\newcommand{\fivevec}[5]{\left[\begin{array}{r}#1 \\ #2 \\ #3 \\ #4 \\ #5 \\ \end{array}\right]}\) \(\newcommand{\cfivevec}[5]{\left[\begin{array}{c}#1 \\ #2 \\ #3 \\ #4 \\ #5 \\ \end{array}\right]}\) \(\newcommand{\mattwo}[4]{\left[\begin{array}{rr}#1 \amp #2 \\ #3 \amp #4 \\ \end{array}\right]}\) \(\newcommand{\laspan}[1]{\text{Span}\{#1\}}\) \(\newcommand{\bcal}{\cal B}\) \(\newcommand{\ccal}{\cal C}\) \(\newcommand{\scal}{\cal S}\) \(\newcommand{\wcal}{\cal W}\) \(\newcommand{\ecal}{\cal E}\) \(\newcommand{\coords}[2]{\left\{#1\right\}_{#2}}\) \(\newcommand{\gray}[1]{\color{gray}{#1}}\) \(\newcommand{\lgray}[1]{\color{lightgray}{#1}}\) \(\newcommand{\rank}{\operatorname{rank}}\) \(\newcommand{\row}{\text{Row}}\) \(\newcommand{\col}{\text{Col}}\) \(\renewcommand{\row}{\text{Row}}\) \(\newcommand{\nul}{\text{Nul}}\) \(\newcommand{\var}{\text{Var}}\) \(\newcommand{\corr}{\text{corr}}\) \(\newcommand{\len}[1]{\left|#1\right|}\) \(\newcommand{\bbar}{\overline{\bvec}}\) \(\newcommand{\bhat}{\widehat{\bvec}}\) \(\newcommand{\bperp}{\bvec^\perp}\) \(\newcommand{\xhat}{\widehat{\xvec}}\) \(\newcommand{\vhat}{\widehat{\vvec}}\) \(\newcommand{\uhat}{\widehat{\uvec}}\) \(\newcommand{\what}{\widehat{\wvec}}\) \(\newcommand{\Sighat}{\widehat{\Sigma}}\) \(\newcommand{\lt}{<}\) \(\newcommand{\gt}{>}\) \(\newcommand{\amp}{&}\) \(\definecolor{fillinmathshade}{gray}{0.9}\)Below are the instructions for using the Agilent Cary Series UV-Visible spectrophotometer in the Absorption Spectrum of Conjugated Dyes experiment.
There are two sample holders in the instrument. The Sample is placed in the front holder. A Reference cuvette can be placed in the back holder or the back holder can be left empty (no cuvette).
Start-up:
At the begriming of the lab period, check to confirm that the UV-vis is switched "on". There are several UV-vis instruments in the Duke Chemistry undergraduate learning spaces. Be sure you discuss which instrument you will use with your instructor.
- The Cary 100 instruments have tungsten and deuterium lamps that must be warmed up for approximately 1 hour prior to use for best results. However, since we are only doing qualitative analysis, it is sufficient for this experiment to warm them up for only a couple of minutes.
- The Cary 60 instrument has a xenon flash lamp, which does not require warm up.
How to turn on the Cary 100: With both sample and reference holders empty and the cover closed, turn on the instrument with the switch at the front, lower left. Wait two minutes before proceeding further.
How to turn on the Cary 60: The Cary 60 should not be turned off. But, if it is off, check that the cell holders are empty and press the power button on the instrument.
Validating the Wavelength Accuracy of the UV-Vis Spectrometer
- Open the Validation Software by clicking the
icon from the Windows main screen. After a few moments the software screen will appear and will begin to communicate with the instrument. You can follow the progress by monitoring the display at the lower left of the screen. When the traffic light in the upper center turns green, the system is ready. You will see absorbance in the upper left and wavelength in the upper right.

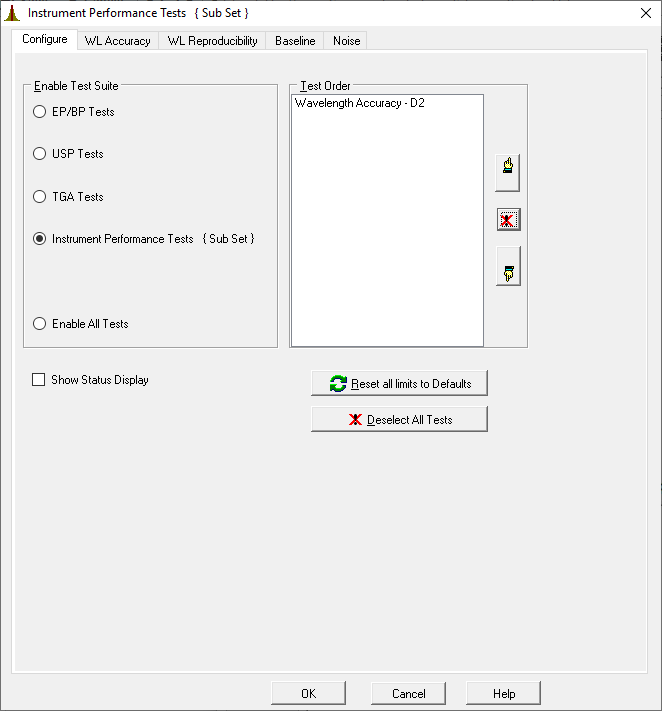
- Click the
button and select Instrument Performance Tests. While you could run all of the tests listed, the one that is required is the Wavelength Accuracy test. Depending on whether you are using a Cary 100 or a Cary 60, this test with use either the D2 or Xe lamp. Be sure to note which instrument you are using and which lamp is used for the wavelenght validation.
Using thebutton, you can remove all tests from the list except for the Wavelength Accuracy. The screen should look as shown here.
- Click the
button and, when the setup screen appears, place your names in the Name line; and, the name of the test in the comments box. In the Options section select Auto Print, Results and Graph. Data Form and Company Logo should not be checked. % Page Height set at 50 is fine.
- Click
to return to the main screen.
- Check the sample compartment to be sure that there are no samples in the instrument and that there is nothing blacking the light path. Gently close the sample compartment.
- Click
to begin wavelength accuracy test. As the test proceeds the emission spectrum from the lamp will be displayed. At the conclusion of the test, a report will be generated on the screen. Include these data in your laboratory report. Check to be sure that the difference between the expected and observed peak positions is one the order of \(\pm 0.2-0.4\) nm. If it is greater than that, consult your TA or your Instructor before proceeding further.

- Exit the Validation software and return to the Windows Desktop.
Absorption Spectrum of Conjugated Dyes
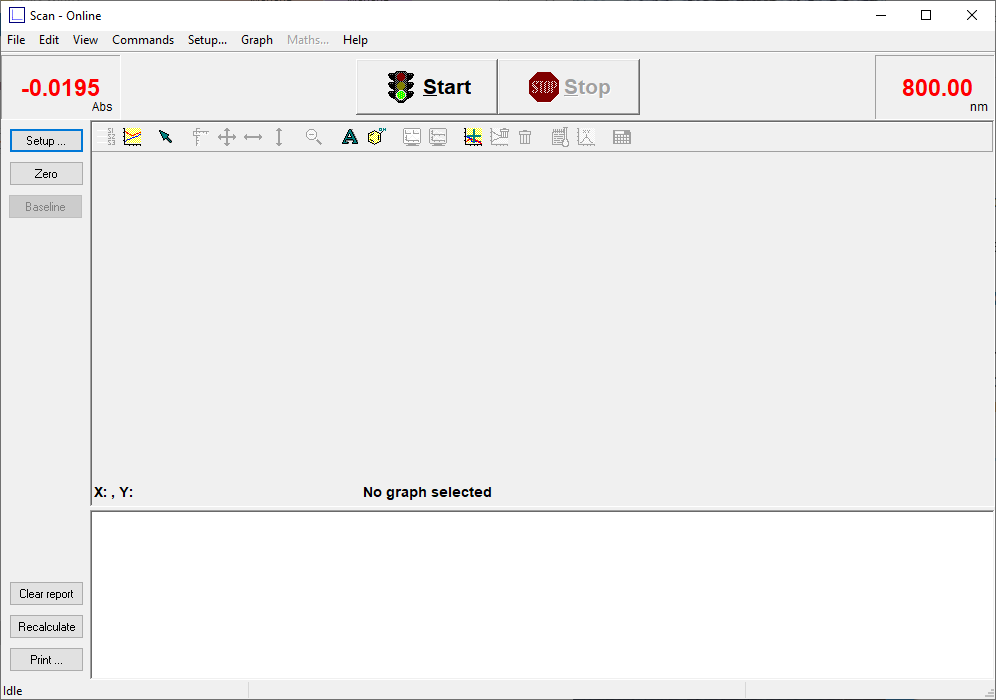
- Load the Scan Software by clicking the
icon on the Windows main screen. In a few moments the scan software main screen will appear and will begin to communicate with the instrument. You can follow the progress by monitoring the display at the lower left of the screen. When the traffic light at the top center of the screen turns green, the system is ready. You will see absorbance at the upper left and wavelength at the upper right of the screen.
- Click the
button and wait for the setup screen to appear. Select, first, the Cary tab to begin setting parameters for your sample runs. Under X-mode, the Mode should be set to nanometers and your scan range from 750 nm to 400 nm. Under Y-mode, the Mode should be set to absorbance and the range from (-)0.05 to 1.0. The Ave time should be 0.1 seconds and the Data interval should be set to 1 nm. This will yield a Scan Rate of 600 nm/min.
- Select the Options tab on the setup screen and set the Spectral Band Width (SBW) to 2 nm. Select Double Beam Mode. Select UV-Vis as the source and be sure the Source changeover is set to 350 nm. Under Display options you can choose Overlay Data.

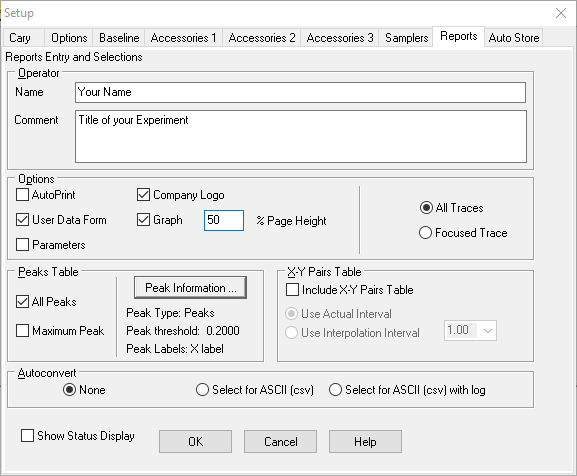
- Finally, select the Reports tab.
- Put your names in the Name box and the title of the experiment in the Comment box.
- In the Options box, check Data Form, Graph and Focused trace. Do not check Auto print, or Parameters. Select All Traces. And % Page Height set at 50 is fine.
- Under Peak Table, put a check in All peaks.
- Be sure the Include XY pairs table is not checked.
- Click the Peak Information button, and set the Threshold to 0.200. Put Peaks in the Peak Type box.
- Click
to close the Peak information box, and
again to return to the main screen.
- Place your first sample in the sample compartment and if you are using a reference cuvette, put your reference in the reference compartment and close the cover.
- Click
to begin the run.
- You will be prompted for a filename. Since you will be running four samples, give the file a general name, for example Dyes with the date (many sample spectra can be stored in a single file).
- You will then be prompted for a sample name. Place the name of the sample (Dye 1, 2, 3, or 4) in this box.
- As each run proceeds you will see the spectrum generated in real time on the screen. Make sure the maximum absorbance of each sample is between approximately 0.2 and 1.0; adjust the dye concentration to get the proper absorbance.
- At the conclusion of each run, place the next sample in the sample compartment and initiate the new scan.
If you didn't select Overlay Data, or if you want to add or remove traces from the overlaid runs on the screen, click the button at the upper left of the main screen. Select files to add or to remove by checking or removing cheks from available traces shown in the list. Then click OK. Your changes will be made to the main screen.