
Section 2.4: Periodic Properties of Atoms
- Page ID
- 440768
\( \newcommand{\vecs}[1]{\overset { \scriptstyle \rightharpoonup} {\mathbf{#1}} } \)
\( \newcommand{\vecd}[1]{\overset{-\!-\!\rightharpoonup}{\vphantom{a}\smash {#1}}} \)
\( \newcommand{\id}{\mathrm{id}}\) \( \newcommand{\Span}{\mathrm{span}}\)
( \newcommand{\kernel}{\mathrm{null}\,}\) \( \newcommand{\range}{\mathrm{range}\,}\)
\( \newcommand{\RealPart}{\mathrm{Re}}\) \( \newcommand{\ImaginaryPart}{\mathrm{Im}}\)
\( \newcommand{\Argument}{\mathrm{Arg}}\) \( \newcommand{\norm}[1]{\| #1 \|}\)
\( \newcommand{\inner}[2]{\langle #1, #2 \rangle}\)
\( \newcommand{\Span}{\mathrm{span}}\)
\( \newcommand{\id}{\mathrm{id}}\)
\( \newcommand{\Span}{\mathrm{span}}\)
\( \newcommand{\kernel}{\mathrm{null}\,}\)
\( \newcommand{\range}{\mathrm{range}\,}\)
\( \newcommand{\RealPart}{\mathrm{Re}}\)
\( \newcommand{\ImaginaryPart}{\mathrm{Im}}\)
\( \newcommand{\Argument}{\mathrm{Arg}}\)
\( \newcommand{\norm}[1]{\| #1 \|}\)
\( \newcommand{\inner}[2]{\langle #1, #2 \rangle}\)
\( \newcommand{\Span}{\mathrm{span}}\) \( \newcommand{\AA}{\unicode[.8,0]{x212B}}\)
\( \newcommand{\vectorA}[1]{\vec{#1}} % arrow\)
\( \newcommand{\vectorAt}[1]{\vec{\text{#1}}} % arrow\)
\( \newcommand{\vectorB}[1]{\overset { \scriptstyle \rightharpoonup} {\mathbf{#1}} } \)
\( \newcommand{\vectorC}[1]{\textbf{#1}} \)
\( \newcommand{\vectorD}[1]{\overrightarrow{#1}} \)
\( \newcommand{\vectorDt}[1]{\overrightarrow{\text{#1}}} \)
\( \newcommand{\vectE}[1]{\overset{-\!-\!\rightharpoonup}{\vphantom{a}\smash{\mathbf {#1}}}} \)
\( \newcommand{\vecs}[1]{\overset { \scriptstyle \rightharpoonup} {\mathbf{#1}} } \)
\( \newcommand{\vecd}[1]{\overset{-\!-\!\rightharpoonup}{\vphantom{a}\smash {#1}}} \)
Introduction
General periodic trends are specific patterns that are present within the periodic table; these are patterns in properties like electronegativity, ionization energy, electron affinity, atomic radius, melting point, and metallic character. General periodic trends provide chemists with an invaluable tool to quickly predict an element's properties. These trends exist because of the similar atomic structure of the elements within their respective group families or periods, and because of the periodic nature of the elements. Some of the general periodic trends are described in this section.
Ionization Energy
Ionization energy (IE) is the energy required to remove an electron from a neutral atom or cation in its gaseous phase. IE is also known as ionization potential.
\[A^{n+}_{(g)} \longrightarrow A^{(n+1)+}_{(g)} + e^- \hspace{1cm} IE = \Delta U\]
Conceptually, ionization energy is the affinity of an element for its outermost electron (an electron it already has in its valence shell).
1st, 2nd, and 3rd Ionization Energies
The symbol \(IE_1\) stands for the first ionization energy (energy required to take away an electron from a neutral atom, where \(n=0\)). The symbol \(IE_2\) stands for the second ionization energy (energy required to take away an electron from an atom with a +1 charge, \(n=2\).)
First Ionization Energy, \(IE_1\) (general element, A): \( A_{(g)} \rightarrow A^{1+}_{(g)} + e^- \)
Second Ionization Energy, \(IE_2\) (general element, A): \( A^{1+}_{(g)} \rightarrow A^{2+}_{(g)} + e^- \)
Third Ionization Energy, \(IE_3\) (general element, A): \( A^{2+}_{(g)} \rightarrow A^{3+}_{(g)} + e^- \)
Each succeeding ionization energy is larger than the preceding energy. This means that \(IE_1 < IE_2 < IE_3 < ... < IE_n\) will always be true. For example, ionization energy increases as succeeding electrons are taken away from Mg.
\[ Mg \,_{(g)} \rightarrow Mg^+\,_{(g)} + e^- \;\;\; IE_1= 738\, kJ/mol \]
\[Mg^+ \,_{(g)} \rightarrow Mg^{2+}\,_{(g)} + e^- \;\;\; IE_2= 1451\, kJ/mol\]
Ionization energy is correlated with the strength of attraction between the positively-charged nucleus and the negatively-charged valence electrons, and therefore the effective nuclear charge \(Z_eff\). The higher the ionization energy, the stronger the attractive force between nucleus and valence electrons, and the more energy is required to remove a valence electron. The lower the ionization energy, the weaker the attractive force between nucleus and valence electrons, and the less energy required to remove a valence electron.
General periodic trends in ionization energy
In general, ionization energies increase from left to right and decrease down a group; however there are variations in these trends that would be expected from the effects of penetration and shielding. The trends in first ionization energy are shown in Figure \(\PageIndex{1}\) and are summarized below.
- Across a period: As Z* increases across a period, the ionization energy of the elements generally increases from left to right. However there are breaks or variation in the trends in the following cases:
- IE is especially low when removal of an electron creates a newly empty p subshell (examples include \(IE_1\) of B, Al, Sc)
- IE energy is especially low where removal of an electron results in a half-filled p or d subshell (examples include \(IE_1\) of O, S)
- IE increases more gradually across the d- and f-subshells compared to s- and p- subshells. This is because d- and f- electrons are weakly penetrating and experience especially low Z*.
- From one period to the next: There is an especially large decrease in IE with the start of every new period (from He to Li or from Ne to Na for example). This is consistent with the idea that IE is especially low when removal of an electron creates a newly empty s-subshell.
- Nobel gases: The noble gases posses very high ionization energies. Note that helium has the highest ionization energy of all the elements.
- Down a group: Although Z* increases going down a group, there is no reliable trend in IE going down any group; in some cases IE increases going down a group, while in other cases IE decreases going down a group.
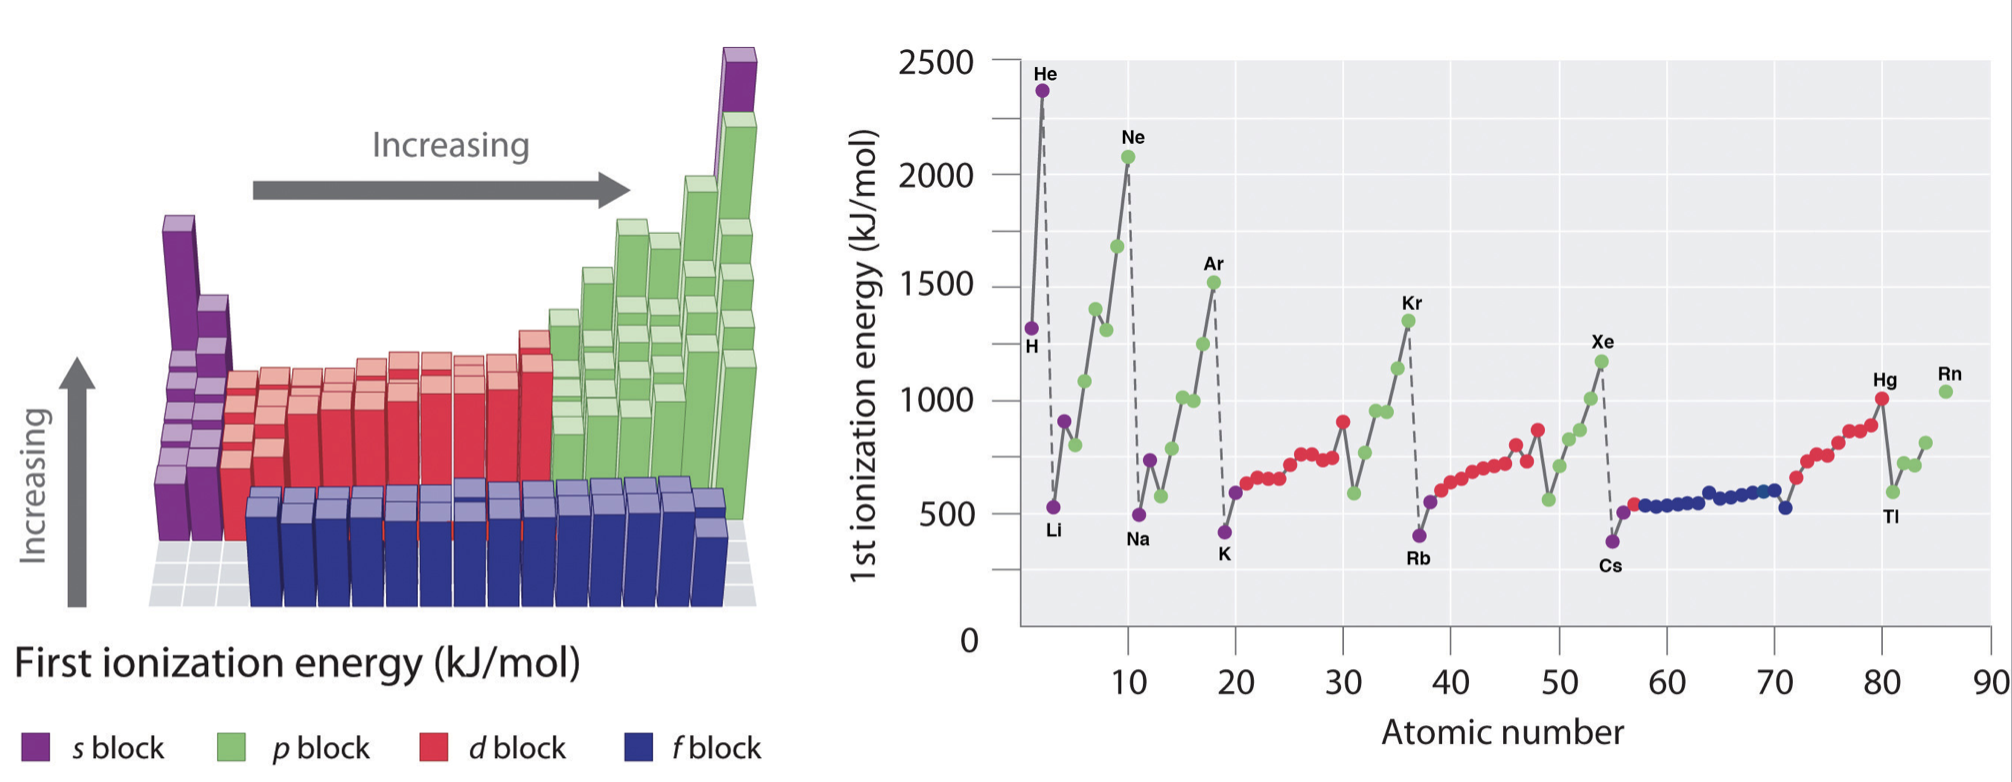
Figure \(\PageIndex{1}\): Graph showing the First Ionization Energy of the Elements. Left: ionization energies are mapped onto the periodic table, where the magnitude of ionization energy is depicted as a bar graph. Right: the first ionization energy is plotted against atomic number. In both panels the elements of the s-block are shown in purple, p-block are shown in green, d-block are shown in red, and f-block are shown in blue.
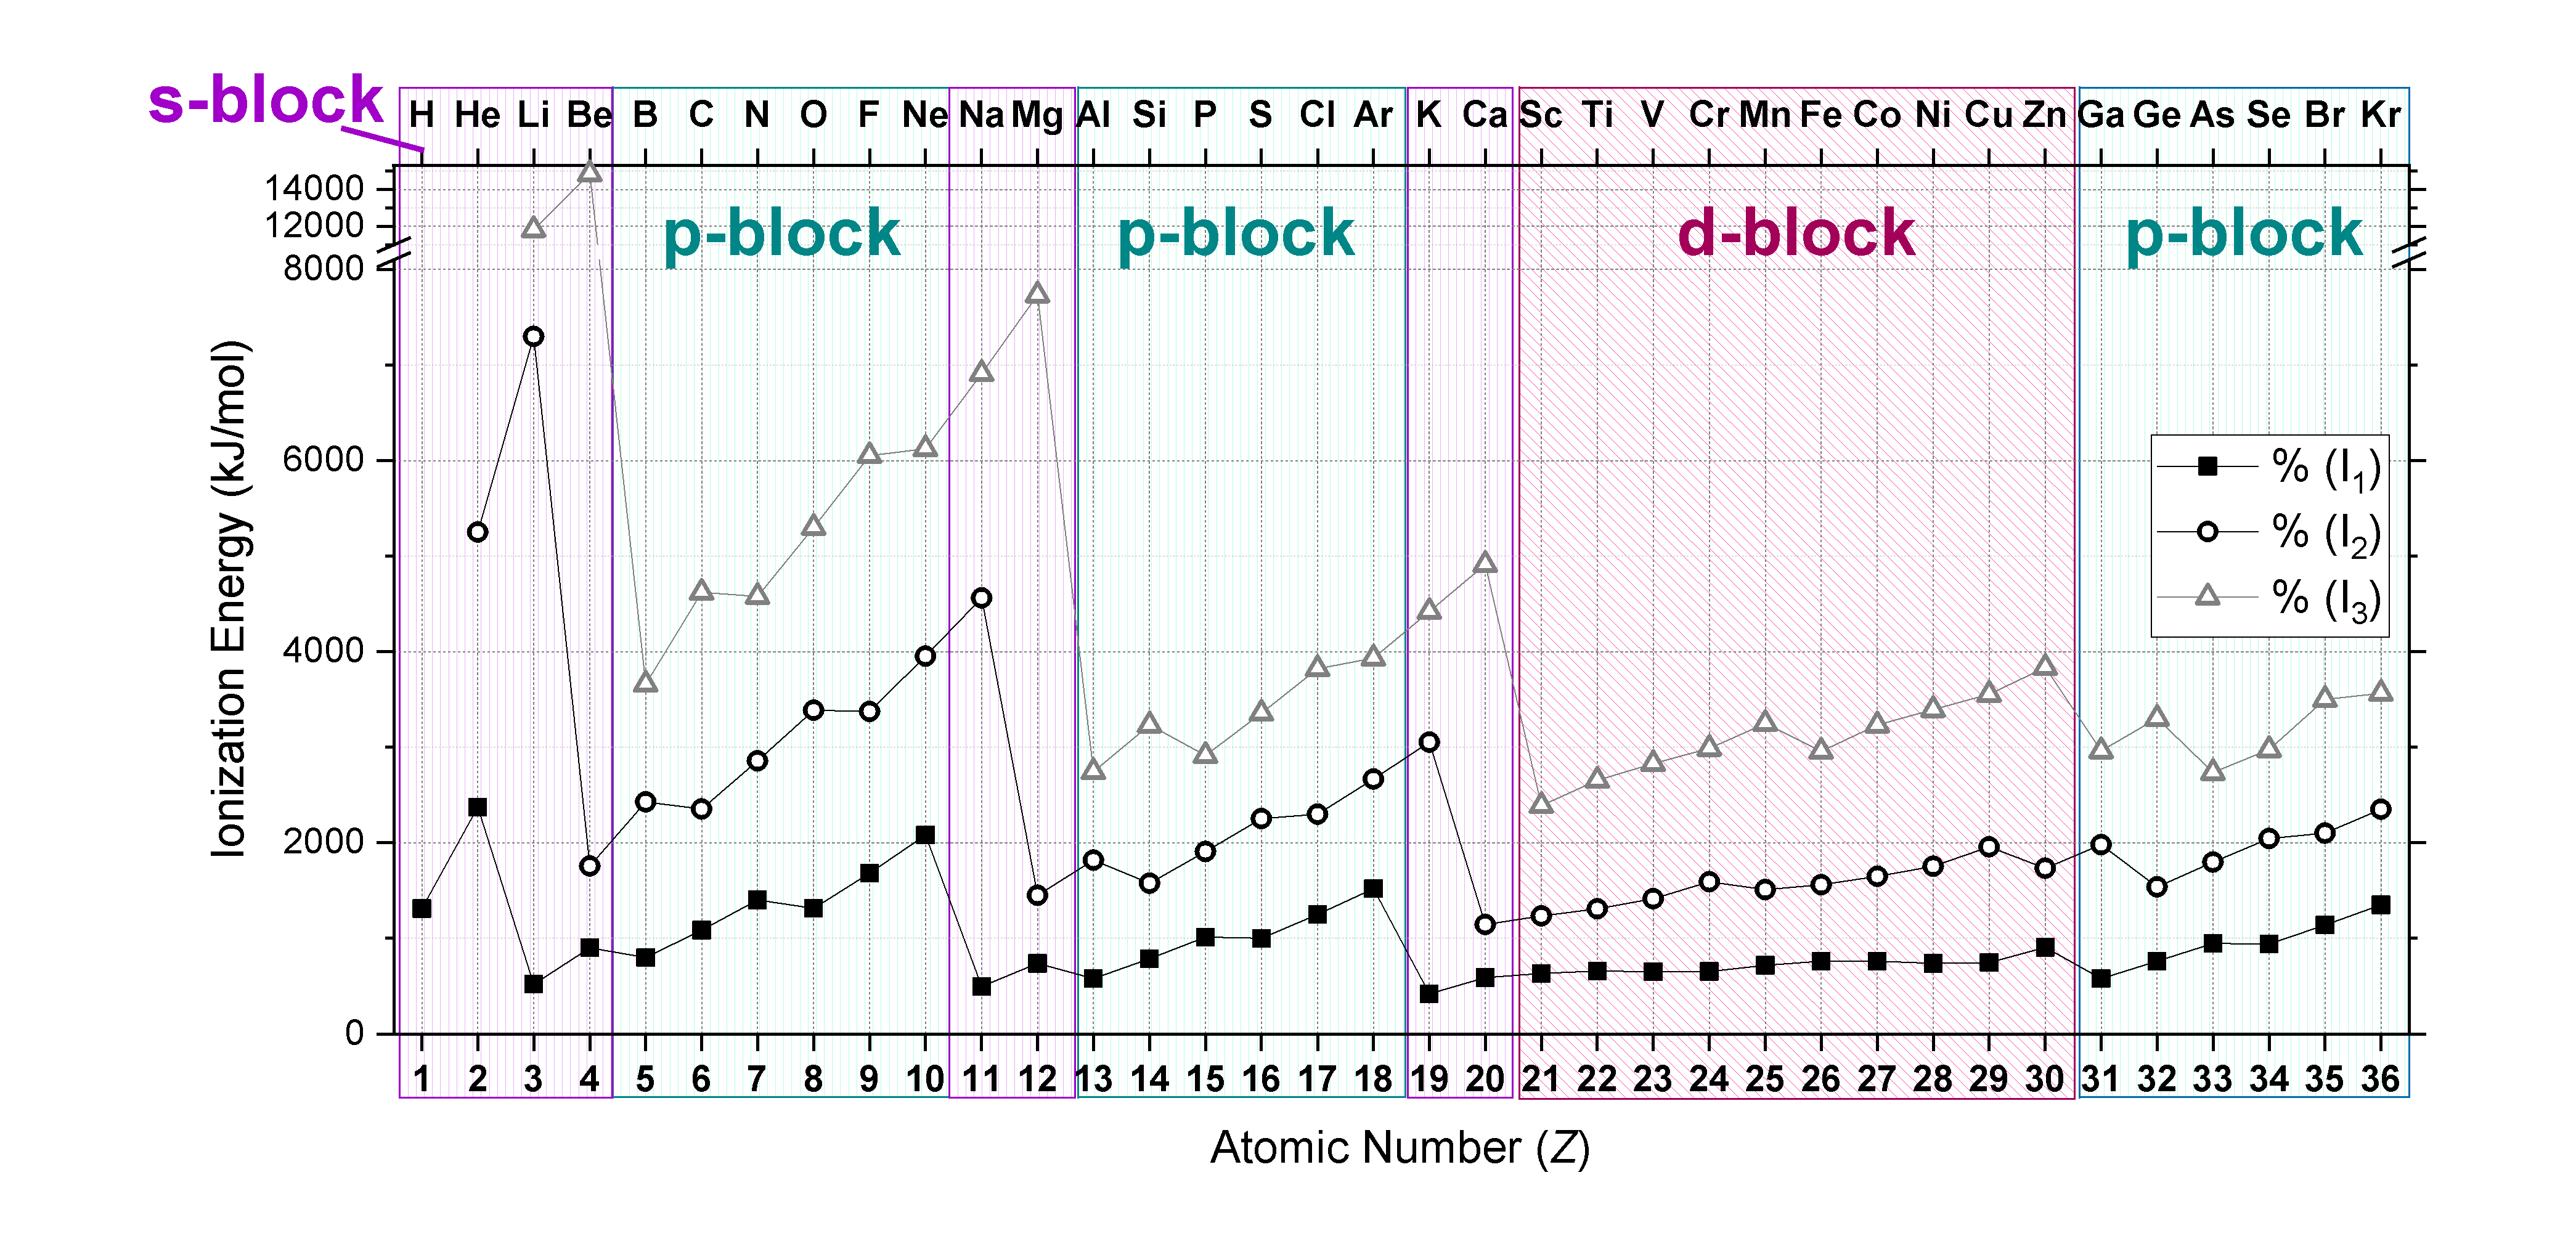
Plots of the \(IE_1, IE_2,\) and \(IE_3\) of elements from hydrogen to krypton (first four periods) are shown in Figure \(\PageIndex{2}\). Notice that \(IE_3>IE_2>IE_1\). Also notice that trends mentioned above for \(IE_1\) hold true for subsequent ionizations when electron configurations are considered!
Electron Affinity
According to IUPAC, there are two different, but equivalent, definitions of electron affinity (EA).6
EA defined as removal of an electron
Electron affinity can be defined as the energy required when an electron is removed from a gaseous anion. The reaction as shown in equation \(\ref{EA1}\) is endothermic (positive \(\Delta U\)) for elements except noble gases and alkaline earth metals. Under this definition, the more positive the EA value, the higher an atom's affinity for electrons.
\[A^{-}_{(g)} \longrightarrow A_{(g)} + e^- \hspace{1cm} EA = \Delta U \label{EA1}\]
The reaction shown in equation \(\ref{EA1}\) is similar those that define ionization energy. For this reason, the EA is also described as the zeroth ionization energy.
EA defined as addition of an electron
An alternate and more common definition is the microscopic reverse of equation \(\ref{EA1}\). This more common definition states that electron affinity is the energy released when an electron is added to a gaseous atom, as shown in equation \(\ref{EA2}\). The reaction as shown in equation \(\ref{EA2}\) is exothermic (negative \(\Delta U\)) for elements except noble gases and alkaline earth metals. The more negative this EA value, the higher an atom's affinity for electrons.
\[A_{(g)} + e^- \longrightarrow A^{-}_{(g)} \hspace{1cm} EA = \Delta U \label{EA2}\]
Conceptually, this second definition is quite similar to the concept of electronegativity; but unlike electronegativity, EA is a well-defined quantitative measurement.
Trends in Electron Affinity
For this discussion, we will use the first definition of EA: a more positive (larger) value means that the EA is higher (meaning stronger affinity toward an electron).
Across a period: Similar to ionization energy, EA generally increases across a row of the periodic table; this observation is consistent with the increase in effective nuclear charge (Z*) from left to right across a period. However, there are variations across a period that are similar to variations in ionization energy and that can be explained by shielding, penetration, and electron configuration.
Down a group: Like the case of ionization energy trends, EA does not consistently decrease going down a column of the periodic table despite the fact that \(Z^*\) increases down a group.
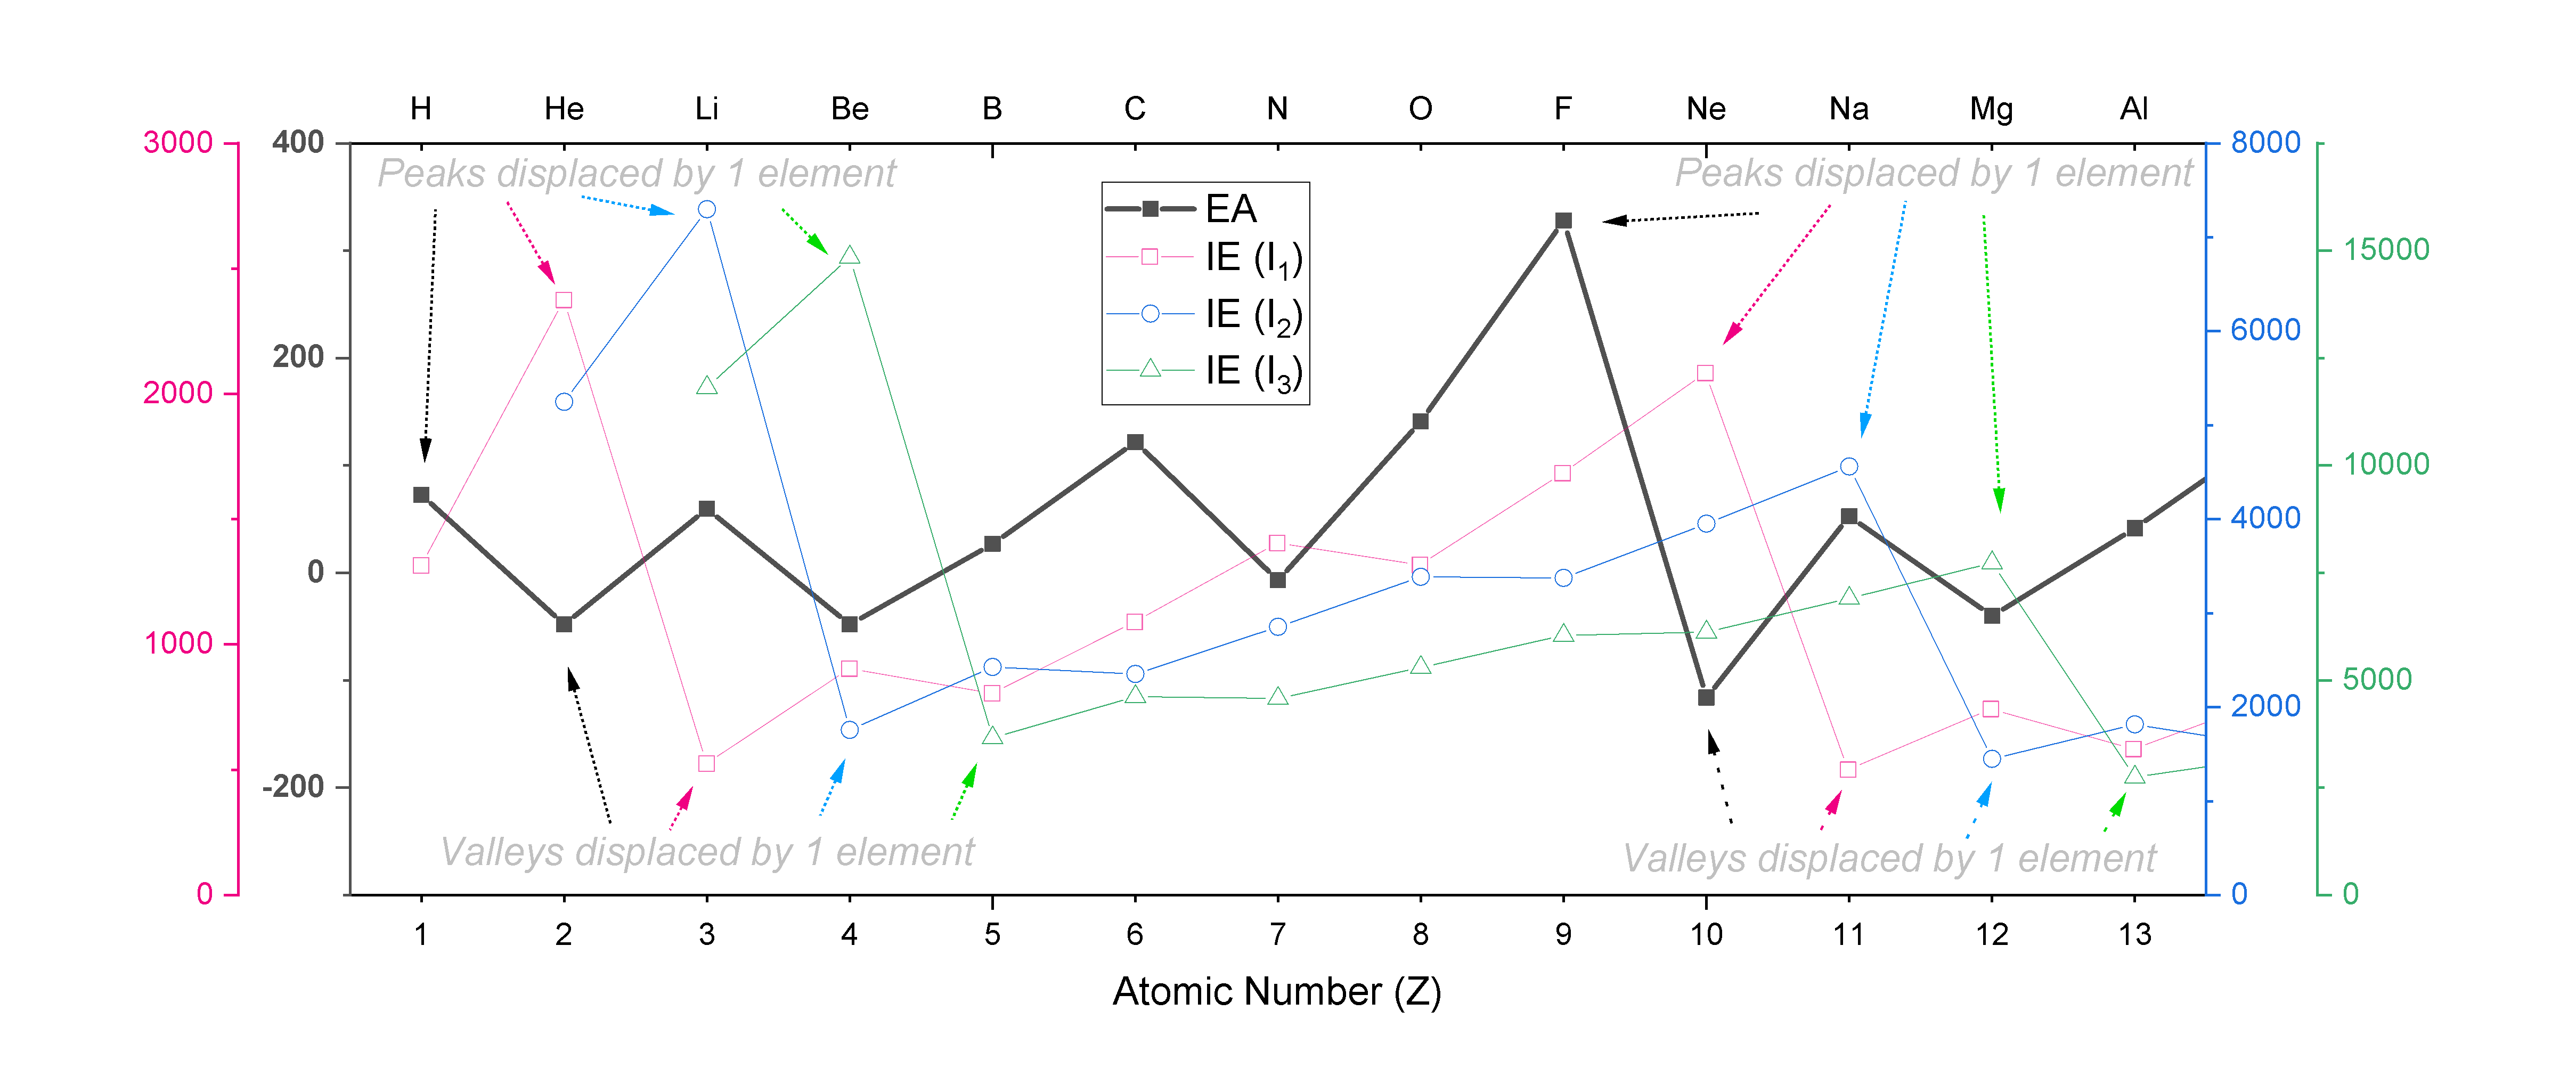
The trend in EA follows a similar zig-zag pattern as the one seen with ionization energies, except that it is displaced by one unit from the trend in \(IE_1\), two units from \(IE_2\), and so on. For example, EA peaks at F, while \(IE_1\) peaks at Ne, \(IE_2\) peaks at Na, and \(IE_3\) peaks at Mg. A plot of EA for the first 13 elements is shown overlaid on plots of \(IE_1, IE_2\) and \(IE_3\) in Figure \(\PageIndex{3}\)., where the shifts in the peaks and valleys within each zig-zag trend are indicated.
Atomic and Ionic Radii
There are several methods that can be used to determine radii of atoms and ions:
- Nonpolar atomic radii: The radius of an atom is derived from the bond lengths within nonpolar molecules; one-half the distance between the nuclei of two atoms within a covalent bond.
- van der Waals radius: The radius of an atom is determined by collision with other atoms.
- Crystal Radii: The atomic or ionic radius is determined using electron density maps from X-ray data.
The measurement of atomic or ionic size will depend on a number of factors, including the covalent character of bonding in any particular molecule, coordination number, physical state (liquid, solid, gas), the identity of nearby atoms/ions, variation in crystal structure, and distortions within regular crystal structures. You should keep in mind that the size of an atom or ion is a "fuzzy" measure, and the radius under a different set of conditions will probably change slightly.
Regardless, measured atomic and ionic radii reveal obvious trends across the periodic table and between atoms and ions. The relative atomic sizes shown in Figure \(\PageIndex{4}\) were derived from crystallographic data.9
Trends in Atomic Radius
Atomic size generally decreases gradually from left to right across a period of elements. As nuclear charge (Z) increases, we expect the effective nuclear charge (Z*) of the valence electrons to also increase. Increasing Z pulls electrons closer to the nucleus. However, with each additional unit of Z, there is also an additional electron. The change in size is a balance of a compression caused by increasing Z and an expansion in the number of electrons. As a result, the atomic radius decreases gradually across a period.
Atomic size generally increases going down a group. As valence electrons occupying higher level shells due to the increasing quantum number (n), size increases despite the fact that Z and Z* are increasing going down the group.
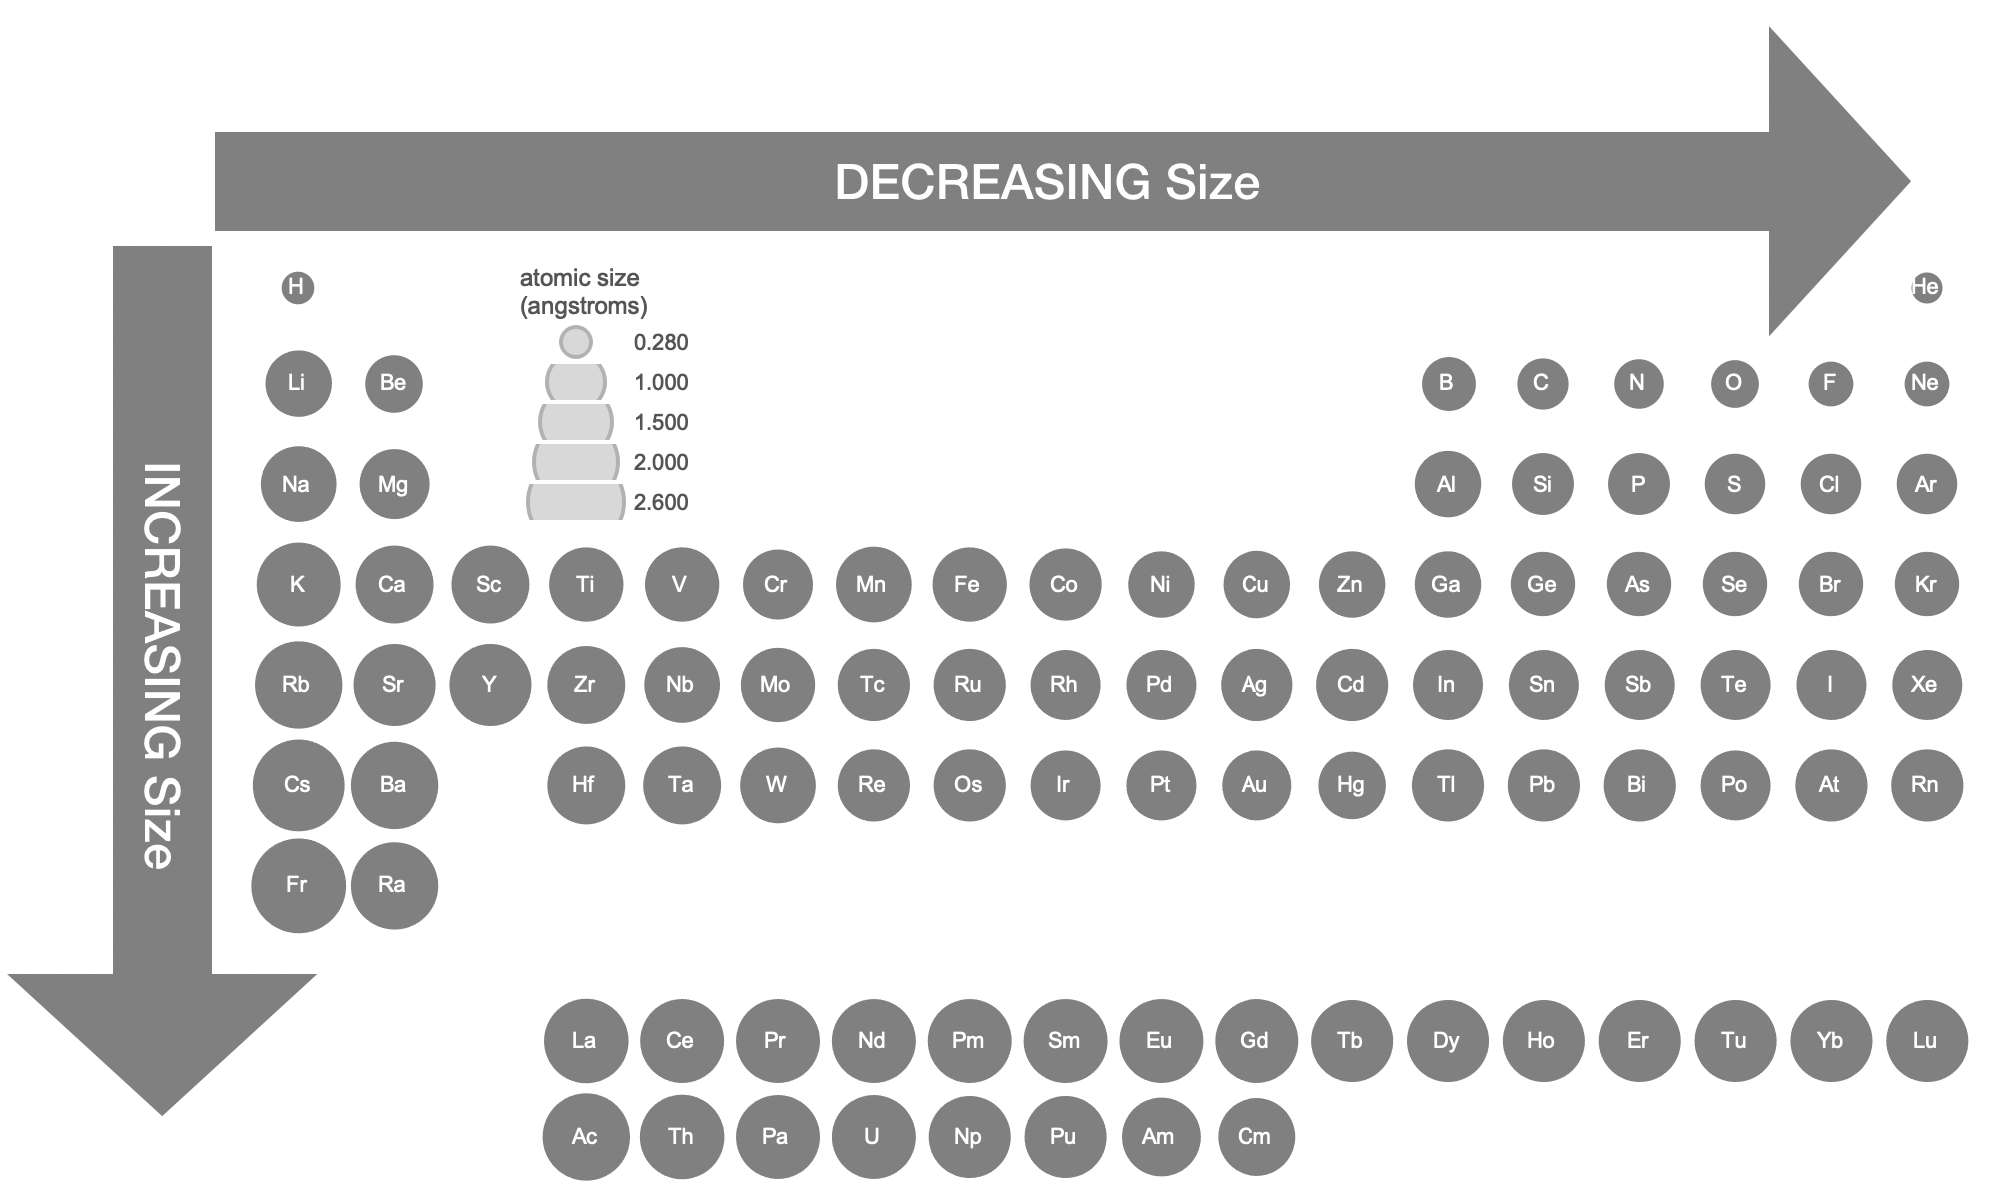
Figure \(\PageIndex{4}\). Atomic Radii Calculated from Crystalographic Data. Data from Cordero, Beatriz, Veronica Gomez, Ana E. Platero-Prats, Marc Reves, Jorge Echeverria, Eduard Cremades, Flavia Barragan, and Santiago Alvarez. “Covalent Radii Revisited.” Dalton Transactions, no. 21 (2008): 2832–38. doi:10.1039/b801115j.
Trends in Ionic Radius
Trends in ionic radius follow general trends in atomic radius for ions of the same charge. Ionic radius varies with charge of the ion (and number of electrons) and the electron configuration (e.g. high spin or low spin).
Cations
Compared to their atoms, cations have the same Z but fewer electrons. Removal of electrons from an atom to form a cation results in a significant increase in effective nuclear charge, resulting in all other electrons being more strongly attracted to the nucleus, and having a lower energy level. The result is a contraction in size from the atom to cation. Figure \(\PageIndex{5}\) visually illustrates the relative size of atoms and some cations of the first four periods; the data is available in tabular format in Figure \(\PageIndex{6}\).
Anions
Compared to their atoms, anions have the same Z but more electrons. Addition of electrons to an atom to form an anion results in a decrease in effective nuclear charge, which corresponds to a decrease in attractive force between the nucleus and electrons. Lower attractive force leads to expansion, where the size of the atom becomes larger in the formation of an anion. Figure \(\PageIndex{5}\) visually illustrates the relative size of atoms and some anions of the first four periods, while the data is available in tabular format in Figure \(\PageIndex{6}\).
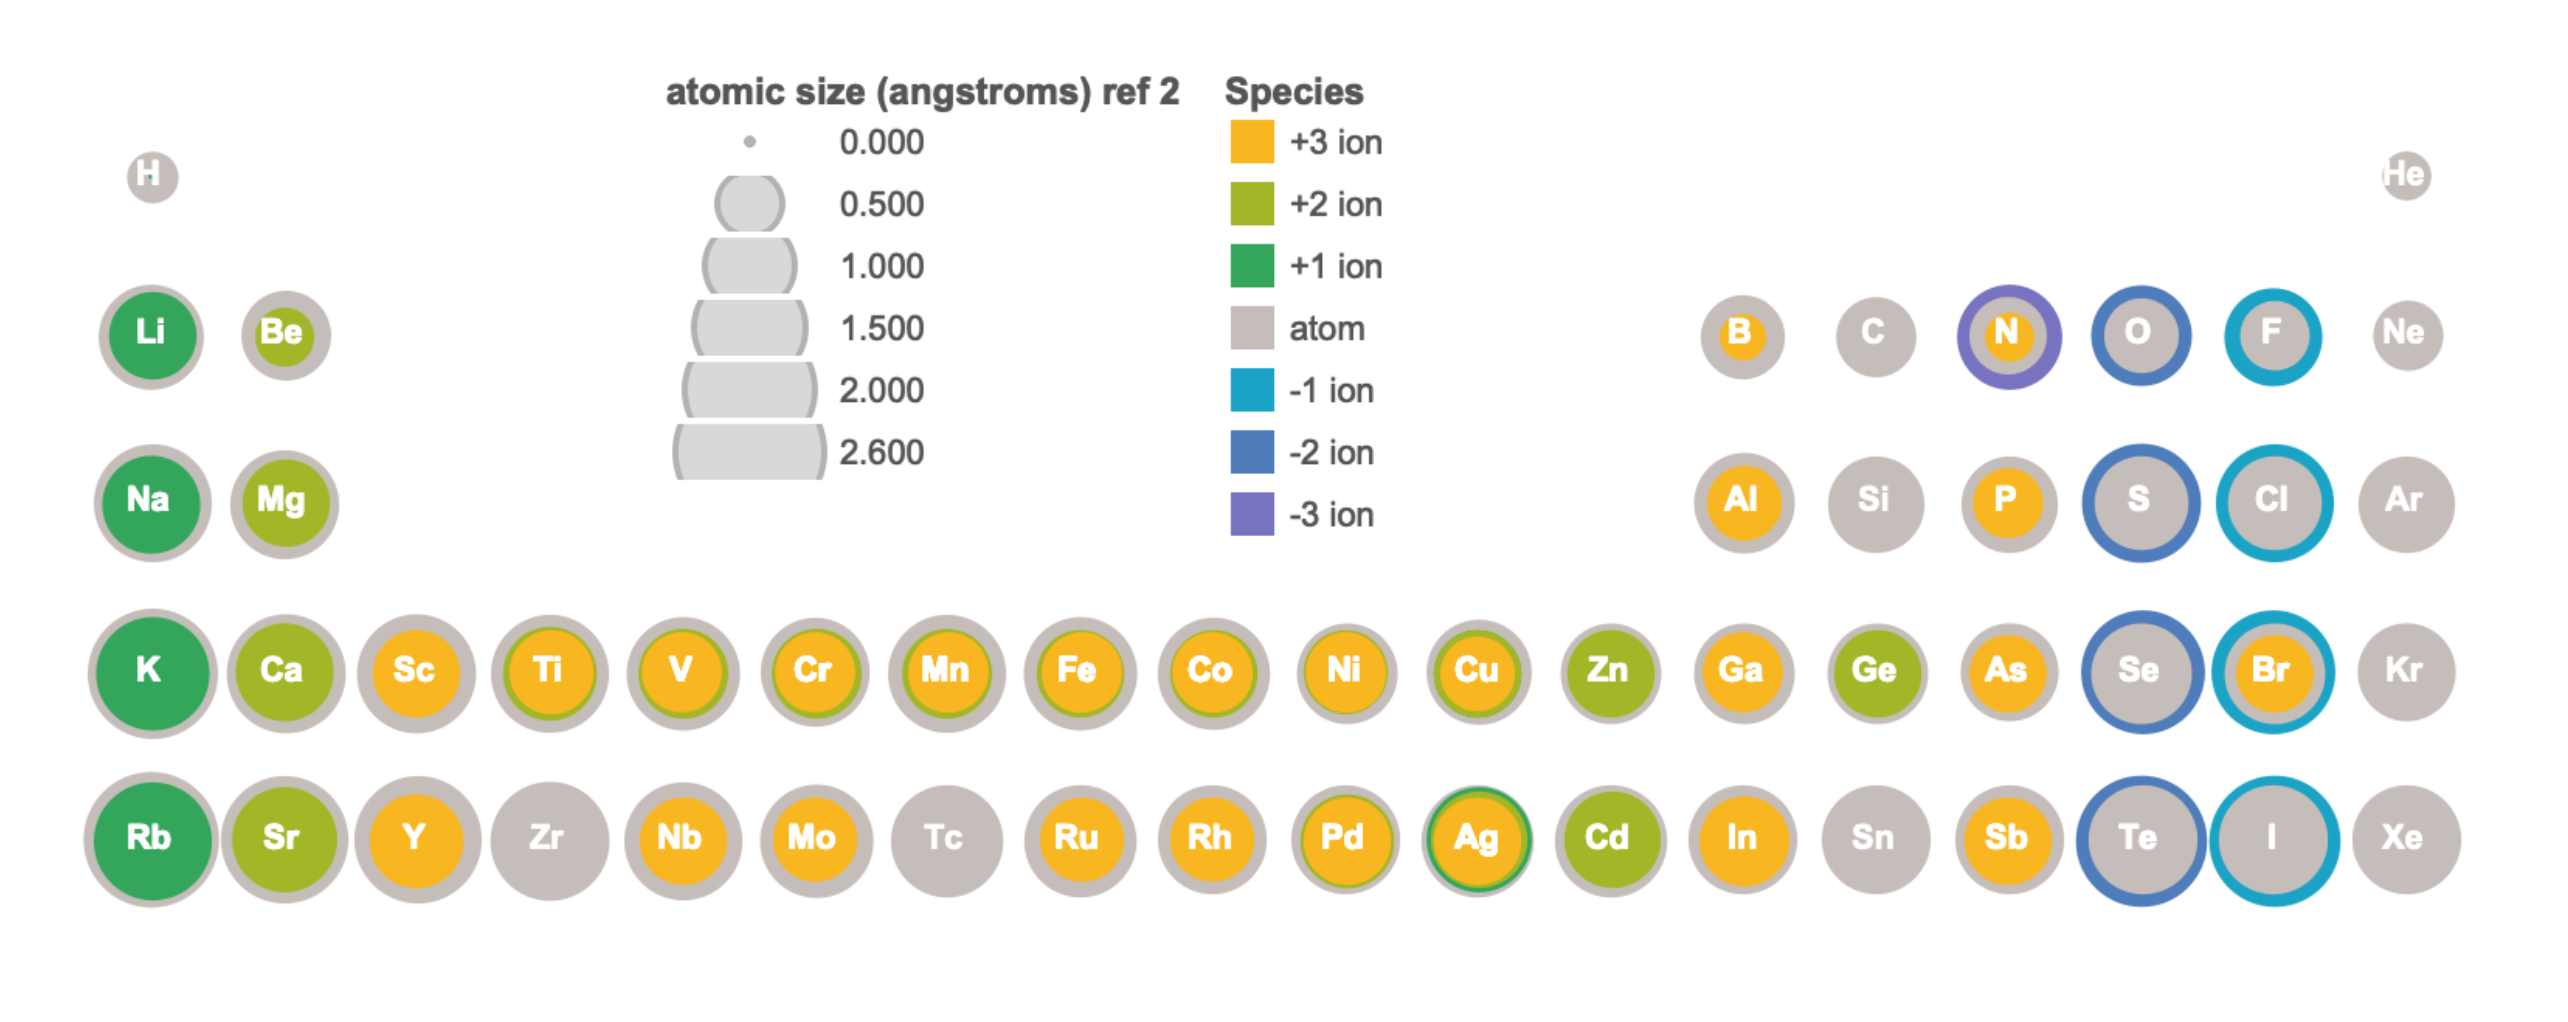
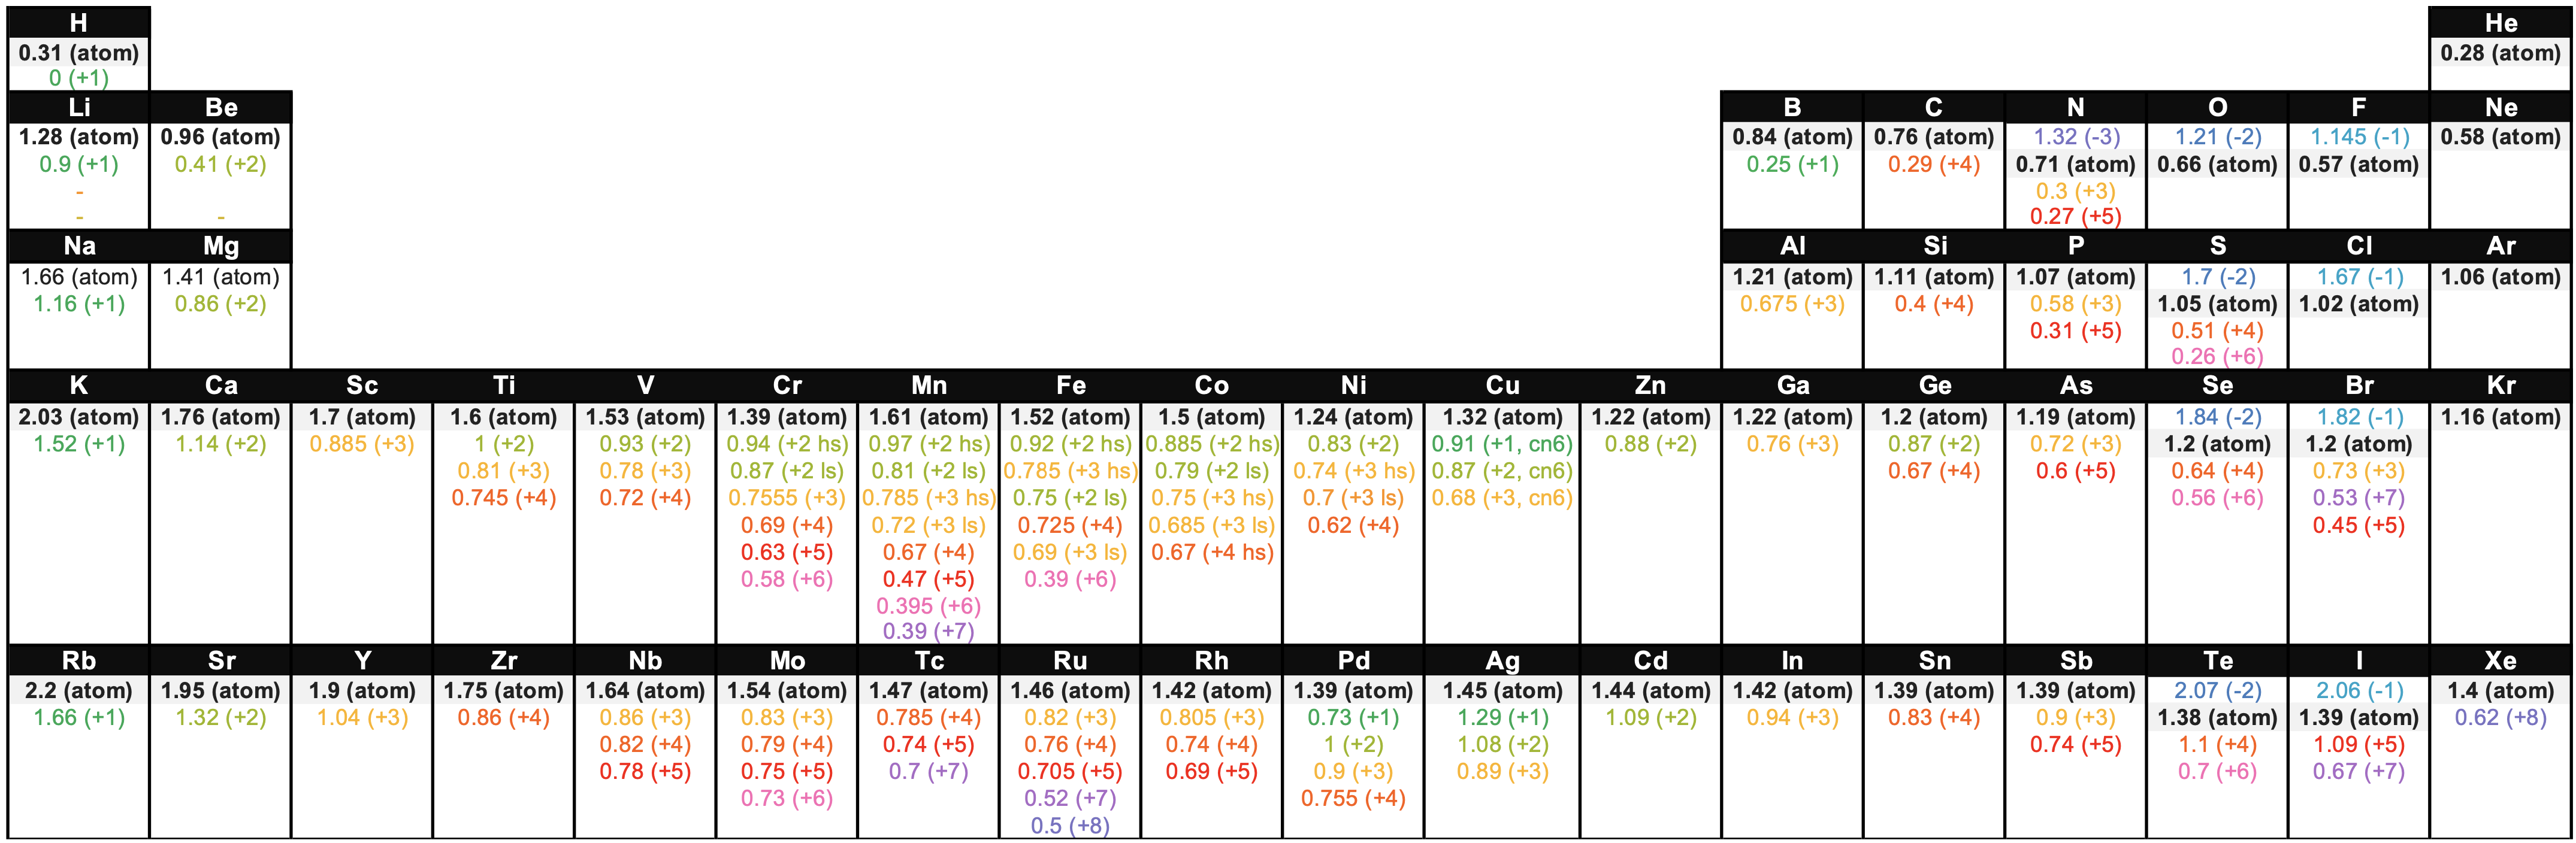 Figure \(\PageIndex{6}\). This figure shows radii (in Angstroms) of atoms and ions of the first four periods of the periodic table. Radii from each element are listed from largest to smallest, ionic charge indicated in parentheses (); hs = high spin, ls = low spin, cn6 = coordination number is 6. Data from sources 9-11.
Contributors and Attributions
- Swetha Ramireddy (UCD), Bingyao Zheng (UCD), Emily Nguyen (UCD)
Curated or created by Kathryn Haas
References
- Russo, Steve, and Mike Silver. Introductory Chemistry. San Francisco: Pearson, 2007.
- Petrucci, Ralph H, et al. General Chemistry: Principles and Modern Applications. 9th Ed. New Jersey: Pearson, 2007.
- Atkins, Peter et. al, Physical Chemistry, 7th Edition, 2002, W.H Freeman and Company, New York, pg. 390.
- Alberty, Robert A. et. al, Physical Chemistry, 3rd Edition, 2001, John Wiley & Sons, Inc, pg. 380.
- Kots, John C. et. al, Chemistry & Chemical Reactivity, 5th Edition, 2003, Thomson Learning Inc, pg. 305-309.
- IUPAC. Compendium of Chemical Terminology, 2nd ed. (the "Gold Book"). Compiled by A. D. McNaught and A. Wilkinson. Blackwell Scientific Publications, Oxford (1997). Online version (2019-) created by S. J. Chalk. ISBN 0-9678550-9-8. doi.org/10.1351/goldbook.
- Electron Affinity (data page), Wikipedia. en.Wikipedia.org/wiki/Electron_affinity_(data_page) Accessed 12/3/19.
- Cordero, Beatriz, Veronica Gomez, Ana E. Platero-Prats, Marc Reves, Jorge Echeverria, Eduard Cremades, Flavia Barragan, and Santiago Alvarez. “Covalent Radii Revisited.” Dalton Transactions, no. 21 (2008): 2832–38. doi:10.1039/b801115j.
- R. D. Shannon (1976). "Revised effective ionic radii and systematic studies of interatomic distances in halides and chalcogenides". Acta Crystallogr A. 32 (5): 751–767. Bibcode:1976AcCrA..32..751S. doi:10.1107/S0567739476001551.
- Atomic Radius, Wikipedia. https://en.Wikipedia.org/wiki/Atomic_radius
- Ionic Radius, Wikipedia. https://en.Wikipedia.org/wiki/Ionic_radius