Chemistry LibreTexts

5.5: Factos Affecting Enzyme Activity

  • Page ID
    279146
  • \( \newcommand{\vecs}[1]{\overset { \scriptstyle \rightharpoonup} {\mathbf{#1}} } \)

    \( \newcommand{\vecd}[1]{\overset{-\!-\!\rightharpoonup}{\vphantom{a}\smash {#1}}} \)

    \( \newcommand{\id}{\mathrm{id}}\) \( \newcommand{\Span}{\mathrm{span}}\)

    ( \newcommand{\kernel}{\mathrm{null}\,}\) \( \newcommand{\range}{\mathrm{range}\,}\)

    \( \newcommand{\RealPart}{\mathrm{Re}}\) \( \newcommand{\ImaginaryPart}{\mathrm{Im}}\)

    \( \newcommand{\Argument}{\mathrm{Arg}}\) \( \newcommand{\norm}[1]{\| #1 \|}\)

    \( \newcommand{\inner}[2]{\langle #1, #2 \rangle}\)

    \( \newcommand{\Span}{\mathrm{span}}\)

    \( \newcommand{\id}{\mathrm{id}}\)

    \( \newcommand{\Span}{\mathrm{span}}\)

    \( \newcommand{\kernel}{\mathrm{null}\,}\)

    \( \newcommand{\range}{\mathrm{range}\,}\)

    \( \newcommand{\RealPart}{\mathrm{Re}}\)

    \( \newcommand{\ImaginaryPart}{\mathrm{Im}}\)

    \( \newcommand{\Argument}{\mathrm{Arg}}\)

    \( \newcommand{\norm}[1]{\| #1 \|}\)

    \( \newcommand{\inner}[2]{\langle #1, #2 \rangle}\)

    \( \newcommand{\Span}{\mathrm{span}}\) \( \newcommand{\AA}{\unicode[.8,0]{x212B}}\)

    \( \newcommand{\vectorA}[1]{\vec{#1}}      % arrow\)

    \( \newcommand{\vectorAt}[1]{\vec{\text{#1}}}      % arrow\)

    \( \newcommand{\vectorB}[1]{\overset { \scriptstyle \rightharpoonup} {\mathbf{#1}} } \)

    \( \newcommand{\vectorC}[1]{\textbf{#1}} \)

    \( \newcommand{\vectorD}[1]{\overrightarrow{#1}} \)

    \( \newcommand{\vectorDt}[1]{\overrightarrow{\text{#1}}} \)

    \( \newcommand{\vectE}[1]{\overset{-\!-\!\rightharpoonup}{\vphantom{a}\smash{\mathbf {#1}}}} \)

    \( \newcommand{\vecs}[1]{\overset { \scriptstyle \rightharpoonup} {\mathbf{#1}} } \)

    \( \newcommand{\vecd}[1]{\overset{-\!-\!\rightharpoonup}{\vphantom{a}\smash {#1}}} \)

    \(\newcommand{\avec}{\mathbf a}\) \(\newcommand{\bvec}{\mathbf b}\) \(\newcommand{\cvec}{\mathbf c}\) \(\newcommand{\dvec}{\mathbf d}\) \(\newcommand{\dtil}{\widetilde{\mathbf d}}\) \(\newcommand{\evec}{\mathbf e}\) \(\newcommand{\fvec}{\mathbf f}\) \(\newcommand{\nvec}{\mathbf n}\) \(\newcommand{\pvec}{\mathbf p}\) \(\newcommand{\qvec}{\mathbf q}\) \(\newcommand{\svec}{\mathbf s}\) \(\newcommand{\tvec}{\mathbf t}\) \(\newcommand{\uvec}{\mathbf u}\) \(\newcommand{\vvec}{\mathbf v}\) \(\newcommand{\wvec}{\mathbf w}\) \(\newcommand{\xvec}{\mathbf x}\) \(\newcommand{\yvec}{\mathbf y}\) \(\newcommand{\zvec}{\mathbf z}\) \(\newcommand{\rvec}{\mathbf r}\) \(\newcommand{\mvec}{\mathbf m}\) \(\newcommand{\zerovec}{\mathbf 0}\) \(\newcommand{\onevec}{\mathbf 1}\) \(\newcommand{\real}{\mathbb R}\) \(\newcommand{\twovec}[2]{\left[\begin{array}{r}#1 \\ #2 \end{array}\right]}\) \(\newcommand{\ctwovec}[2]{\left[\begin{array}{c}#1 \\ #2 \end{array}\right]}\) \(\newcommand{\threevec}[3]{\left[\begin{array}{r}#1 \\ #2 \\ #3 \end{array}\right]}\) \(\newcommand{\cthreevec}[3]{\left[\begin{array}{c}#1 \\ #2 \\ #3 \end{array}\right]}\) \(\newcommand{\fourvec}[4]{\left[\begin{array}{r}#1 \\ #2 \\ #3 \\ #4 \end{array}\right]}\) \(\newcommand{\cfourvec}[4]{\left[\begin{array}{c}#1 \\ #2 \\ #3 \\ #4 \end{array}\right]}\) \(\newcommand{\fivevec}[5]{\left[\begin{array}{r}#1 \\ #2 \\ #3 \\ #4 \\ #5 \\ \end{array}\right]}\) \(\newcommand{\cfivevec}[5]{\left[\begin{array}{c}#1 \\ #2 \\ #3 \\ #4 \\ #5 \\ \end{array}\right]}\) \(\newcommand{\mattwo}[4]{\left[\begin{array}{rr}#1 \amp #2 \\ #3 \amp #4 \\ \end{array}\right]}\) \(\newcommand{\laspan}[1]{\text{Span}\{#1\}}\) \(\newcommand{\bcal}{\cal B}\) \(\newcommand{\ccal}{\cal C}\) \(\newcommand{\scal}{\cal S}\) \(\newcommand{\wcal}{\cal W}\) \(\newcommand{\ecal}{\cal E}\) \(\newcommand{\coords}[2]{\left\{#1\right\}_{#2}}\) \(\newcommand{\gray}[1]{\color{gray}{#1}}\) \(\newcommand{\lgray}[1]{\color{lightgray}{#1}}\) \(\newcommand{\rank}{\operatorname{rank}}\) \(\newcommand{\row}{\text{Row}}\) \(\newcommand{\col}{\text{Col}}\) \(\renewcommand{\row}{\text{Row}}\) \(\newcommand{\nul}{\text{Nul}}\) \(\newcommand{\var}{\text{Var}}\) \(\newcommand{\corr}{\text{corr}}\) \(\newcommand{\len}[1]{\left|#1\right|}\) \(\newcommand{\bbar}{\overline{\bvec}}\) \(\newcommand{\bhat}{\widehat{\bvec}}\) \(\newcommand{\bperp}{\bvec^\perp}\) \(\newcommand{\xhat}{\widehat{\xvec}}\) \(\newcommand{\vhat}{\widehat{\vvec}}\) \(\newcommand{\uhat}{\widehat{\uvec}}\) \(\newcommand{\what}{\widehat{\wvec}}\) \(\newcommand{\Sighat}{\widehat{\Sigma}}\) \(\newcommand{\lt}{<}\) \(\newcommand{\gt}{>}\) \(\newcommand{\amp}{&}\) \(\definecolor{fillinmathshade}{gray}{0.9}\)
    Learning Objectives
    • To describe how pH, temperature, and the concentration of an enzyme and its substrate influence enzyme activity.

    The single most important property of enzymes is the ability to increase the rates of reactions occurring in living organisms, a property known as catalytic activity. Because most enzymes are proteins, their activity is affected by factors that disrupt protein structure, as well as by factors that affect catalysts in general. Factors that disrupt protein structure include temperature and pH; factors that affect catalysts in general include reactant or substrate concentration and catalyst or enzyme concentration. The activity of an enzyme can be measured by monitoring either the rate at which a substrate disappears or the rate at which a product forms.

    Concentration of Substrate

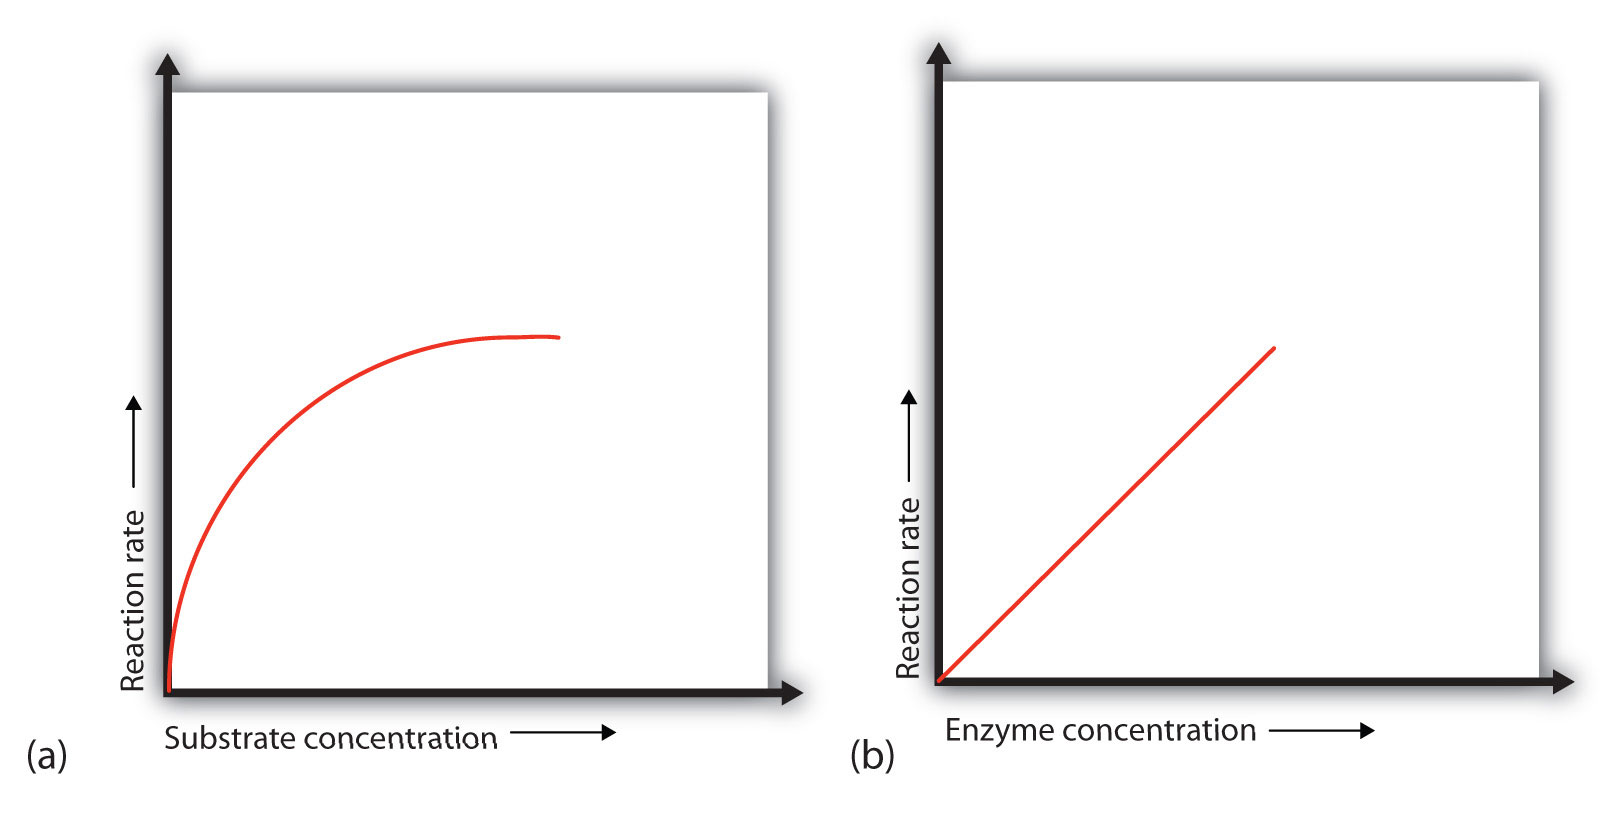
    In the presence of a given amount of enzyme, the rate of an enzymatic reaction increases as the substrate concentration increases until a limiting rate is reached, after which further increase in the substrate concentration produces no significant change in the reaction rate (part (a) of Figure \(\PageIndex{1}\)). At this point, so much substrate is present that essentially all of the enzyme active sites have substrate bound to them. In other words, the enzyme molecules are saturated with substrate. The excess substrate molecules cannot react until the substrate already bound to the enzymes has reacted and been released (or been released without reacting).

    Figure \(\PageIndex{1}\): Concentration versus Reaction Rate. (a) This graph shows the effect of substrate concentration on the rate of a reaction that is catalyzed by a fixed amount of enzyme. (b) This graph shows the effect of enzyme concentration on the reaction rate at a constant level of substrate.

    Let’s consider an analogy. Ten taxis (enzyme molecules) are waiting at a taxi stand to take people (substrate) on a 10-minute trip to a concert hall, one passenger at a time. If only 5 people are present at the stand, the rate of their arrival at the concert hall is 5 people in 10 minutes. If the number of people at the stand is increased to 10, the rate increases to 10 arrivals in 10 minutes. With 20 people at the stand, the rate would still be 10 arrivals in 10 minutes. The taxis have been “saturated.” If the taxis could carry 2 or 3 passengers each, the same principle would apply. The rate would simply be higher (20 or 30 people in 10 minutes) before it leveled off.

    Concentration of Enzyme

    When the concentration of the enzyme is significantly lower than the concentration of the substrate (as when the number of taxis is far lower than the number of waiting passengers), the rate of an enzyme-catalyzed reaction is directly dependent on the enzyme concentration (part (b) of Figure \(\PageIndex{1}\)). This is true for any catalyst; the reaction rate increases as the concentration of the catalyst is increased.

    Temperature

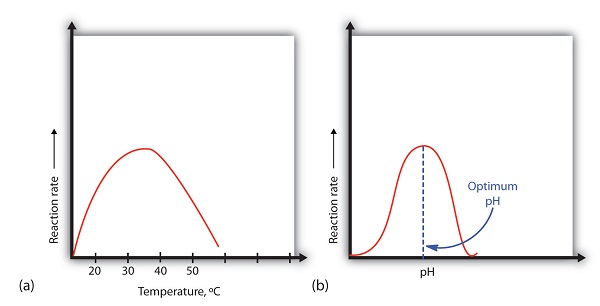
    A general rule of thumb for most chemical reactions is that a temperature rise of 10°C approximately doubles the reaction rate. To some extent, this rule holds for all enzymatic reactions. After a certain point, however, an increase in temperature causes a decrease in the reaction rate, due to denaturation of the protein structure and disruption of the active site (part (a) of Figure \(\PageIndex{2}\)). For many proteins, denaturation occurs between 45°C and 55°C. Furthermore, even though an enzyme may appear to have a maximum reaction rate between 40°C and 50°C, most biochemical reactions are carried out at lower temperatures because enzymes are not stable at these higher temperatures and will denature after a few minutes.

    Figure \(\PageIndex{2}\): Temperature and pH versus Concentration. (a) This graph depicts the effect of temperature on the rate of a reaction that is catalyzed by a fixed amount of enzyme. (b) This graph depicts the effect of pH on the rate of a reaction that is catalyzed by a fixed amount of enzyme.

    At 0°C and 100°C, the rate of enzyme-catalyzed reactions is nearly zero. This fact has several practical applications. We sterilize objects by placing them in boiling water, which denatures the enzymes of any bacteria that may be in or on them. We preserve our food by refrigerating or freezing it, which slows enzyme activity. When animals go into hibernation in winter, their body temperature drops, decreasing the rates of their metabolic processes to levels that can be maintained by the amount of energy stored in the fat reserves in the animals’ tissues.

    Hydrogen Ion Concentration (pH)

    Because most enzymes are proteins, they are sensitive to changes in the hydrogen ion concentration or pH. Enzymes may be denatured by extreme levels of hydrogen ions (whether high or low); any change in pH, even a small one, alters the degree of ionization of an enzyme’s acidic and basic side groups and the substrate components as well. Ionizable side groups located in the active site must have a certain charge for the enzyme to bind its substrate. Neutralization of even one of these charges alters an enzyme’s catalytic activity.

    An enzyme exhibits maximum activity over the narrow pH range in which a molecule exists in its properly charged form. The median value of this pH range is called the optimum pH of the enzyme (part (b) of Figure \(\PageIndex{2}\)). With the notable exception of gastric juice (the fluids secreted in the stomach), most body fluids have pH values between 6 and 8. Not surprisingly, most enzymes exhibit optimal activity in this pH range. However, a few enzymes have optimum pH values outside this range. For example, the optimum pH for pepsin, an enzyme that is active in the stomach, is 2.0.

    Summary

    Initially, an increase in substrate concentration leads to an increase in the rate of an enzyme-catalyzed reaction. As the enzyme molecules become saturated with substrate, this increase in reaction rate levels off. The rate of an enzyme-catalyzed reaction increases with an increase in the concentration of an enzyme. At low temperatures, an increase in temperature increases the rate of an enzyme-catalyzed reaction. At higher temperatures, the protein is denatured, and the rate of the reaction dramatically decreases. An enzyme has an optimum pH range in which it exhibits maximum activity.


    5.5: Factos Affecting Enzyme Activity is shared under a CC BY-NC-SA 4.0 license and was authored, remixed, and/or curated by LibreTexts.

    • Was this article helpful?