
Lab 7: Electrospray Mass Spectrometry
- Page ID
- 204123
\( \newcommand{\vecs}[1]{\overset { \scriptstyle \rightharpoonup} {\mathbf{#1}} } \)
\( \newcommand{\vecd}[1]{\overset{-\!-\!\rightharpoonup}{\vphantom{a}\smash {#1}}} \)
\( \newcommand{\dsum}{\displaystyle\sum\limits} \)
\( \newcommand{\dint}{\displaystyle\int\limits} \)
\( \newcommand{\dlim}{\displaystyle\lim\limits} \)
\( \newcommand{\id}{\mathrm{id}}\) \( \newcommand{\Span}{\mathrm{span}}\)
( \newcommand{\kernel}{\mathrm{null}\,}\) \( \newcommand{\range}{\mathrm{range}\,}\)
\( \newcommand{\RealPart}{\mathrm{Re}}\) \( \newcommand{\ImaginaryPart}{\mathrm{Im}}\)
\( \newcommand{\Argument}{\mathrm{Arg}}\) \( \newcommand{\norm}[1]{\| #1 \|}\)
\( \newcommand{\inner}[2]{\langle #1, #2 \rangle}\)
\( \newcommand{\Span}{\mathrm{span}}\)
\( \newcommand{\id}{\mathrm{id}}\)
\( \newcommand{\Span}{\mathrm{span}}\)
\( \newcommand{\kernel}{\mathrm{null}\,}\)
\( \newcommand{\range}{\mathrm{range}\,}\)
\( \newcommand{\RealPart}{\mathrm{Re}}\)
\( \newcommand{\ImaginaryPart}{\mathrm{Im}}\)
\( \newcommand{\Argument}{\mathrm{Arg}}\)
\( \newcommand{\norm}[1]{\| #1 \|}\)
\( \newcommand{\inner}[2]{\langle #1, #2 \rangle}\)
\( \newcommand{\Span}{\mathrm{span}}\) \( \newcommand{\AA}{\unicode[.8,0]{x212B}}\)
\( \newcommand{\vectorA}[1]{\vec{#1}} % arrow\)
\( \newcommand{\vectorAt}[1]{\vec{\text{#1}}} % arrow\)
\( \newcommand{\vectorB}[1]{\overset { \scriptstyle \rightharpoonup} {\mathbf{#1}} } \)
\( \newcommand{\vectorC}[1]{\textbf{#1}} \)
\( \newcommand{\vectorD}[1]{\overrightarrow{#1}} \)
\( \newcommand{\vectorDt}[1]{\overrightarrow{\text{#1}}} \)
\( \newcommand{\vectE}[1]{\overset{-\!-\!\rightharpoonup}{\vphantom{a}\smash{\mathbf {#1}}}} \)
\( \newcommand{\vecs}[1]{\overset { \scriptstyle \rightharpoonup} {\mathbf{#1}} } \)
\(\newcommand{\longvect}{\overrightarrow}\)
\( \newcommand{\vecd}[1]{\overset{-\!-\!\rightharpoonup}{\vphantom{a}\smash {#1}}} \)
\(\newcommand{\avec}{\mathbf a}\) \(\newcommand{\bvec}{\mathbf b}\) \(\newcommand{\cvec}{\mathbf c}\) \(\newcommand{\dvec}{\mathbf d}\) \(\newcommand{\dtil}{\widetilde{\mathbf d}}\) \(\newcommand{\evec}{\mathbf e}\) \(\newcommand{\fvec}{\mathbf f}\) \(\newcommand{\nvec}{\mathbf n}\) \(\newcommand{\pvec}{\mathbf p}\) \(\newcommand{\qvec}{\mathbf q}\) \(\newcommand{\svec}{\mathbf s}\) \(\newcommand{\tvec}{\mathbf t}\) \(\newcommand{\uvec}{\mathbf u}\) \(\newcommand{\vvec}{\mathbf v}\) \(\newcommand{\wvec}{\mathbf w}\) \(\newcommand{\xvec}{\mathbf x}\) \(\newcommand{\yvec}{\mathbf y}\) \(\newcommand{\zvec}{\mathbf z}\) \(\newcommand{\rvec}{\mathbf r}\) \(\newcommand{\mvec}{\mathbf m}\) \(\newcommand{\zerovec}{\mathbf 0}\) \(\newcommand{\onevec}{\mathbf 1}\) \(\newcommand{\real}{\mathbb R}\) \(\newcommand{\twovec}[2]{\left[\begin{array}{r}#1 \\ #2 \end{array}\right]}\) \(\newcommand{\ctwovec}[2]{\left[\begin{array}{c}#1 \\ #2 \end{array}\right]}\) \(\newcommand{\threevec}[3]{\left[\begin{array}{r}#1 \\ #2 \\ #3 \end{array}\right]}\) \(\newcommand{\cthreevec}[3]{\left[\begin{array}{c}#1 \\ #2 \\ #3 \end{array}\right]}\) \(\newcommand{\fourvec}[4]{\left[\begin{array}{r}#1 \\ #2 \\ #3 \\ #4 \end{array}\right]}\) \(\newcommand{\cfourvec}[4]{\left[\begin{array}{c}#1 \\ #2 \\ #3 \\ #4 \end{array}\right]}\) \(\newcommand{\fivevec}[5]{\left[\begin{array}{r}#1 \\ #2 \\ #3 \\ #4 \\ #5 \\ \end{array}\right]}\) \(\newcommand{\cfivevec}[5]{\left[\begin{array}{c}#1 \\ #2 \\ #3 \\ #4 \\ #5 \\ \end{array}\right]}\) \(\newcommand{\mattwo}[4]{\left[\begin{array}{rr}#1 \amp #2 \\ #3 \amp #4 \\ \end{array}\right]}\) \(\newcommand{\laspan}[1]{\text{Span}\{#1\}}\) \(\newcommand{\bcal}{\cal B}\) \(\newcommand{\ccal}{\cal C}\) \(\newcommand{\scal}{\cal S}\) \(\newcommand{\wcal}{\cal W}\) \(\newcommand{\ecal}{\cal E}\) \(\newcommand{\coords}[2]{\left\{#1\right\}_{#2}}\) \(\newcommand{\gray}[1]{\color{gray}{#1}}\) \(\newcommand{\lgray}[1]{\color{lightgray}{#1}}\) \(\newcommand{\rank}{\operatorname{rank}}\) \(\newcommand{\row}{\text{Row}}\) \(\newcommand{\col}{\text{Col}}\) \(\renewcommand{\row}{\text{Row}}\) \(\newcommand{\nul}{\text{Nul}}\) \(\newcommand{\var}{\text{Var}}\) \(\newcommand{\corr}{\text{corr}}\) \(\newcommand{\len}[1]{\left|#1\right|}\) \(\newcommand{\bbar}{\overline{\bvec}}\) \(\newcommand{\bhat}{\widehat{\bvec}}\) \(\newcommand{\bperp}{\bvec^\perp}\) \(\newcommand{\xhat}{\widehat{\xvec}}\) \(\newcommand{\vhat}{\widehat{\vvec}}\) \(\newcommand{\uhat}{\widehat{\uvec}}\) \(\newcommand{\what}{\widehat{\wvec}}\) \(\newcommand{\Sighat}{\widehat{\Sigma}}\) \(\newcommand{\lt}{<}\) \(\newcommand{\gt}{>}\) \(\newcommand{\amp}{&}\) \(\definecolor{fillinmathshade}{gray}{0.9}\)Goals
- Students should gain familiarity with the operation of the instrument.
- Students should observe the multiple ionization states of a complex molecule.
- Students should be able to determine the optimal conditions to produce the best mass spectrum.
- The students should understand how to pick peaks and determine the charge and molecular weight of a complex compound.
In this experiment, you will learn the mechanics of electrospray mass spectrometry and use this technique to study the effect of different solvents on the three-dimensional structure of proteins.
Introduction
Every mass spectrometer has three essential parts, an ionization source, a mass analyzer, and a detector. There are many ionization techniques. In this class, you will encounter two different ionization methods. In the GC/MS experiment, the molecules of interest were ionized by electron impact. Not only were the molecules ionized they were fragmented into smaller pieces. The pattern of ionized fragments produced is characteristic of the compound and allows one to identify compounds by the mass spectrum produced. This is called a hard ionization technique; in contrast, electrospray ionization is a soft ionization technique. The solution containing the compound of interest is sprayed through a nebulizer to create a fine mist of droplets. The droplets are charged by the large potential difference between the end of the nebulizer needle and the entrance of the capillary (Figure 1). The droplets are dried by the drying gas inside the capillary. As the droplets shrink, the electrostatic repulsion between the charged particles causes some of them to enter the gas phase. The gas-phase ions are drawn through the capillary by the high vacuum in the analyzer. The molecules in solution are ionized but not fragmented. Each molecule in the solution can have a different number of charges attached. This creates a mass spectrum of differently charged particles.
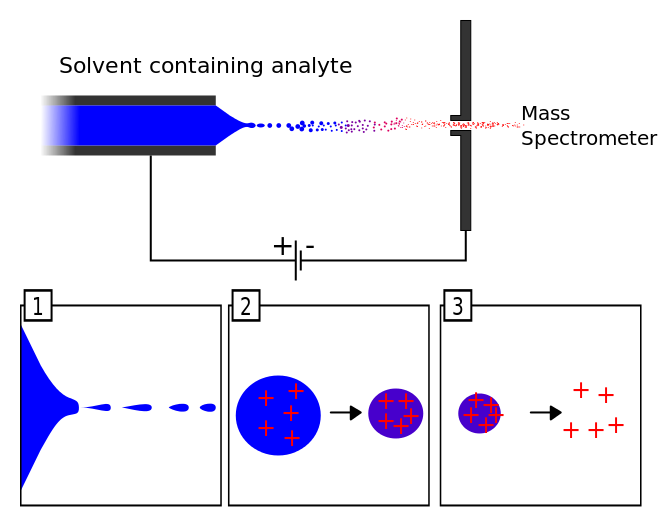
Figure 7.1: Diagram of Electrospray Ionization. (1) Under high voltage, the "Taylor Cone" emits a jet of liquid drops (2) The solvent from the droplets progressively evaporates, leaving them more and more charged (3) When the charge exceeds the Rayleigh limit the droplet explosively dissociates, leaving a stream of charged ions. Image used with permission (CC-SA-BY 3.0; )
In this instrument, the mass analyzer is a modified quadrupole. The quadrupole detector comprises four rods, two positively charged and two negatively charged, maintained by a variable DC potential difference (Figure 2). A variable AC potential also exists between the two rods. The mass of ions that pass through the quadrupole is determined by the strengths of the applied fields. During a scan, the voltages are ramped up but the ratio of the ac and dc fields is held constant. See section 11B-2 in Skoog for a detailed description. Scans are very quick, on the order of 100 ms. Because of the speed of data acquisition, the quadrupole detector is ideal for the analysis of HPLC output. Once the ions make it through the quadrupole they must be counted by a detector. The detector in your system is a HED (high energy dynode) detector, which is a modified electron multiplier that is more sensitive at higher masses.
Figure 7.2. Quadrupole Ion selector
The instrument is extremely flexible and can be run in either positive or negative ion selection mode. It can also be run in scan mode where a wide range of masses is detected or it can be used in selected ion mode where only a single ion is detected.
The technique is used primarily for determining the molecular weights of proteins and components of multi-protein complexes. For proteins larger than 3000 daltons, no molecular ion can be observed in this mass spectrometer. A series of ions is produced from each protein molecule. The pattern of peaks is called the charge state envelope. The molecular weight of the protein can be determined based on the distribution of ions in the envelope. The first step is to determine which ions are related. Usually this involves selecting the largest peaks in the mass spectrum. Remember that you are detecting protein molecules to which additional H+ atoms are attached. The m/z of a particular peak is:
\[ \dfrac{m}{Z} = \dfrac{M + nH^+}{n} \label{7.1}\]
where M is the mass of the uncharged protein and n is the number of additional protons attached and H+ is the mass of a single proton. Using several peaks in the charge state envelope you can determine the molecular weight of the protein.
Electrospray ionization is also used to study protein denaturation. When a protein is folded into a compact globular structure many of the ionizable side chains are buried in the core of the protein and are not accessible to solvent. So, they will not be ionized. As the protein unfolds the buried acidic or basic side chains are exposed to solvent and protonated or deprotonated. Thus, the more peaks at high m/z the more unfolded the protein.
Example
When determining the molar mass of a compound, it requires using two adjacent peaks seen in the mass spectrum. Usually, the tallest peak and its neighbor are the best peaks to select. When performing the calculation, the following two equations represent the two adjacent peaks:
\[ X = \dfrac{M + z}{z} \label{7.2}\]
\[ Y = \dfrac{M + z + 1}{z + 1} \label{7.3}\]
The X equation represents the peak with the larger m/z value. This peak is not as ionized as the Y equation which is the peak that has the smaller m/z value. Equations 7.2 and 7.3 can be combined to find the z value or the charge of the molecule (Equation 7.4).
\[ z = \dfrac{Y - 1}{X - Y} \label{7.4}\]
This z value can then be used to solve for the molecule weight. By performing a simple rearrangement of equation 7.2, the molecular weight can be solved for. The rearranged equation can be seen as equation 7.5.
\[ M = z (X - 1) \label{7.5}\]
Solution
In the following example, the charge and the molecular weight will be calculated for the following molecule.
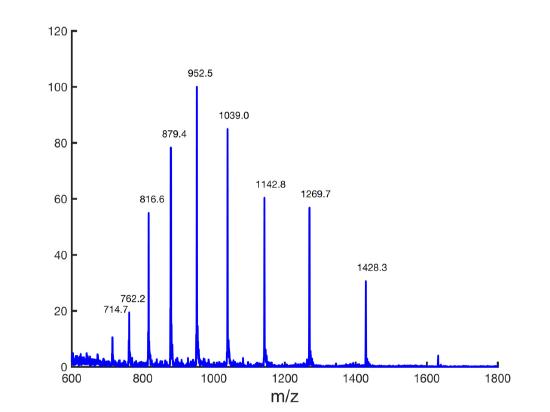
Figure 7.3: Example of a Mass Spectrum.
The first task will be to start by picking two adjacent peaks. The tallest peak is 952.5 m/z, so this will be the Y peak. The X peak will be the adjacent peak with the larger m/z value. In this example, the 1039 m/z peak will be used. These values will be plugged into equation \(\ref{7.4}\))to determine the charge.
\[ z = \dfrac{952.5 - 1}{1039 - 952.5} \label{7.6}\]
After plugging in these values, this equation results in a z value of +11. This z value can be used to determine the molecular weight by using equation \(\ref{7.5}\)).
\[ M = 11 (1039 - 1) \label{7.7}\]
After completing this calculation, the molecular weight is calculated to be 11,418 amu. This value is an approximation, but after finding out that the molecule is putidaredoxin which has an actual theoretical molecular weight of 11,419 amu, it shows that this method could approximate the mass very closely.
Principles of protein structure
Proteins are polymers of 20 amino acids. The amino acids can be divided into groups based on their chemical properties. The hydrophobic or non-polar amino acids are leucine, isoleucine, valine, alanine, phenylalanine, methionine, proline and tryptophan; the polar, uncharged residues are glycine, serine, threonine, tyrosine, glutamine, asparagine and cysteine. The most important for mass spectrometry are the charged amino acids, glutamate and aspartate are the acidic side chains, lysine, arginine, and histidine are the basic side chains. The structures for the 20 side chains are shown in Figure 3. Note that the figure contains a few errors: under the positively charged side groups heading, the Asparagine amino acid listed should actually be Arginine (Arg, R) and under the polar, uncharged side groups heading, the Aspartate amino acid listed should actually be Asparagine (Asn, N). Also, Proline should be listed in the nonpolar, aliphatic side groups section as it is hydrophobic.
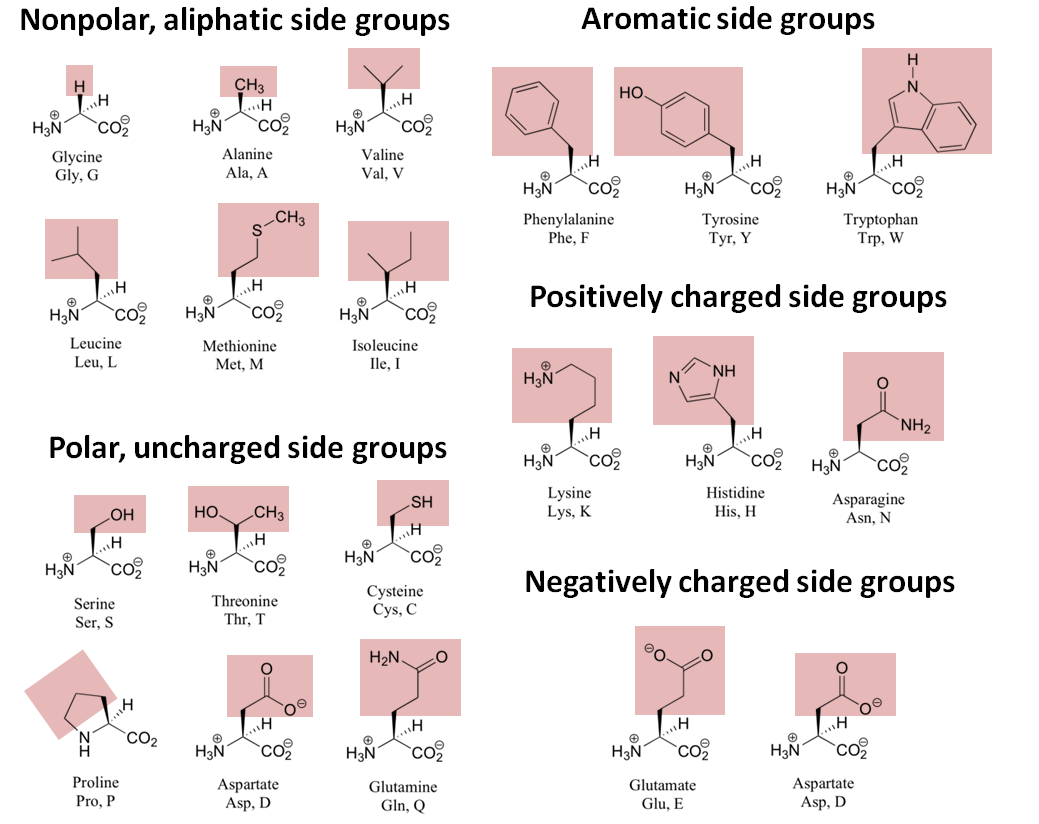
Figure 7.4: The structures of the 20 naturally occurring amino acids.
At pHs above the pKa for the acidic side chains, those side chains will carry a negative charge. The basic side chains are positively charged at pH less than the pKa. The pH of the solution in which your protein is prepared will determine how the proteins are studied by mass spectrometry. At low p,H the proteins will carry a net positive charge and at higher pHs, the charge will go through neutral and become positive as the pH increases. The pKa's of the amino acids are shown in table 1.
| Amino Acid | α-carboxylic acid | α-amino | Side chain |
|---|---|---|---|
| Alanine | 2.35 | 9.87 | |
| Arginine | 2.01 | 9.04 | 12.48 |
| Asparagine | 2.02 | 8.80 | |
| Aspartic Acid | 2.10 | 9.82 | 3.86 |
| Cysteine | 2.05 | 10.25 | 8.00 |
| Glutamic Acid | 2.10 | 9.47 | 4.07 |
| Glutamine | 2.17 | 9.13 | |
| Glycine | 2.35 | 9.78 | |
| Histidine | 1.77 | 9.18 | 6.10 |
| Isoleucine | 2.32 | 9.76 | |
| Leucine | 2.33 | 9.74 | |
| Lysine | 2.18 | 8.95 | 10.53 |
| Methionine | 2.28 | 9.21 | |
| Phenylalanine | 2.58 | 9.24 | |
| Proline | 2.00 | 10.60 | |
| Serine | 2.21 | 9.15 | |
| Threonine | 2.09 | 9.10 | |
| Tryptophan | 2.38 | 9.39 | |
| Tyrosine | 2.20 | 9.11 | 10.07 |
| Valine | 2.29 | 9.72 |
The forces that stabilize the three dimensional or tertiary structures of proteins are hydrophobic interactions between the non-polar side chains, hydrogen bonds between carbonyl oxygens and amide nitrogens, electrostatic interactions, usually on the surface of the protein, between charged side chains. Denaturation occurs when the tertiary structure of the protein unfolds (imagine scrunching up a rubber band and then letting go of it.) As the tertiary interactions unfold, so do the secondary structure elements, the alpha helices, and the beta sheets. The pH of the solvent will affect not only the charge of the ionizable side chains it will also destabilize the three-dimensional structure of the protein by disrupting charge-charge and electrostatic interaction that stabilize the structure. Organic solvents also destabilize the structure by interfering with the hydrophobic interactions between nonpolar side chains. Hydrophobic interaction is a term used to describe the phenomenon that nonpolar groups prefer to be in a nonpolar environment. In aqueous solution, the nonpolar side chains will "stick together" to decrease the surface area in contact with the solvent.
Denaturants that are frequently used include, heat, urea, salt, pH and organic solvents. The effect of these denaturants on protein stability give insight into the type of interactions that are more important in stabilizing the tertiary structure.
Experimental Procedure
In this experiment, you will acquire mass spectra of the protein ubiquitin under several different solvent conditions.
- First, you will investigate the effect of pH on protein stability by looking at the mass spectrum at different pH values.
- Make 100 mLs each of the following 5 solutions: Water and acetic acid at pH=7, 2.75, 2.5, 2.1, and 1.8.
- You will be given a 10-3 M solution of ubiquitin in water. Prepare 1mL dilutions of 10-6M ubiquitin by diluting the stock ubiquitin in each of the solutions.
HINT: Glacial acetic acid is 100% and the molarity is 17.4. The Ka for acetic acid is 1.76x10⁻⁵. Also, remember the ICE table approach. Use this information to calculate what percentage of acetic acid solutions you need to make. Do this before you come to the lab.
You will also investigate the effect of organic solvents on the stability of ubiquitin.
Make 10 mLs each of the following 4 solutions:
- 20% acetonitrile + 80% pH=2.75 acetic acid and water
- 5% acetonitrile + 95% pH=2.75 acetic acid and water
- 20% methanol + 80% pH=2.75 acetic acid and water
- 40% methanol + 60% pH=2.75 acetic acid and water.
Use the same stock solution of ubiquitin to prepare 1 mL of 10-6 M ubiquitin by diluting the ubiquitin in each of the solutions.
Instrumentation
(For a 2013 update go to http://chemwiki.ucdavis.edu/User:labgod4)
The instrument you are using is a Varian 325-MS with a Primeline LC Pump (instrument picture below is not the MS-325-TQ).


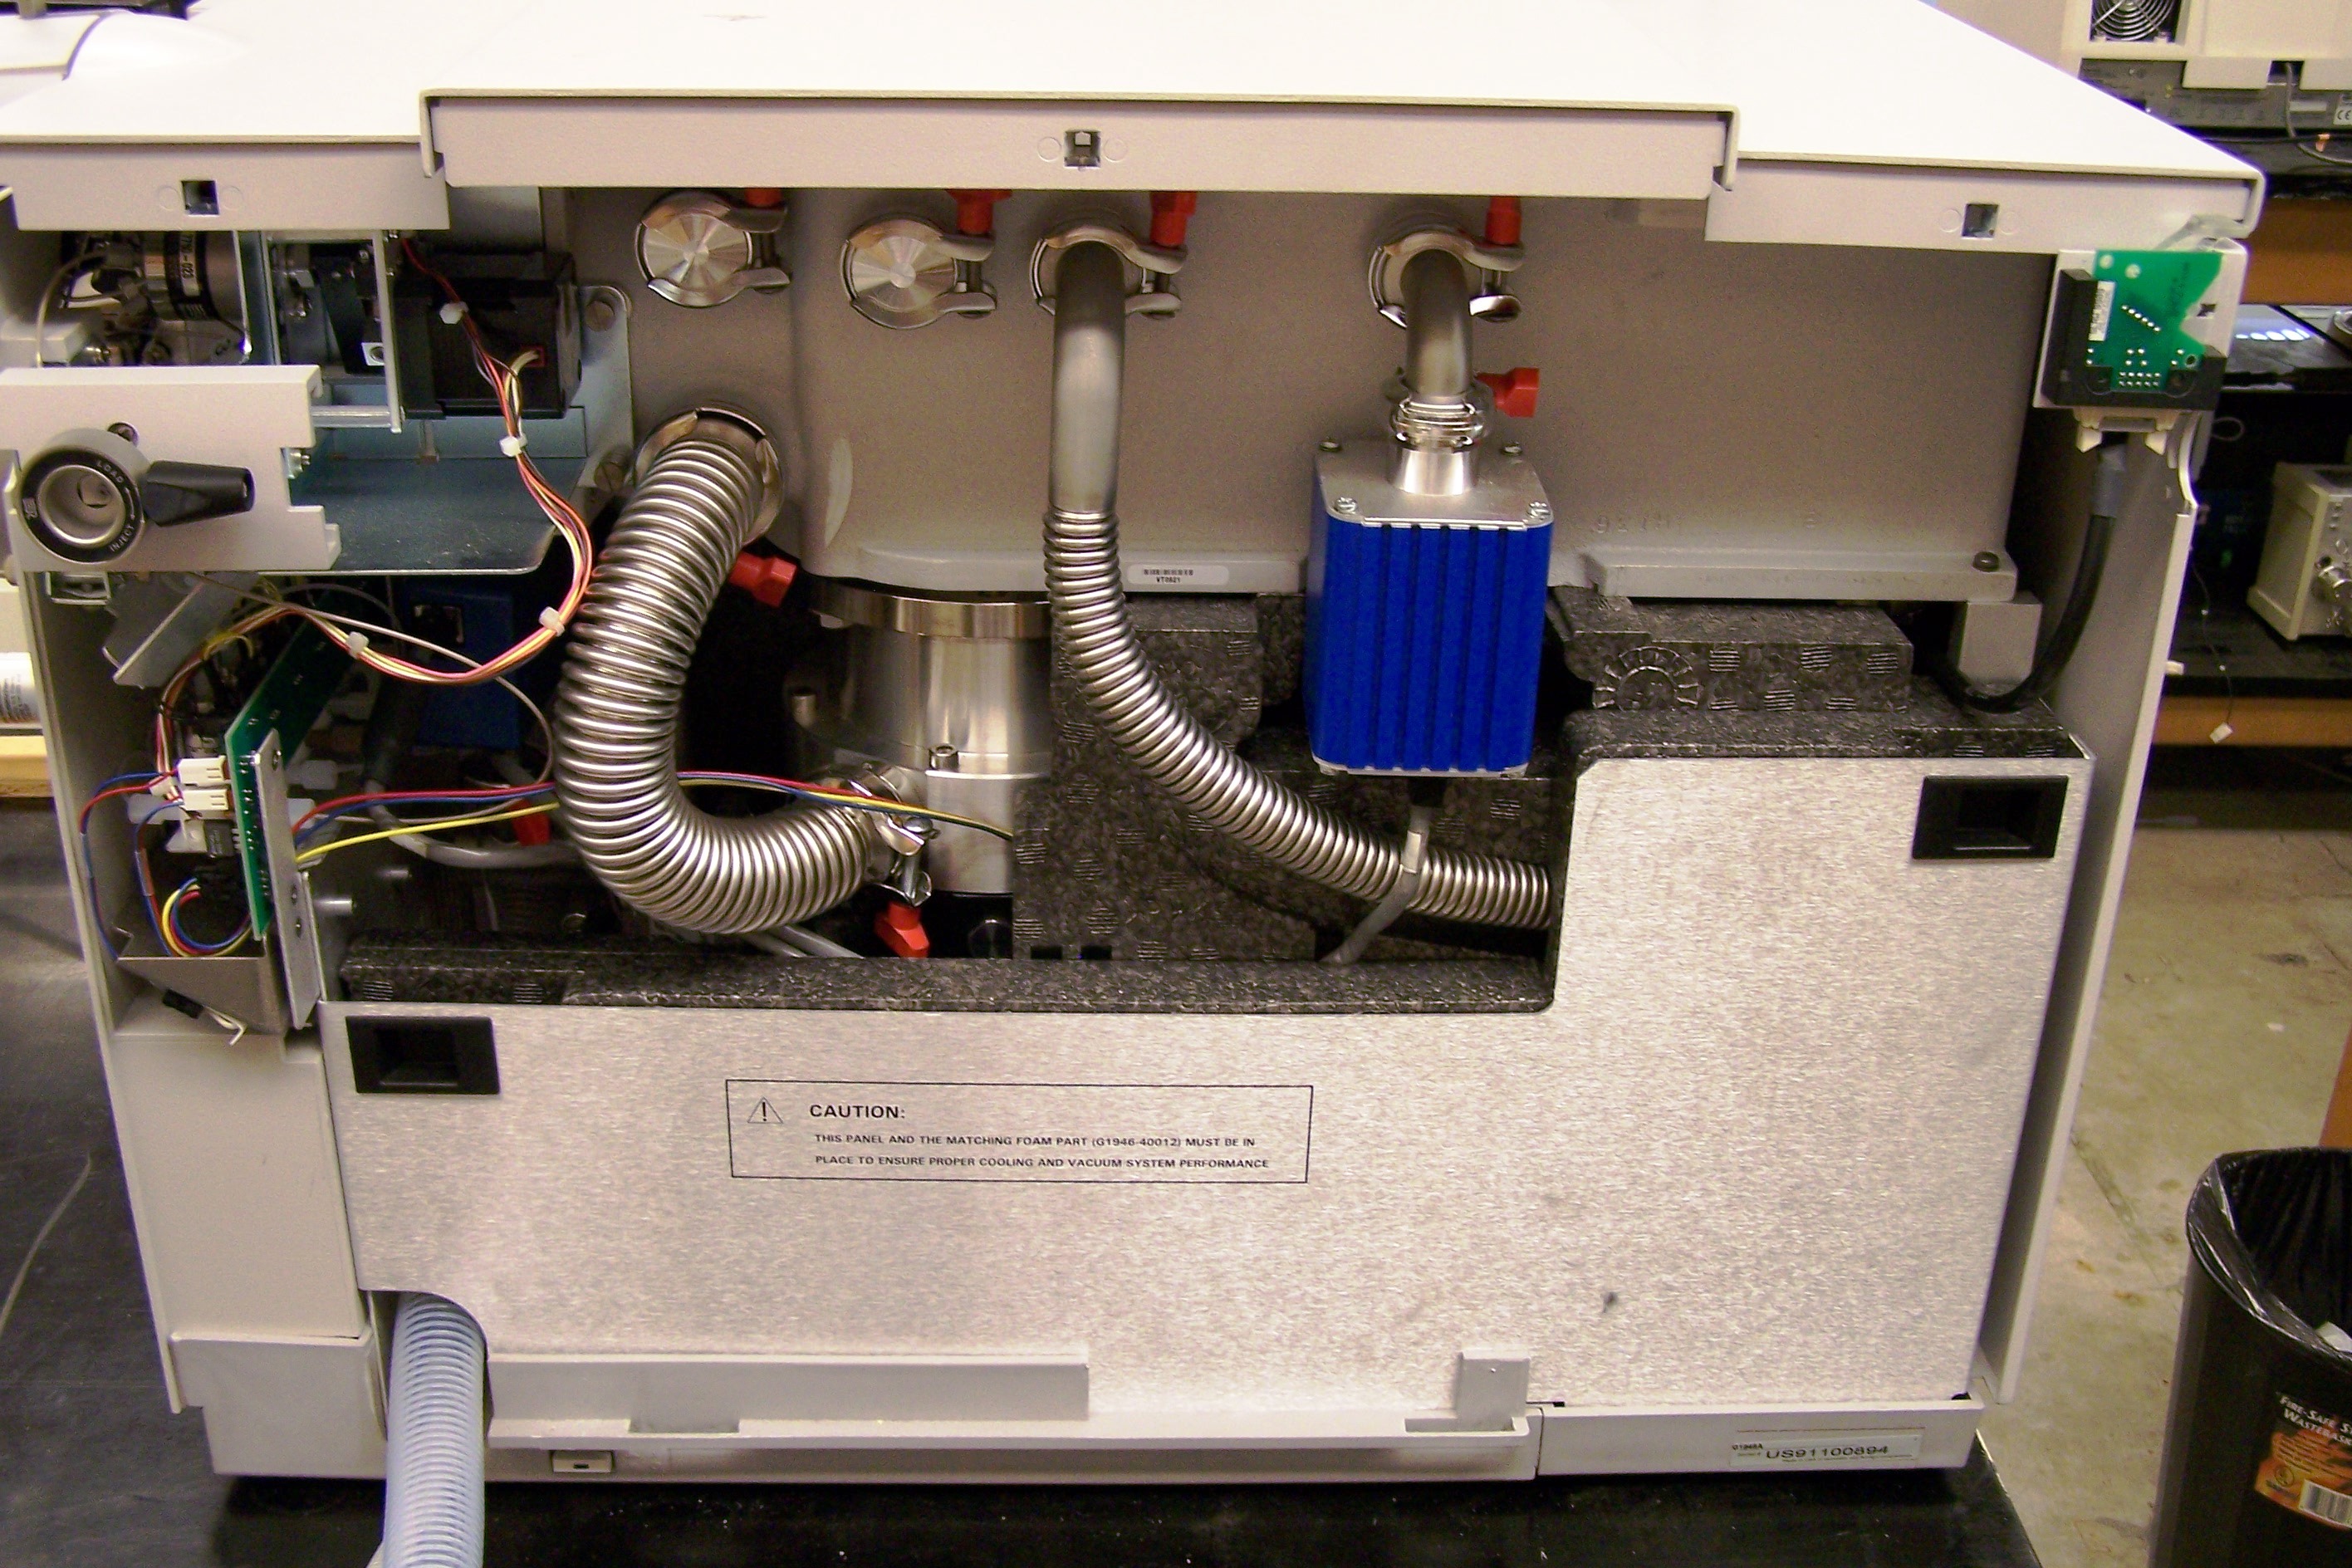
Figure 7.5: Mass Spectrometer in Chem 115. The ESI needle in the middle image.
First, make sure that the solvent reservoirs are sufficiently filled with HPLC grade solvent. Open System Control, if it is not already open, by clicking on the top and most left icon (Figure 7.6) on the toolbar at the top of the monitor. This opens up the Quad View (Figure 7.7). Make sure you are using view III (Figure 7.8) so that the proper quadrants are viewable. Make sure the correct method is loaded. This software should look familiar because it is similar to that used for the HPLC experiment. The desired method for running the ubiquitin samples is '115 50-50 posneg 4 min'. It is a 4-minute method. Changing methods is done by activating the desired method under the file tab of System Control.

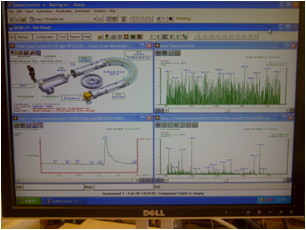
Figure 7.6 Figure 7.7
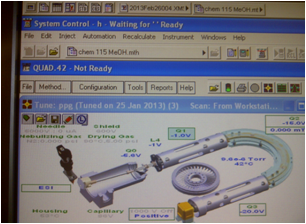
Figure 7.8 Figure 7.9
Click Turn Spray On in the Quad view (Figure 7.10 ) to turn on the gases and heaters. Once the temperature reaches 75% of the set value (275-300ºC) activate the pumps under the Windows tab under System Control, click on 212.24, then "Activate." The spray icon now has a red stream coming from it (Figure 7.11), and the pump lights have turned green.
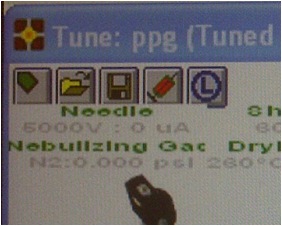
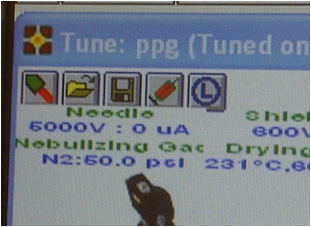
Figure 7.10 Figure 7.11
A few minutes is required for the temperature to stabilize, flush out the sample loop during this time. Add ~10 μL of water into the sample loop in the INJECT position, twice. When you are ready to load your sample, make sure the valve is in the LOAD position. Dilute the first sample (pH 7) 10x to check concentration, and inject around 10. Then, under the Windows tab in System Control, click on the Sample List, click Data Files, and change the sample name. Once the API and 325 indicate they are ready (Figure 7.12), it is time to turn on the analyzer. The button turns green when it has been activated (Figure 13).
Now toggle back to the 212.24 LC pump window and click Start Run on the pumps. This starts the run and the green analysis timer begins in the area to the right of '325 MS: ready to collect' seen in Figure 7.10. Push the valve button to INJECT your first sample into the LCMS after the run has gone for 1 min. After each run, make sure the instrument is in the "Ready" and "Ready to collect" mode.
To print your chromatograms and mass spectra, click on your file name above System Control at the top of the monitor (Figure 7.14) which opens the window that appears in Figure 7.15 and select: View/edit chromatogram. Click on the desired peak and the mass spec data pops up below (Figure 7.16). Use the arrow keys to locate the highest RIC for the peak of interest. Right click on the mouse to label the peak as desired by choosing New Label for Plot 1 (Figure 7.17). Hover the mouse of the label; when the arrow turns to a 'hand' the label and its indicator can be dragged to their desired locations. Print, using the printer icon, choose active chromatogram and spectrum. Then click on the short stack printer icon to send the data to the printer. Each click prints one copy.
Repeat this for all samples, starting with the flushing of the sample loop.
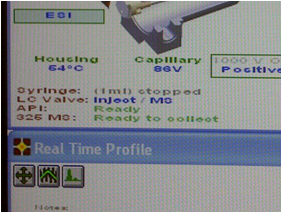
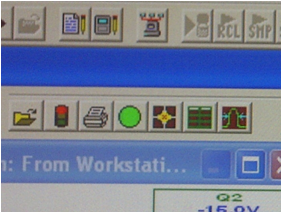
Figure 7.12 Figure 7.13
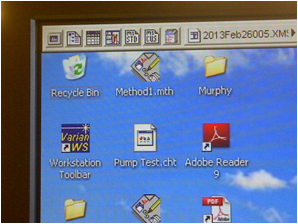
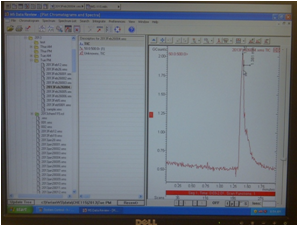
Figure 7.14 Figure 7.15
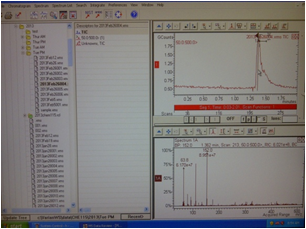
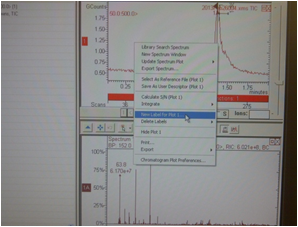
Figure 7.16 Figure 7.17
Shutdown Protocol: Once the analysis is complete, turn off the spray by clicking the icon in Figure 7.11. The icon now reverts back to how it appears in Figure 7.10. Verify that the spray has become a constant drip in the API window. Allow the drip to continue for a few minutes. Toggle back to the Quad View to verify that the Spray is off and appears as it does in Figure 7.10 (no red coming out). If it has not been dripping, allow the drip to continue to flush out the needle and chamber for a few minutes. Using the Windows tab in System Control, toggle to the 212.24 window and click Stop Pumps. It is now safe to close out System Control and exit as normal. Make sure to log off to restrict the access to the instrument.
Post-Lab Questions
- Print the chromatogram and the mass spectra for each "peak" in the chromatogram.
- Using the pattern of peaks in your mass spectrum of the pH=2.75 sample calculate the molecular weight of ubiquitin. Show all your work.
Include the answers to the following questions in your report:
- Why is the peak for the pH=7 sample so much smaller than the peaks for all the other conditions?
- Discuss the differences in the distribution of ions for all the different conditions.
- What happens to the 3-dimensional structure of the protein as the pH is decreased?
- What happens as the concentration of the organic solvent is increased? Explain the differences you see with methanol and acetonitrile.
References
- Chowdhury, S. K.; Katt, V.; Chiat, B. T. Probing Conformational Changes in Proteins by Mass Spectrometry. J. Am. Chem. Soc. 1990, 112, 9012.
- Loo, J. A.; Ogorzalek-Loo, R. R.; Udseth, H. R.; Edmonds, C. G.; Smith, R. D. Solvent Induced Conformational Changes of Polypeptides Probed by Electrospray Ionization Mass Spectrometry. Rapid Comm. in Mass Spec. 1991, 5, 101.
- Hofstadter, S. A.; Smith, R. D. Electrospray Ionization Mass Spectrometry. J. Chem. Ed. 1996, 73, A82.
- For a 2013 Update go to http://chemwiki.ucdavis.edu/User:labgod4