
7.3: Acid-Base Titrations
- Page ID
- 164773
\( \newcommand{\vecs}[1]{\overset { \scriptstyle \rightharpoonup} {\mathbf{#1}} } \)
\( \newcommand{\vecd}[1]{\overset{-\!-\!\rightharpoonup}{\vphantom{a}\smash {#1}}} \)
\( \newcommand{\dsum}{\displaystyle\sum\limits} \)
\( \newcommand{\dint}{\displaystyle\int\limits} \)
\( \newcommand{\dlim}{\displaystyle\lim\limits} \)
\( \newcommand{\id}{\mathrm{id}}\) \( \newcommand{\Span}{\mathrm{span}}\)
( \newcommand{\kernel}{\mathrm{null}\,}\) \( \newcommand{\range}{\mathrm{range}\,}\)
\( \newcommand{\RealPart}{\mathrm{Re}}\) \( \newcommand{\ImaginaryPart}{\mathrm{Im}}\)
\( \newcommand{\Argument}{\mathrm{Arg}}\) \( \newcommand{\norm}[1]{\| #1 \|}\)
\( \newcommand{\inner}[2]{\langle #1, #2 \rangle}\)
\( \newcommand{\Span}{\mathrm{span}}\)
\( \newcommand{\id}{\mathrm{id}}\)
\( \newcommand{\Span}{\mathrm{span}}\)
\( \newcommand{\kernel}{\mathrm{null}\,}\)
\( \newcommand{\range}{\mathrm{range}\,}\)
\( \newcommand{\RealPart}{\mathrm{Re}}\)
\( \newcommand{\ImaginaryPart}{\mathrm{Im}}\)
\( \newcommand{\Argument}{\mathrm{Arg}}\)
\( \newcommand{\norm}[1]{\| #1 \|}\)
\( \newcommand{\inner}[2]{\langle #1, #2 \rangle}\)
\( \newcommand{\Span}{\mathrm{span}}\) \( \newcommand{\AA}{\unicode[.8,0]{x212B}}\)
\( \newcommand{\vectorA}[1]{\vec{#1}} % arrow\)
\( \newcommand{\vectorAt}[1]{\vec{\text{#1}}} % arrow\)
\( \newcommand{\vectorB}[1]{\overset { \scriptstyle \rightharpoonup} {\mathbf{#1}} } \)
\( \newcommand{\vectorC}[1]{\textbf{#1}} \)
\( \newcommand{\vectorD}[1]{\overrightarrow{#1}} \)
\( \newcommand{\vectorDt}[1]{\overrightarrow{\text{#1}}} \)
\( \newcommand{\vectE}[1]{\overset{-\!-\!\rightharpoonup}{\vphantom{a}\smash{\mathbf {#1}}}} \)
\( \newcommand{\vecs}[1]{\overset { \scriptstyle \rightharpoonup} {\mathbf{#1}} } \)
\(\newcommand{\longvect}{\overrightarrow}\)
\( \newcommand{\vecd}[1]{\overset{-\!-\!\rightharpoonup}{\vphantom{a}\smash {#1}}} \)
\(\newcommand{\avec}{\mathbf a}\) \(\newcommand{\bvec}{\mathbf b}\) \(\newcommand{\cvec}{\mathbf c}\) \(\newcommand{\dvec}{\mathbf d}\) \(\newcommand{\dtil}{\widetilde{\mathbf d}}\) \(\newcommand{\evec}{\mathbf e}\) \(\newcommand{\fvec}{\mathbf f}\) \(\newcommand{\nvec}{\mathbf n}\) \(\newcommand{\pvec}{\mathbf p}\) \(\newcommand{\qvec}{\mathbf q}\) \(\newcommand{\svec}{\mathbf s}\) \(\newcommand{\tvec}{\mathbf t}\) \(\newcommand{\uvec}{\mathbf u}\) \(\newcommand{\vvec}{\mathbf v}\) \(\newcommand{\wvec}{\mathbf w}\) \(\newcommand{\xvec}{\mathbf x}\) \(\newcommand{\yvec}{\mathbf y}\) \(\newcommand{\zvec}{\mathbf z}\) \(\newcommand{\rvec}{\mathbf r}\) \(\newcommand{\mvec}{\mathbf m}\) \(\newcommand{\zerovec}{\mathbf 0}\) \(\newcommand{\onevec}{\mathbf 1}\) \(\newcommand{\real}{\mathbb R}\) \(\newcommand{\twovec}[2]{\left[\begin{array}{r}#1 \\ #2 \end{array}\right]}\) \(\newcommand{\ctwovec}[2]{\left[\begin{array}{c}#1 \\ #2 \end{array}\right]}\) \(\newcommand{\threevec}[3]{\left[\begin{array}{r}#1 \\ #2 \\ #3 \end{array}\right]}\) \(\newcommand{\cthreevec}[3]{\left[\begin{array}{c}#1 \\ #2 \\ #3 \end{array}\right]}\) \(\newcommand{\fourvec}[4]{\left[\begin{array}{r}#1 \\ #2 \\ #3 \\ #4 \end{array}\right]}\) \(\newcommand{\cfourvec}[4]{\left[\begin{array}{c}#1 \\ #2 \\ #3 \\ #4 \end{array}\right]}\) \(\newcommand{\fivevec}[5]{\left[\begin{array}{r}#1 \\ #2 \\ #3 \\ #4 \\ #5 \\ \end{array}\right]}\) \(\newcommand{\cfivevec}[5]{\left[\begin{array}{c}#1 \\ #2 \\ #3 \\ #4 \\ #5 \\ \end{array}\right]}\) \(\newcommand{\mattwo}[4]{\left[\begin{array}{rr}#1 \amp #2 \\ #3 \amp #4 \\ \end{array}\right]}\) \(\newcommand{\laspan}[1]{\text{Span}\{#1\}}\) \(\newcommand{\bcal}{\cal B}\) \(\newcommand{\ccal}{\cal C}\) \(\newcommand{\scal}{\cal S}\) \(\newcommand{\wcal}{\cal W}\) \(\newcommand{\ecal}{\cal E}\) \(\newcommand{\coords}[2]{\left\{#1\right\}_{#2}}\) \(\newcommand{\gray}[1]{\color{gray}{#1}}\) \(\newcommand{\lgray}[1]{\color{lightgray}{#1}}\) \(\newcommand{\rank}{\operatorname{rank}}\) \(\newcommand{\row}{\text{Row}}\) \(\newcommand{\col}{\text{Col}}\) \(\renewcommand{\row}{\text{Row}}\) \(\newcommand{\nul}{\text{Nul}}\) \(\newcommand{\var}{\text{Var}}\) \(\newcommand{\corr}{\text{corr}}\) \(\newcommand{\len}[1]{\left|#1\right|}\) \(\newcommand{\bbar}{\overline{\bvec}}\) \(\newcommand{\bhat}{\widehat{\bvec}}\) \(\newcommand{\bperp}{\bvec^\perp}\) \(\newcommand{\xhat}{\widehat{\xvec}}\) \(\newcommand{\vhat}{\widehat{\vvec}}\) \(\newcommand{\uhat}{\widehat{\uvec}}\) \(\newcommand{\what}{\widehat{\wvec}}\) \(\newcommand{\Sighat}{\widehat{\Sigma}}\) \(\newcommand{\lt}{<}\) \(\newcommand{\gt}{>}\) \(\newcommand{\amp}{&}\) \(\definecolor{fillinmathshade}{gray}{0.9}\)Skills to Develop
- Understand the features of titration curves for strong and weak acid-base systems
- Understand the relationship between the titration curve of a weak acid or base and buffers
- Understand the use of indicators to monitor pH titrations
In an acid–base titration, a buret is used to deliver measured volumes of an acid or a base solution of known concentration (the titrant) to a flask that contains a solution of a base or an acid, respectively, of unknown concentration (the unknown). If the concentration of the titrant is known, then the concentration of the unknown can be determined. The following discussion focuses on the pH changes that occur during an acid–base titration. Plotting the pH of the solution in the flask against the amount of acid or base added produces a titration curve. The shape of the curve provides important information about what is occurring in solution during the titration.
Titrations of Strong Acids and Bases
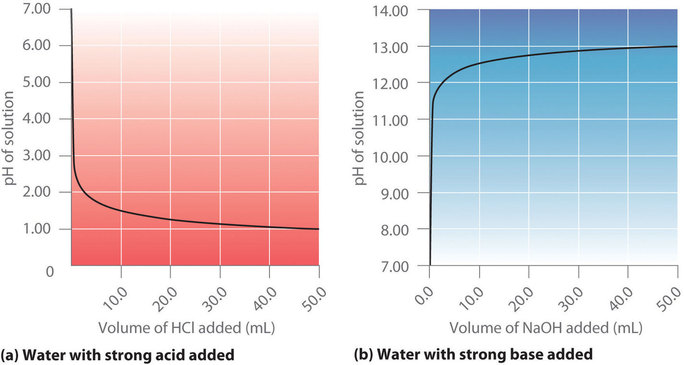
Figure \(\PageIndex{1a}\) shows a plot of the pH as 0.20 M HCl is gradually added to 50.00 mL of pure water. The pH of the sample in the flask is initially 7.00 (as expected for pure water), but it drops very rapidly as HCl is added. Eventually the pH becomes constant at 0.70—a point well beyond its value of 1.00 with the addition of 50.0 mL of HCl (0.70 is the pH of 0.20 M HCl). In contrast, when 0.20 M \(NaOH\) is added to 50.00 mL of distilled water, the pH (initially 7.00) climbs very rapidly at first but then more gradually, eventually approaching a limit of 13.30 (the pH of 0.20 M NaOH), again well beyond its value of 13.00 with the addition of 50.0 mL of \(NaOH\) as shown in Figure \(\PageIndex{1b}\). As you can see from these plots, the titration curve for adding a base is the mirror image of the curve for adding an acid.
Suppose that we now add 0.20 M \(NaOH\) to 50.0 mL of a 0.10 M solution of HCl. Because HCl is a strong acid that is completely ionized in water, the initial \([H^+]\) is 0.10 M, and the initial pH is 1.00. Adding \(NaOH\) decreases the concentration of H+ because of the neutralization reaction: (\(OH^−+H^+ \rightleftharpoons H_2O\)) (in part (a) in Figure \(\PageIndex{2}\)). Thus the pH of the solution increases gradually. Near the equivalence point, however, the point at which the number of moles of base (or acid) added equals the number of moles of acid (or base) originally present in the solution, the pH increases much more rapidly because most of the H+ ions originally present have been consumed. For the titration of a monoprotic strong acid (HCl) with a monobasic strong base (NaOH), we can calculate the volume of base needed to reach the equivalence point from the following relationship:
\[moles\;of \;base=(volume)_b(molarity)_bV_bM_b= moles \;of \;acid=(volume)_a(molarity)_a=V_aM_a \label{Eq1}\]
If 0.20 M \(NaOH\) is added to 50.0 mL of a 0.10 M solution of HCl, we solve for \(V_b\):
\[V_b(0.20 Me)=0.025 L=25 mL\]
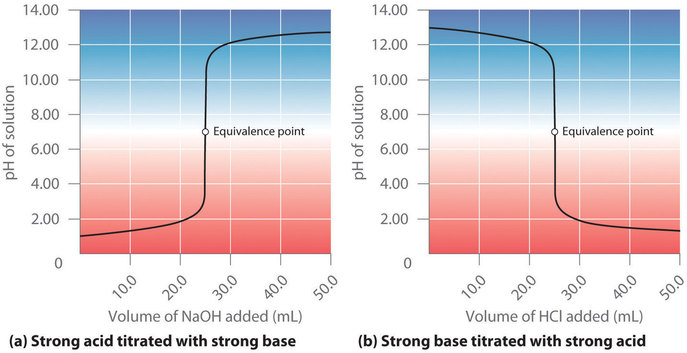
Figure \(\PageIndex{2}\): The Titration of (a) a Strong Acid with a Strong Base and (b) a Strong Base with a Strong Acid(a) As 0.20 M \(NaOH\) is slowly added to 50.0 mL of 0.10 M HCl, the pH increases slowly at first, then increases very rapidly as the equivalence point is approached, and finally increases slowly once more. (b) Conversely, as 0.20 M HCl is slowly added to 50.0 mL of 0.10 M \(NaOH\), the pH decreases slowly at first, then decreases very rapidly as the equivalence point is approached, and finally decreases slowly once more.
At the equivalence point (when 25.0 mL of \(NaOH\) solution has been added), the neutralization is complete: only a salt remains in solution (NaCl), and the pH of the solution is 7.00. Adding more \(NaOH\) produces a rapid increase in pH, but eventually the pH levels off at a value of about 13.30, the pH of 0.20 M \(NaOH\).
As shown in Figure \(\PageIndex{2b}\), the titration of 50.0 mL of a 0.10 M solution of \(\ce{NaOH}\) with 0.20 M \(\ce{HCl}\) produces a titration curve that is nearly the mirror image of the titration curve in Figure \(\PageIndex{2a}\). The pH is initially 13.00, and it slowly decreases as \(\ce{HCl}\) is added. As the equivalence point is approached, the pH drops rapidly before leveling off at a value of about 0.70, the pH of 0.20 M HCl.
The titration of either a strong acid with a strong base or a strong base with a strong acid produces an S-shaped curve. The curve is somewhat asymmetrical because the steady increase in the volume of the solution during the titration causes the solution to become more dilute. Due to the leveling effect, the shape of the curve for a titration involving a strong acid and a strong base depends on only the concentrations of the acid and base, not their identities.
The shape of the titration curve involving a strong acid and a strong base depends only on their concentrations, not their identities.
Example \(\PageIndex{1}\): Hydrochloric Acid
Calculate the pH of the solution after 24.90 mL of 0.200 M \(NaOH\) has been added to 50.00 mL of 0.100 M HCl.
Given: volumes and concentrations of strong base and acid
Asked for: pH
Strategy:
- Calculate the number of millimoles of \(\ce{H^{+}}\) and \(\ce{OH^{-}}\) to determine which, if either, is in excess after the neutralization reaction has occurred. If one species is in excess, calculate the amount that remains after the neutralization reaction.
- Determine the final volume of the solution. Calculate the concentration of the species in excess and convert this value to pH.
SOLUTION
A Because 0.100 mol/L is equivalent to 0.100 mmol/mL, the number of millimoles of \(\ce{H^{+}}\) in 50.00 mL of 0.100 M HCl can be calculated as follows:
\[ 50.00 \cancel{mL} \left ( \dfrac{0.100 \;mmol \;HCl}{\cancel{mL}} \right )= 5.00 \;mmol \;HCl=5.00 \;mmol \;H^{+} \]
The number of millimoles of \(NaOH\) added is as follows:
\[ 24.90 \cancel{mL} \left ( \dfrac{0.200 \;mmol \;NaOH}{\cancel{mL}} \right )= 4.98 \;mmol \;NaOH=4.98 \;mmol \;OH^{-} \]
Thus \(\ce{H^{+}}\) is in excess. To completely neutralize the acid requires the addition of 5.00 mmol of \(\ce{OH^{-}}\) to the \(\ce{HCl}\) solution. Because only 4.98 mmol of \(OH^-\) has been added, the amount of excess \(\ce{H^{+}}\) is 5.00 mmol − 4.98 mmol = 0.02 mmol of \(H^+\).
B The final volume of the solution is 50.00 mL + 24.90 mL = 74.90 mL, so the final concentration of \(\ce{H^{+}}\) is as follows:
\[ \left [ H^{+} \right ]= \dfrac{0.02 \;mmol \;H^{+}}{74.90 \; mL}=3 \times 10^{-4} \; M \]
Hence,
\[pH \approx −\log[\ce{H^{+}}] = −\log(3 \times 10^{-4}) = 3.5 \]
This is significantly less than the pH of 7.00 for a neutral solution.
Exercise \(\PageIndex{1}\)
Calculate the pH of a solution prepared by adding \(40.00\; mL\) of \(0.237\; M\) \(HCl\) to \(75.00\; mL\) of a \(0.133 M\) solution of \(NaOH\).
- Answer
-
11.6
Titrations of Weak Acids and Bases
In contrast to strong acids and bases, the shape of the titration curve for a weak acid or a weak base depends dramatically on the identity of the acid or the base and the corresponding \(K_a\) or \(K_b\). As we shall see, the pH also changes much more gradually around the equivalence point in the titration of a weak acid or a weak base. As you learned previously, \([H^+]\) of a solution of a weak acid (HA) is not equal to the concentration of the acid but depends on both its \(pK_a\) and its concentration. Because only a fraction of a weak acid dissociates, \([H^+]\) is less than \([HA]\). Thus the pH of a solution of a weak acid is greater than the pH of a solution of a strong acid of the same concentration. Figure \(\PageIndex{3a}\) shows the titration curve for 50.0 mL of a 0.100 M solution of acetic acid with 0.200 M \(NaOH\) superimposed on the curve for the titration of 0.100 M HCl shown in part (a) in Figure \(\PageIndex{2}\). Below the equivalence point, the two curves are very different. Before any base is added, the pH of the acetic acid solution is greater than the pH of the HCl solution, and the pH changes more rapidly during the first part of the titration. Note also that the pH of the acetic acid solution at the equivalence point is greater than 7.00. That is, at the equivalence point, the solution is basic. In addition, the change in pH around the equivalence point is only about half as large as for the HCl titration; the magnitude of the pH change at the equivalence point depends on the \(pK_a\) of the acid being titrated. Above the equivalence point, however, the two curves are identical. Once the acid has been neutralized, the pH of the solution is controlled only by the amount of excess \(NaOH\) present, regardless of whether the acid is weak or strong.
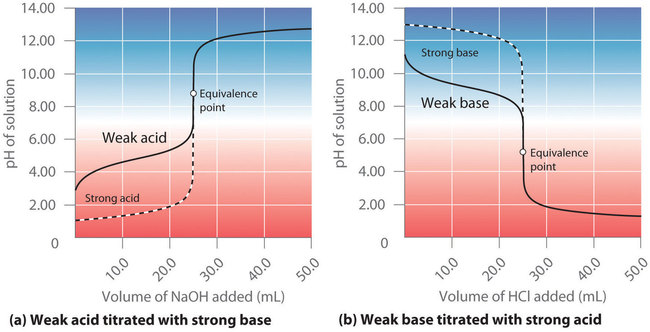
As shown in part (b) in Figure \(\PageIndex{3}\), the titration curve for NH3, a weak base, is the reverse of the titration curve for acetic acid. In particular, the pH at the equivalence point in the titration of a weak base is less than 7.00. To understand why the pH at the equivalence point of a titration of a weak acid or base is not 7.00, consider what species are present in the solution. At the beginning of the titration shown in Figure \(\PageIndex{3a}\), only the weak acid (acetic acid) is present, so the pH is low. As strong base is added, some of the acetic acid is neutralized and converted to its conjugate base, acetate. At the equivalence point, all of the acetic acid has been reacted with NaOH. However, the product is not neutral - it is the conjugate base, acetate! Because the conjugate base of a weak acid is weakly basic, the equivalence point of the titration reaches a pH above 7. Conversely, for the titration of a weak base with strong acid, the pH at the equivalence point is less than 7 because only the conjugate acid is present.
The pH at the equivalence point of the titration of a weak acid with strong base is greater than 7.00.
The pH at the equivalence point of the titration of a weak base with strong acid is less than 7.00.
The identity of the weak acid or weak base being titrated strongly affects the shape of the titration curve. Figure \(\PageIndex{4}\) illustrates the shape of titration curves as a function of the \(pK_a\) or the \(pK_b\). As the acid or the base being titrated becomes weaker (its \(pK_a\) or \(pK_b\) becomes larger), the pH change around the equivalence point decreases significantly. With very dilute solutions, the curve becomes so shallow that it can no longer be used to determine the equivalence point.
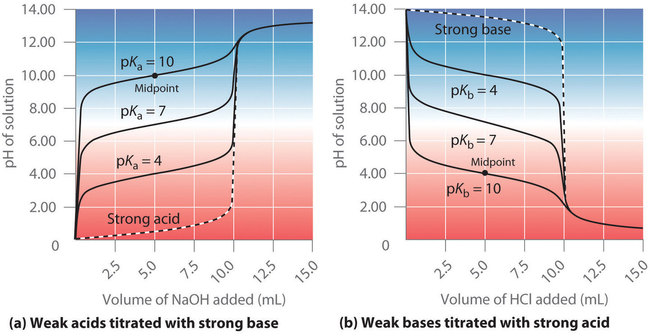
Figure \(\PageIndex{4}\): Effect of Acid or Base Strength on the Shape of Titration Curves. Unlike strong acids or bases, the shape of the titration curve for a weak acid or base depends on the \(pK_a\) or \(pK_b\) of the weak acid or base being titrated. (a) Solution pH as a function of the volume of 1.00 M \(NaOH\) added to 10.00 mL of 1.00 M solutions of weak acids with the indicated \(pK_a\) values. (b) Solution pH as a function of the volume of 1.00 M HCl added to 10.00 mL of 1.00 M solutions of weak bases with the indicated \(pK_b\) values. The shapes of the two sets of curves are essentially identical, but one is flipped vertically in relation to the other. Midpoints are indicated for the titration curves corresponding to \(pK_a\) = 10 and \(pK_b\) = 10.
One point in the titration of a weak acid or a weak base is particularly important: the midpoint, or half-equivalence point, of a titration is defined as the point at which exactly enough acid (or base) has been added to neutralize one-half of the acid (or the base) originally present and occurs halfway to the equivalence point. The midpoint is indicated in Figures \(\PageIndex{4a}\) and \(\PageIndex{4b}\) for the two shallowest curves. By definition, at the midpoint of the titration of an acid, [HA] = [A−]. Recall that the ionization constant for a weak acid is as follows:
\[K_a=\dfrac{[H_3O^+][A^−]}{[HA]}\]
If \([HA] = [A^−]\), this reduces to \(K_a = [H_3O^+]\). Taking the negative logarithm of both sides,
\[−\log K_a = −\log[H_3O+]\]
From the definitions of \(pK_a\) and pH, we see that this is identical to
\[pK_a = pH \tag{16.52}\]
Thus the pH at the midpoint of the titration of a weak acid is equal to the \(pK_a\) of the weak acid, as indicated in part (a) in Figure \(\PageIndex{4}\) for the weakest acid where we see that the midpoint for \(pK_a\) = 10 occurs at pH = 10. Titration methods can therefore be used to determine both the concentration and the \(pK_a\) (or the \(pK_b\)) of a weak acid (or a weak base).
The pH at the midpoint of the titration of a weak acid is equal to the \(pK_a\) of the weak acid.
The Relationship between Titrations and Buffers
There is a strong correlation between the effectiveness of a buffer solution and titration curves. Consider the schematic titration curve of a weak acid with a strong base shown in Figure \(\PageIndex{5}\). As indicated by the labels, the region around \(pK_a\) corresponds to the midpoint of the titration, when approximately half the weak acid has been neutralized. At this point, there will be approximately equal amounts of the weak acid and its conjugate base, forming a buffer mixture. This portion of the titration curve corresponds to the buffer region: it exhibits the smallest change in pH per increment of added strong base, as shown by the nearly horizontal nature of the curve in this region. The nearly flat portion of the curve extends only from approximately a pH value of 1 unit less than the \(pK_a\) to approximately a pH value of 1 unit greater than the \(pK_a\), correlating with the fact that buffer solutions usually have a pH that is within ±1 pH units of the \(pK_a\) of the acid component of the buffer.

In the region of the titration curve at the lower left, before the midpoint, the acid–base properties of the solution are dominated by the equilibrium for dissociation of the weak acid, corresponding to \(K_a\). In the region of the titration curve at the upper right, after the midpoint, the acid–base properties of the solution are dominated by the equilibrium for reaction of the conjugate base of the weak acid with water, corresponding to \(K_b\). However, we can calculate either \(K_a\) or \(K_b\) from the other because they are related by \(K_w\).
Indicators
In practice, most acid–base titrations are not monitored by recording the pH as a function of the amount of the strong acid or base solution used as the titrant. Instead, an acid–base indicator is often used that, if carefully selected, undergoes a dramatic color change at the pH corresponding to the equivalence point of the titration. Indicators are weak acids or bases that exhibit intense colors that vary with pH. The conjugate acid and conjugate base of a good indicator have very different colors so that they can be distinguished easily. Some indicators are colorless in the conjugate acid form but intensely colored when deprotonated (phenolphthalein, for example), which makes them particularly useful.
We can describe the chemistry of indicators by the following general equation:
where the protonated form is designated by HIn and the conjugate base by \(In^−\). The ionization constant for the deprotonation of indicator \(HIn\) is as follows:
\[ K_{In} =\dfrac{\left [ H^{+} \right ]\left [ In^{-} \right ]}{HIn} \label{Eq3}\]
The \(pK_{in}\) (its \(pK_a\)) determines the pH at which the indicator changes color.
Many different substances can be used as indicators, depending on the particular reaction to be monitored. In all cases, though, a good indicator must have the following properties:
- The color change must be easily detected.
- The color change must be rapid.
- The indicator molecule must not react with the substance being titrated.
- To minimize errors, the indicator should have a \(pK_{in}\) that is within one pH unit of the expected pH at the equivalence point of the titration.
Synthetic indicators have been developed that meet these criteria and cover virtually the entire pH range. Figure \(\PageIndex{6}\) shows the approximate pH range over which some common indicators change color and their change in color. In addition, some indicators (such as thymol blue) are polyprotic acids or bases, which change color twice at widely separated pH values.

It is important to be aware that an indicator does not change color abruptly at a particular pH value; instead, it actually undergoes a pH titration just like any other acid or base. As the concentration of HIn decreases and the concentration of In− increases, the color of the solution slowly changes from the characteristic color of HIn to that of In−. As we will see later, the [In−]/[HIn] ratio changes from 0.1 at a pH one unit below \(pK_{in}\) to 10 at a pH one unit above \(pK_{in}\) . Thus most indicators change color over a pH range of about two pH units.
We have stated that a good indicator should have a \(pK_{in}\) value that is close to the expected pH at the equivalence point. For a strong acid–strong base titration, the choice of the indicator is not especially critical due to the very large change in pH that occurs around the equivalence point. In contrast, using the wrong indicator for a titration of a weak acid or a weak base can result in relatively large errors, as illustrated in Figure \(\PageIndex{7}\). This figure shows plots of pH versus volume of base added for the titration of 50.0 mL of a 0.100 M solution of a strong acid (HCl) and a weak acid (acetic acid) with 0.100 M \(NaOH\). The pH ranges over which two common indicators (methyl red, \(pK_{in} = 5.0\), and phenolphthalein, \(pK_{in} = 9.5\)) change color are also shown. The horizontal bars indicate the pH ranges over which both indicators change color cross the HCl titration curve, where it is almost vertical. Hence both indicators change color when essentially the same volume of \(NaOH\) has been added (about 50 mL), which corresponds to the equivalence point. In contrast, the titration of acetic acid will give very different results depending on whether methyl red or phenolphthalein is used as the indicator. Although the pH range over which phenolphthalein changes color is slightly greater than the pH at the equivalence point of the strong acid titration, the error will be negligible due to the slope of this portion of the titration curve. Just as with the HCl titration, the phenolphthalein indicator will turn pink when about 50 mL of \(NaOH\) has been added to the acetic acid solution. In contrast, methyl red begins to change from red to yellow around pH 5, which is near the midpoint of the acetic acid titration, not the equivalence point. Adding only about 25–30 mL of \(NaOH\) will therefore cause the methyl red indicator to change color, resulting in a huge error.

In general, for titrations of strong acids with strong bases (and vice versa), any indicator with a \(pK_{in}\) between about 4.0 and 10.0 will do. For the titration of a weak acid, however, the pH at the equivalence point is greater than 7.0, so an indicator such as phenolphthalein or thymol blue, with \(pK_{in}\) > 7.0, should be used. Conversely, for the titration of a weak base, where the pH at the equivalence point is less than 7.0, an indicator such as methyl red or bromocresol blue, with \(pK_{in}\) < 7.0, should be used.
The existence of many different indicators with different colors and \(pK_{in}\) values also provides a convenient way to estimate the pH of a solution without using an expensive electronic pH meter and a fragile pH electrode. Paper or plastic strips impregnated with combinations of indicators are used as “pH paper,” which allows you to estimate the pH of a solution by simply dipping a piece of pH paper into it and comparing the resulting color with the standards printed on the container (Figure \(\PageIndex{8}\)).

Summary
Plots of acid–base titrations generate titration curves that can be used to calculate the pH, the pOH, the \(pK_a\), and the \(pK_b\) of the system. The shape of a titration curve, a plot of pH versus the amount of acid or base added, provides important information about what is occurring in solution during a titration. The shapes of titration curves for weak acids and bases depend dramatically on the identity of the compound. The equivalence point of an acid–base titration is the point at which exactly enough acid or base has been added to react completely with the other component. The equivalence point in the titration of a strong acid or a strong base occurs at pH 7.0. In titrations of weak acids or weak bases, however, the pH at the equivalence point is greater or less than 7.0, respectively. The pH tends to change more slowly before the equivalence point is reached in titrations of weak acids and weak bases than in titrations of strong acids and strong bases. The pH at the midpoint, the point halfway on the titration curve to the equivalence point, is equal to the \(pK_a\) of the weak acid or the \(pK_b\) of the weak base. Thus titration methods can be used to determine both the concentration and the \(pK_a\) (or the \(pK_b\)) of a weak acid (or a weak base). Acid–base indicators are compounds that change color at a particular pH. They are typically weak acids or bases whose changes in color correspond to deprotonation or protonation of the indicator itself.