
13.4: Energetics of Phase Changes
- Page ID
- 289443
\( \newcommand{\vecs}[1]{\overset { \scriptstyle \rightharpoonup} {\mathbf{#1}} } \)
\( \newcommand{\vecd}[1]{\overset{-\!-\!\rightharpoonup}{\vphantom{a}\smash {#1}}} \)
\( \newcommand{\id}{\mathrm{id}}\) \( \newcommand{\Span}{\mathrm{span}}\)
( \newcommand{\kernel}{\mathrm{null}\,}\) \( \newcommand{\range}{\mathrm{range}\,}\)
\( \newcommand{\RealPart}{\mathrm{Re}}\) \( \newcommand{\ImaginaryPart}{\mathrm{Im}}\)
\( \newcommand{\Argument}{\mathrm{Arg}}\) \( \newcommand{\norm}[1]{\| #1 \|}\)
\( \newcommand{\inner}[2]{\langle #1, #2 \rangle}\)
\( \newcommand{\Span}{\mathrm{span}}\)
\( \newcommand{\id}{\mathrm{id}}\)
\( \newcommand{\Span}{\mathrm{span}}\)
\( \newcommand{\kernel}{\mathrm{null}\,}\)
\( \newcommand{\range}{\mathrm{range}\,}\)
\( \newcommand{\RealPart}{\mathrm{Re}}\)
\( \newcommand{\ImaginaryPart}{\mathrm{Im}}\)
\( \newcommand{\Argument}{\mathrm{Arg}}\)
\( \newcommand{\norm}[1]{\| #1 \|}\)
\( \newcommand{\inner}[2]{\langle #1, #2 \rangle}\)
\( \newcommand{\Span}{\mathrm{span}}\) \( \newcommand{\AA}{\unicode[.8,0]{x212B}}\)
\( \newcommand{\vectorA}[1]{\vec{#1}} % arrow\)
\( \newcommand{\vectorAt}[1]{\vec{\text{#1}}} % arrow\)
\( \newcommand{\vectorB}[1]{\overset { \scriptstyle \rightharpoonup} {\mathbf{#1}} } \)
\( \newcommand{\vectorC}[1]{\textbf{#1}} \)
\( \newcommand{\vectorD}[1]{\overrightarrow{#1}} \)
\( \newcommand{\vectorDt}[1]{\overrightarrow{\text{#1}}} \)
\( \newcommand{\vectE}[1]{\overset{-\!-\!\rightharpoonup}{\vphantom{a}\smash{\mathbf {#1}}}} \)
\( \newcommand{\vecs}[1]{\overset { \scriptstyle \rightharpoonup} {\mathbf{#1}} } \)
\( \newcommand{\vecd}[1]{\overset{-\!-\!\rightharpoonup}{\vphantom{a}\smash {#1}}} \)
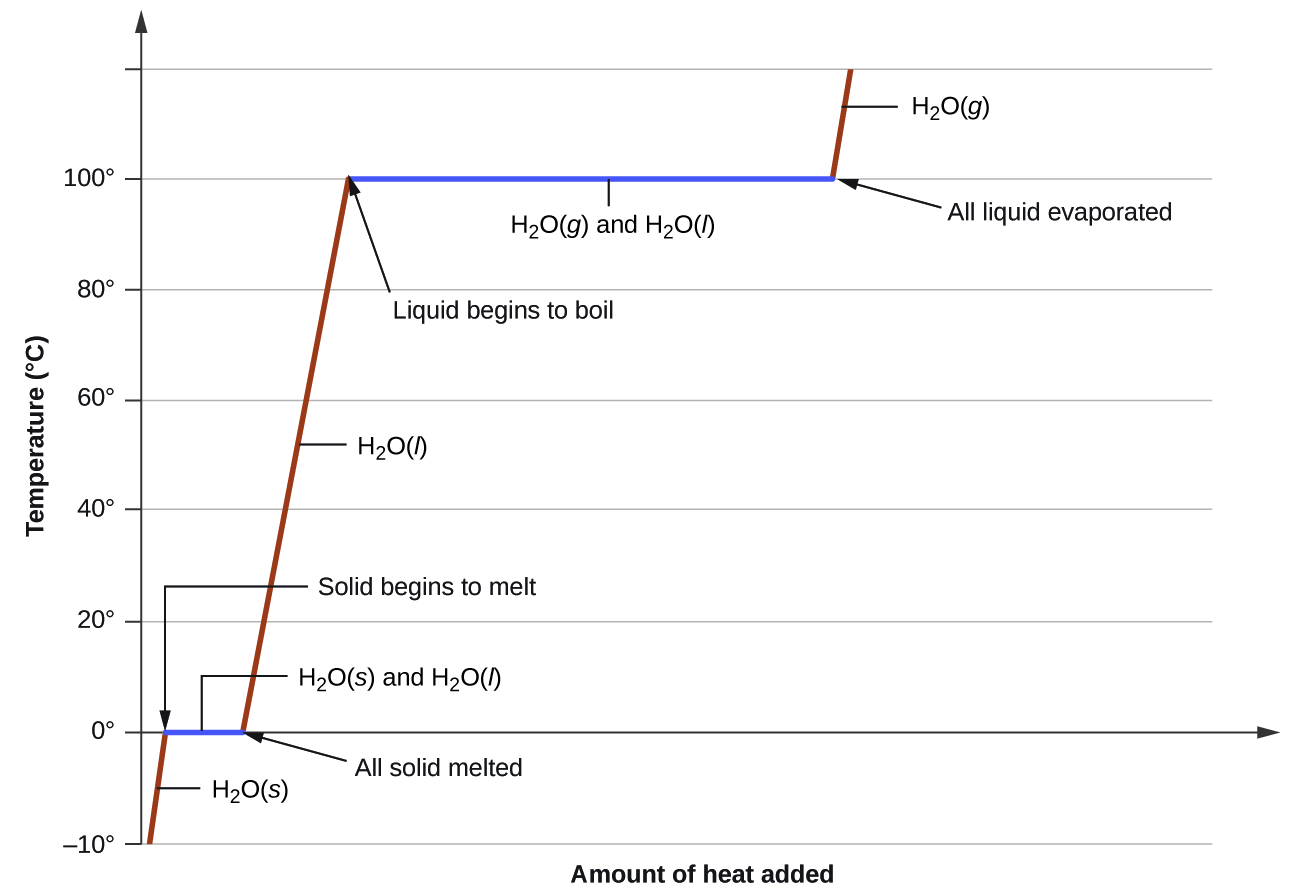
\(\newcommand{\avec}{\mathbf a}\) \(\newcommand{\bvec}{\mathbf b}\) \(\newcommand{\cvec}{\mathbf c}\) \(\newcommand{\dvec}{\mathbf d}\) \(\newcommand{\dtil}{\widetilde{\mathbf d}}\) \(\newcommand{\evec}{\mathbf e}\) \(\newcommand{\fvec}{\mathbf f}\) \(\newcommand{\nvec}{\mathbf n}\) \(\newcommand{\pvec}{\mathbf p}\) \(\newcommand{\qvec}{\mathbf q}\) \(\newcommand{\svec}{\mathbf s}\) \(\newcommand{\tvec}{\mathbf t}\) \(\newcommand{\uvec}{\mathbf u}\) \(\newcommand{\vvec}{\mathbf v}\) \(\newcommand{\wvec}{\mathbf w}\) \(\newcommand{\xvec}{\mathbf x}\) \(\newcommand{\yvec}{\mathbf y}\) \(\newcommand{\zvec}{\mathbf z}\) \(\newcommand{\rvec}{\mathbf r}\) \(\newcommand{\mvec}{\mathbf m}\) \(\newcommand{\zerovec}{\mathbf 0}\) \(\newcommand{\onevec}{\mathbf 1}\) \(\newcommand{\real}{\mathbb R}\) \(\newcommand{\twovec}[2]{\left[\begin{array}{r}#1 \\ #2 \end{array}\right]}\) \(\newcommand{\ctwovec}[2]{\left[\begin{array}{c}#1 \\ #2 \end{array}\right]}\) \(\newcommand{\threevec}[3]{\left[\begin{array}{r}#1 \\ #2 \\ #3 \end{array}\right]}\) \(\newcommand{\cthreevec}[3]{\left[\begin{array}{c}#1 \\ #2 \\ #3 \end{array}\right]}\) \(\newcommand{\fourvec}[4]{\left[\begin{array}{r}#1 \\ #2 \\ #3 \\ #4 \end{array}\right]}\) \(\newcommand{\cfourvec}[4]{\left[\begin{array}{c}#1 \\ #2 \\ #3 \\ #4 \end{array}\right]}\) \(\newcommand{\fivevec}[5]{\left[\begin{array}{r}#1 \\ #2 \\ #3 \\ #4 \\ #5 \\ \end{array}\right]}\) \(\newcommand{\cfivevec}[5]{\left[\begin{array}{c}#1 \\ #2 \\ #3 \\ #4 \\ #5 \\ \end{array}\right]}\) \(\newcommand{\mattwo}[4]{\left[\begin{array}{rr}#1 \amp #2 \\ #3 \amp #4 \\ \end{array}\right]}\) \(\newcommand{\laspan}[1]{\text{Span}\{#1\}}\) \(\newcommand{\bcal}{\cal B}\) \(\newcommand{\ccal}{\cal C}\) \(\newcommand{\scal}{\cal S}\) \(\newcommand{\wcal}{\cal W}\) \(\newcommand{\ecal}{\cal E}\) \(\newcommand{\coords}[2]{\left\{#1\right\}_{#2}}\) \(\newcommand{\gray}[1]{\color{gray}{#1}}\) \(\newcommand{\lgray}[1]{\color{lightgray}{#1}}\) \(\newcommand{\rank}{\operatorname{rank}}\) \(\newcommand{\row}{\text{Row}}\) \(\newcommand{\col}{\text{Col}}\) \(\renewcommand{\row}{\text{Row}}\) \(\newcommand{\nul}{\text{Nul}}\) \(\newcommand{\var}{\text{Var}}\) \(\newcommand{\corr}{\text{corr}}\) \(\newcommand{\len}[1]{\left|#1\right|}\) \(\newcommand{\bbar}{\overline{\bvec}}\) \(\newcommand{\bhat}{\widehat{\bvec}}\) \(\newcommand{\bperp}{\bvec^\perp}\) \(\newcommand{\xhat}{\widehat{\xvec}}\) \(\newcommand{\vhat}{\widehat{\vvec}}\) \(\newcommand{\uhat}{\widehat{\uvec}}\) \(\newcommand{\what}{\widehat{\wvec}}\) \(\newcommand{\Sighat}{\widehat{\Sigma}}\) \(\newcommand{\lt}{<}\) \(\newcommand{\gt}{>}\) \(\newcommand{\amp}{&}\) \(\definecolor{fillinmathshade}{gray}{0.9}\)Let's assume we have a block of ice, H2O (s), at –10°C and 1 atm of pressure, and we begin heating it. We would monitor the temperature and continue heating until the ice first turns into liquid water, H2O (l), and with enough heat, eventually to steam, H2O (g). If we were to make a plot of temperature vs. time, what would the graph look like? Is the plot linear? What would we observe at the melting point of water, 0°C, or at its boiling point at 100°C. Would the temperature shoot up? Would it level off?
Heating Curves
As heat is steadily added to the ice block, the water molecules begin to vibrate faster and faster as they absorb kinetic energy. Eventually, when the ice has warmed to 0°C, the added energy will start to overcome the attractive intermolecular forces that hold the water molecules in place while in its solid form. As the ice melts, its temperature does not rise. All of the energy that is being put into the ice goes into the melting process and not into any increase in temperature. During the melting process, the two states – solid and liquid – are in equilibrium with one another. If the system was isolated at that point and no energy was allowed to enter or leave, the ice-water mixture at 0°C would remain. Temperature is always constant during a change of state.
After the ice has completely melted, continued heating of the water will now increase the kinetic energy of the liquid molecules and the temperature will, once again, rise. Assuming an atmospheric pressure of 1 atm is maintained, the temperature will rise steadily until it reaches 100°C. At this point, the added energy from the heat will cause the liquid to begin to vaporize. As with the previous phase change, the temperature will remain at 100°C as the water molecules overcome the remaining intermolecular forces that hold them together in the liquid phase as they transition to the gaseous phase. Once all the liquid has completely boiled away, continued heating of the steam will allow the temperature to resume increasing, this time at temperatures above 100°C.
The experiment described above can be summarized in a graph called a heating curve, as shown in Figure \(\PageIndex{1}\):
Phase Change Energetics
The previous section described the phase transitions that took place heating water, causing it to change from a solid to a gas. The addition of heat energy to a system from its surroundings is an endothermic process. In other words, ice absorbs energy from the surroundings in order to transition into liquid. Likewise, liquid water absorbs energy from the surroundings in order to transition into a gas. This means that phase transitions in the opposite direction are exothermic – they release energy to the surroundings. Converting steam to liquid water is exothermic, as is converting liquid water to ice.
The energetics of phase transitions are summarized in Figure \(\PageIndex{2}\) below. The gaseous phase of a substance is the one with the highest energy, while the solid phase of a substance is the one with the lowest energy. In order to move to a higher energy phase, energy must be absorbed from the surroundings (endothermic). In order to move to a lower energy phase, energy must be released to the surroundings (exothermic).
Applications of Phase Changes
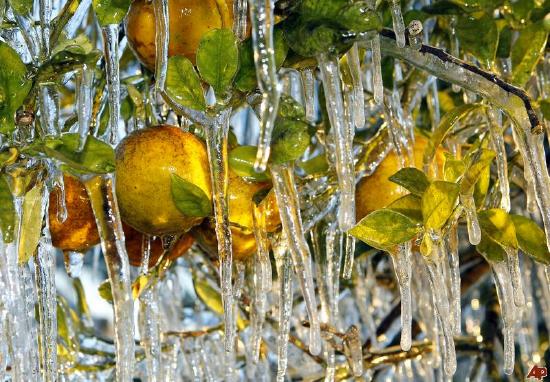
Many plants are damaged when they experience frost or a hard freeze. In northern climates, a late spring frost can damage young plants or the buds or blossoms on fruit trees. In southern climates, where temperatures rarely go below 0°C (32°F), a frost may be particularly damaging to the fruits and trees.
It likely seems ironic, but one of the ways that growers protect plants and trees from damage due to frost or a hard freeze is by spraying them with water (see Figure \(\PageIndex{3}\)) while the temperatures approach and go below the freezing point. Ice begins to accumulate on the trees. How can this be a good thing? As we can see from the graphic above, the freezing is an exothermic process – it releases energy to the surroundings. In other words, heat energy is released to the surrounding buds, flowers, foliage, or fruit as long as water continues to freeze. Furthermore, as a layer of ice forms, it acts as an insulation from the freezing temperatures. Cool, huh?

An application of phase change energetics that you have likely experienced is sweating. When humans sweat, sweat droplets and/or a thin layer layer of sweat covers the skin. As the water in the sweat evaporates, the faster molecules are able to overcome the intermolecular attractions that hold them together, leaving behind the slower moving molecules. We observe slower moving molecules as being cooler. Additionally, from the phase change energetics graphic in Figure \(\PageIndex{2}\) above, we see that the transition from a liquid into a gas is an endothermic process. In other words, heat is absorbed from the surroundings – in this case, the surroundings are our skin and bodies. The effect is to cool us off. This is also why pigs and other animals roll in mud or water on a warm and sunny day. As the water evaporates, it serves to keep them cool.
Figure \(\PageIndex{4}\) shows how a central air conditioner works. Outside of the house sits the central air unit. If you've ever stood outside and felt the air coming off an air conditioner, whether it is a central air unit or a window unit, you will notice that the air feels warm or even hot. That's because there is a hose or pipe that carries a substance in the gaseous phase from the inside of the house to the outside where it goes through the process of condensation in the compressor. Referring to the graphic in Figure \(\PageIndex{2}\) once again, we can see that the the transition from a gas to a liquid is exothermic – heat is released to the surroundings.
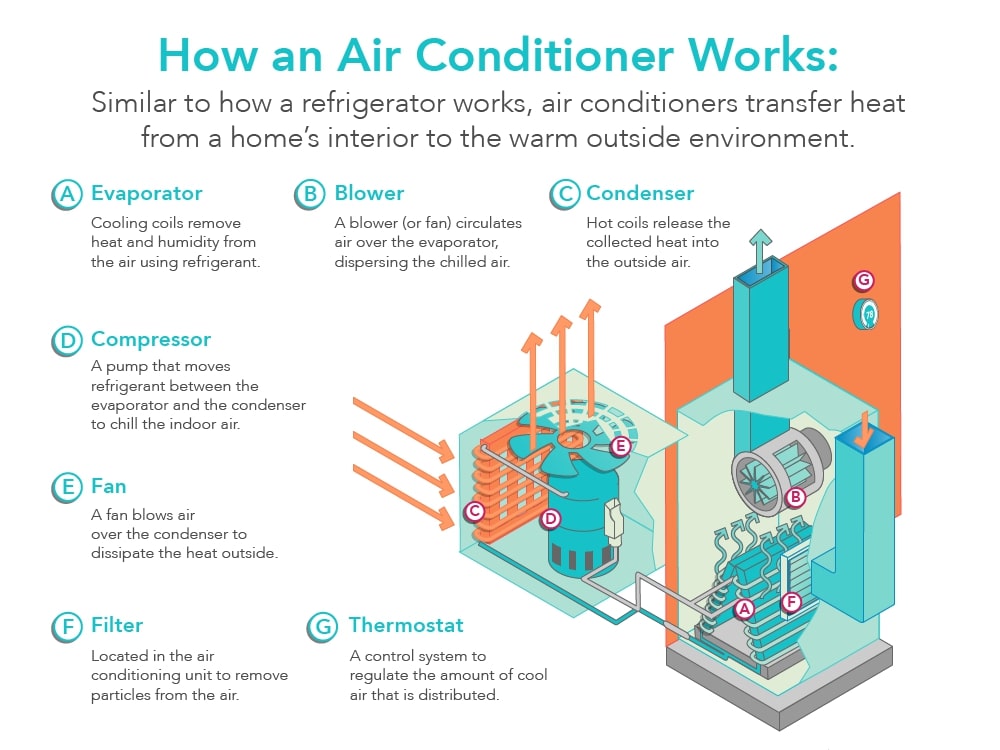
From here, the liquid is sent back into the house where it goes through the process of evaporation in the evaporator. The process of evaporation, the transition from a liquid to a gas, is endothermic – heat is absorbed from the surroundings. In this case, the surroundings are the inside of your house. A fan blows air from the inside of the house over the coils in the evaporator to make the process more efficient.
Refrigerators and freezers work in a similar manner to air conditioners. The compressor sits outside the insulated portion of the refrigerator or freezer, which is where the condensation takes place and why you feel warm air coming out from underneath or behind the unit. In most refrigerators and freezers, the evaporator coils remain hidden in the walls or shelves within the insulated portion of the unit. This is where the evaporation takes place and why it feels cool inside the unit.
✅ Example \(\PageIndex{1}\)
Which phase changes are endothermic?
Solution
Referring to Figure \(\PageIndex{2}\), any phase change to a state of higher energy is endothermic, i.e. it absorbs energy from the surroundings. The phase changes include:
- melting (solid to liquid)
- boiling/evaporation (liquid to gas)
- sublimation (solid to gas)
✏️ Exercise \(\PageIndex{1}\)
What happens to the temperature during a phase change when a substance is being heated? Explain why.
- Answer
- The temperature remains constant, because the energy is being used to overcome intermolecular forces that:
- hold the particles in a solid in fixed positions when a substance is melting.
- hold the particles in a liquid in close contact when a substance is evaporating or boiling.
Summary
- The temperature of a substance remains constant while a phase change occurs.
- Endothermic processes go from low energy to high energy: solid to liquid to gas.
- Exothermic processes go from high energy to low energy: gas to liquid to solid.
- Energetics of phase transitions have multiple real-world applications in botany and cooling our homes and food.
This page is shared under CK-12 and CC BY-NC-SA 4.0 licenses and was authored, remixed, and/or curated by Lance S. Lund (Anoka-Ramsey Community College), Paul Flowers (University of North Carolina - Pembroke), Klaus Theopold (University of Delaware) and Richard Langley (Stephen F. Austin State University) with contributing authors; Anonymous, Melissa Alviar-Agnew, and Henry Agnew. Original sources: https://www.ck12.org/c/chemistry/ and https://openstax.org/details/books/chemistry-2e.
