Graphical Treatment of Acid-Base Systems
- Page ID
- 3493
\( \newcommand{\vecs}[1]{\overset { \scriptstyle \rightharpoonup} {\mathbf{#1}} } \)
\( \newcommand{\vecd}[1]{\overset{-\!-\!\rightharpoonup}{\vphantom{a}\smash {#1}}} \)
\( \newcommand{\id}{\mathrm{id}}\) \( \newcommand{\Span}{\mathrm{span}}\)
( \newcommand{\kernel}{\mathrm{null}\,}\) \( \newcommand{\range}{\mathrm{range}\,}\)
\( \newcommand{\RealPart}{\mathrm{Re}}\) \( \newcommand{\ImaginaryPart}{\mathrm{Im}}\)
\( \newcommand{\Argument}{\mathrm{Arg}}\) \( \newcommand{\norm}[1]{\| #1 \|}\)
\( \newcommand{\inner}[2]{\langle #1, #2 \rangle}\)
\( \newcommand{\Span}{\mathrm{span}}\)
\( \newcommand{\id}{\mathrm{id}}\)
\( \newcommand{\Span}{\mathrm{span}}\)
\( \newcommand{\kernel}{\mathrm{null}\,}\)
\( \newcommand{\range}{\mathrm{range}\,}\)
\( \newcommand{\RealPart}{\mathrm{Re}}\)
\( \newcommand{\ImaginaryPart}{\mathrm{Im}}\)
\( \newcommand{\Argument}{\mathrm{Arg}}\)
\( \newcommand{\norm}[1]{\| #1 \|}\)
\( \newcommand{\inner}[2]{\langle #1, #2 \rangle}\)
\( \newcommand{\Span}{\mathrm{span}}\) \( \newcommand{\AA}{\unicode[.8,0]{x212B}}\)
\( \newcommand{\vectorA}[1]{\vec{#1}} % arrow\)
\( \newcommand{\vectorAt}[1]{\vec{\text{#1}}} % arrow\)
\( \newcommand{\vectorB}[1]{\overset { \scriptstyle \rightharpoonup} {\mathbf{#1}} } \)
\( \newcommand{\vectorC}[1]{\textbf{#1}} \)
\( \newcommand{\vectorD}[1]{\overrightarrow{#1}} \)
\( \newcommand{\vectorDt}[1]{\overrightarrow{\text{#1}}} \)
\( \newcommand{\vectE}[1]{\overset{-\!-\!\rightharpoonup}{\vphantom{a}\smash{\mathbf {#1}}}} \)
\( \newcommand{\vecs}[1]{\overset { \scriptstyle \rightharpoonup} {\mathbf{#1}} } \)
\( \newcommand{\vecd}[1]{\overset{-\!-\!\rightharpoonup}{\vphantom{a}\smash {#1}}} \)
Most students in General Chemistry are never taken beyond the traditional, algebraic treatment of acid-base equilibria. This is unfortunate for the following reasons:
- It can be an awful lot of work. Have you ever noticed that many of the acid-base systems most commonly encountered (phosphate, citrate, salts such as ammonium acetate, amino acids, EDTA) are rarely treated in standard textbooks? Treating these analytically requires setting up a series of mass- and charge-balance expressions which must be solved simultaneously.
- Most algebraic treatments are approximations anyway. Did you know, for example, that the exact calculation of the pH of a solution of a monoprotic weak acid requires the solution of a cubic equation? Carrying out the same operation for H3PO4 requires solution of a fifth-order polynomial! To simplify the calculations, approximations are made, sometimes unwittingly. The algebraic calculations that we actually carry out are almost never exact in the first place!
- Equilibrium constants are not really. Even if you carry out an exact calculation, the results will never be any more reliable than the equilibrium constants you use. But the values of these vary with the temperature and especially with the ionic content of the solution. The values listed in tables are rarely applicable to practical applications.
- All you get is a number: Algebraic approaches contribute almost nothing to the larger view of how an acid-base system behaves as the pH is changed.
Yes, I still teach my students how to set up a quadratic equation to calculate the pH of an acetic acid solution, but I insist that they also be able to do the same thing graphically. The major advantages of the graphical approach:
- Easy to do: the graphs are easily constructed and generally give pH values as good as those from algebra. Even if you sketch out the graph on the back of an envelope and without a straightedge, you can get results to within half a pH unit. A good way to amaze your friends!
- Provides an overall picture of the acid-base system. A glance at the graph shows you the approximate concentrations of all species present over a range of pH values, thus providing a bird's-eye view of the acid-base system as s whole.
- Reinforces important principles. In learning to sketch out and interpret log-concentration vs. pH plots, the student must consider such things as the nature of the equilibria occurring in solutions of the pure acid and of its conjugate base, conservation of protons, and the significance of the pK.
- Allows treatment of a wider range of systems. Graphical estimation of the pH of solutions of acids, bases and ampholytes of such as phosphate, citrate, amino acids, EDTA etc. are not all that much more difficult than treating a monoprotic or diprotic system.
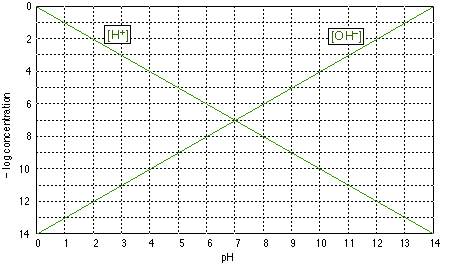
Log-C vs. pH graphs are plotted on coordinates of the form shown above.Be sure you understand the y-axis; "4", for example, corresponds to a concentration of 10–4 M for whatever species we plot. Note that concentrations increases with height on this graph, and that those less than about 10–8 M are usually negligible for most practical purposes.
The two plots shown on this graph are no more than formal definitions of pH and pOH; for example, when the pH is 4, –log pH = 4 and [H+] = 10–4 M. (Notice that the ordinate is the negative of the log concentration, so the smaller numbers near the top of the scale refer to larger concentrations.)
The above graph of is of no use by itself, but it forms the basis for the construction of other graphs specific to a given acid-base system. You should be able to draw this graph from memory.
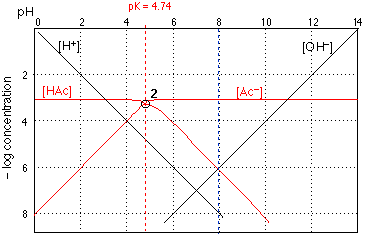
The H+ and OH– log concentration lines are the same ones that we saw in Figure 1. The other two lines show how the concentrations of CH3COOH and of the the acetate ion vary with the pH of the solution.
How do we construct the plots for [HAc] and [Ac–]? If you look carefully at Fig 2, you will observe that each line is horizontal at the top, and then bends to become diagonal. There are thus three parameters that define these two lines: the location of their top, horizontal parts, their crossing points with the other lines, and the slopes of their diagonal parts.
The horizontal sections of these lines are placed at 3 on the ordinate scale, corresponding to the nominal acid concentration of
10–3 M. This value corresponds to
Ca = [HAc] + [Ac–]
which you will recognize as the mass balance condition saying that "acetate" is conserved; Ca is the nominal "acid concentration" of the solution, and is to be distinguished from the concentration of the actual acidic species HAc.
At low pH values (strongly acidic solution) the acetate species is completely protonated, so [HAc] = 10–3 M and [Ac–]=0. Similarly, at high pH, –log [Ac–]=3$ and [HAc]=0. If the solution had some other nominal concentration, such as 0.1 M or 10–5, we would simply move the pair of lines up or down.
The diagonal parts of the lines have slopes of equal magnitude but opposite sign. It can easily be shown that these slopes d(–log [HAc]}/d{pH} etc.are +-1, corresponding to the slopes of the [OH–] and [H+] lines. Using the latter as a guide, the diagonal portions of lines 3 and 4 Can easily be drawn.
The crossing point of the plots for the acid and base forms corresponds to the condition [HAc]=[Ac–]. You already know that this condition holds when the pH is the same as the pKa of the acid, so the the pH coordinate of the crossing point must be 4.75 for acetic acid. The vertical location of the crossing point is found as follows: When [HAc] = [Ac], the concentration of each species must be Ca/2 or in this case 0.0005 M. The logarithm of 1/2 is 0.3, so a 50% reduction in the concentration of a species will shift its location down on the log concentration scale by 0.3 unit. The crossing point therefore falls at a log-C value of (–3) – 0.3 = –3.3. Knowing the value of log100.5 is one of the few new "facts" that must be learned in order to construct these graphs.
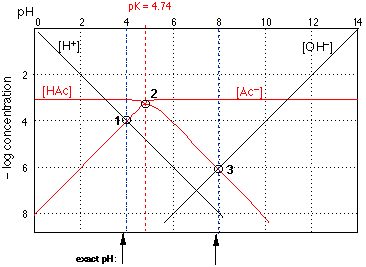 Figure 3
Of special interest in acid-base chemistry are the pH values of a solution of an acid and of its conjugate base in pure water; as you know, these correspond to the beginning and equivalence points in the titration of an acid with a strong base.
pH of an acid in pure water
Except for the special cases of extremely dilute solutions or very weak acids in which the autoprotolysis of water is a major contributor to the hydrogen ion concentration, the pH of a solution of an acid in pure water will be determined largely by the extent of the reaction
\[\ce{HAc + H2O -> H3O^{+} + Ac^{–}}\]
so that at equilibrium, the approximate relation \(\ce{[H3O^{+}] \approx [Ac^{–}]}\) will hold. The equivalence of these two concentrations corresponds to the point labeled 1 in Fig 3; this occurs at a pH of about 3.7, and this is the pH of a 0.001M solution of acetic acid in pure water.
pH of a solution of the conjugate base
Now consider a 0.001M solution of sodium acetate in pure water. This, you will recall, corresponds to the composition of a solution of acetic acid that has been titrated to its equivalence point with sodium hydroxide. The acetate ion, being the conjugate base of a weak acid, will undergo hydrolysis according to
\[\ce{Ac– + H2O -> HAc + OH–}\]
As long as we can neglect the contribution of OH– from the autoprotolysis of the solvent, we can expect the relation [HAc]=[OH–] to be valid in such a solution. The equivalence of these two concentrations corresponds to the intersection point 3 in Fig 3; a 0.001M solution of sodium or potassium acetate should have a pH of about 8.
Putting it all together
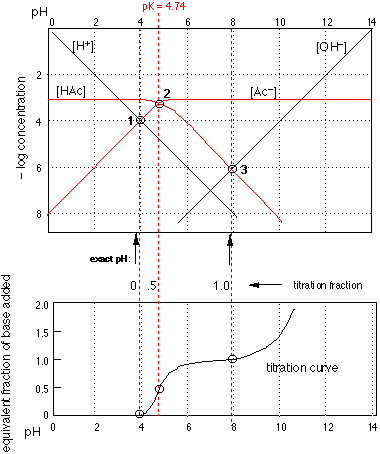
The top part of this figure is the log-C plot for acetic acid that we saw previously, the blue dashed vertical lines now showing the pH of a 0.001M solution of HAc before and and after its titration with strong base.
The extension of these lines (and the one representing the pK) down to the bottom part of the figure locates the three points that define the titration curve for the acid.
Take a moment to verify that the lower figure is indeed a titration curve; that is, a plot of the pH as a function of the fraction of acid neutralized.
These two plots nicely sum up the complete acid-base chemistry of a monoprotic system.

Diprotic acids are no more complicated to treat graphically than monoprotic acids-- something that definitely cannot be said for exact algebraic treatment! The above example for oxalic acid (H2A = HOOCCOOH) is just the superposition for separate plots of the two acid-base systems H2A-HA– and HA–-A2– whose pKs are 1.2 and 4.2. The system points corresponding to 0.01M solutions of pure H2A; and A2– are determined just as in the monoprotic case. For a solution of the ampholyte, several equilibria can be written, but the one that dominates is
\[2 HA^– \rightleftharpoons H_2A + A^{2–}\]
which leads to the approximation
\[[HA^–] \approx [A^{2–}]\]
Thus fixing the pH at about 2.7. This same result can be obtained from thewell known approximation
\[pH = \dfrac{pK_1 + pK_2}{2}\]
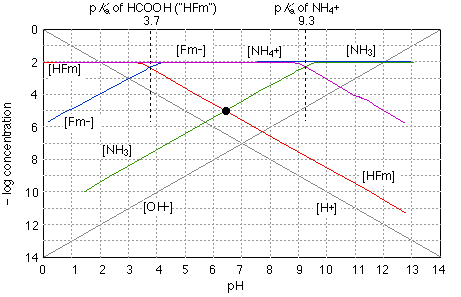
The quantitative treatment of a solution of a salt of a weak acid and a weak base is algebraically complicated, even when done to the crudest approximation. Graphically, it is a piece of cake! As you can see above, we just construct plots of the two acid-base system on the same graph. The stoichiometry of the salt defines the system point at about pH 6.3, showing that hydrolyses of the two systems does not quite "cancel out". Of course, this is still an approximation that neglects ionization of either the anion or cation, but it is probably as valid as any calculation that is likely to be carried out ordinarily-available data.
The Phosphate system
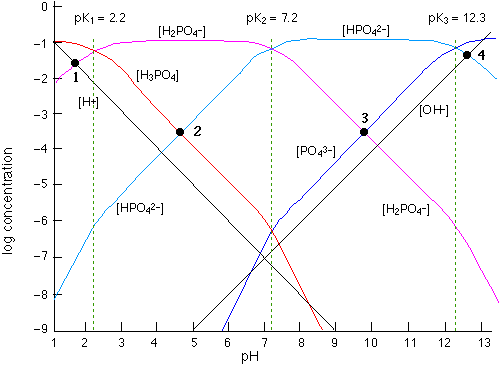
... but why stop at diprotic acids? With the phosphate system we have three pKs, and thus two ampholytes H2PO4–and HPO42–.
A glance at the graph allows one to estimate the relative amounts of the two major species at any pH.
The pH of a solution of the acid H3PO4 or of the base PO43– is found from the system points 1 and 4 which are constructed in the same way as those for a monoprotic acid.
System points 2 and 3 for solutions of the two ampholytes provide only approximate values pH values because of the effects of competing equilibria, but the accuracy is good enough for most applications.
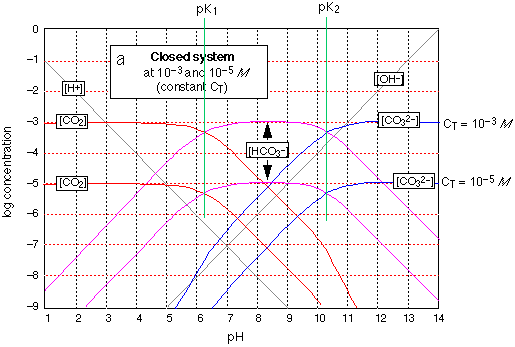
Here it is -- the most important of all acid-base systems in natural waters and physiology! Nothing new as far as theory goes -- see the explanation given for oxalic acid. What's different here is the two sts of plots. The lower (more dilute) one corresponds to the concentration of dissolved CO2 present in water in equlibrium with the atmosphere having the normal CO2 partial pressure of about .0005 atm. You can see from this that when pure water is exposed to the atmosphere, its pH will fall from 7 to about 5 (but see the last paragraph below); thus all rain is in a sense "acid rain".
Note that around pH 8 (the pH of the ocean and of blood), over 99% of all carbonate is in the form of bicarbonate HCO3–. As a result, the ocean acts as a sink for atmospheric CO2 and contains about 50 times as much as does the atmosphere. Similarly, CO2 resulting from cellular respiration is converted to HCO3– for transport through the blood stream, and is converted back to CO2 in the lungs.
The upper (.001M) set of graphs correspond to the approximate carbonate content of natural waters in contact with rocks and sediments (which normally contain carbonate components). It describes the situation in lakes, streams, ground waters and the ocean. Notice how the pH of this more concentrated CO2 solution is lower (about 2, compared to 4.3), which is just what you would expect. This is the reason the pH of an algae-containing pond rises during the day (when CO2 is being consumed by photosynthesis) and falls at night (CO2 restored by respiration.)
The term "closed system" in the caption at the top of the graph means that CT, the sum of the concentrations of all three carbonate species, is assumed constant here. For an open system the plots for the bicarbonate and carbonate concentrations would be dramatically different because an alkaline solution open to the atmosphere has access to an infinite supply of CO2 and will absorb it up to the solubility limit of sodium carbonate. (You may recall that a common test for CO2 is to watch for a precipitate to appear in a saturated solution of calcium hydroxide.) Thus the estimate of pH=5 for pure water exposed to the atmosphere is not quite correct; using an "open system" plot, a somewhat lower pH, around 4.5, will be found. It turns out, however, that for many practical situations, the relatively slow transport of CO2 between air and water makes the "closed system" predictions reasonably accurate within the time scale of interest.
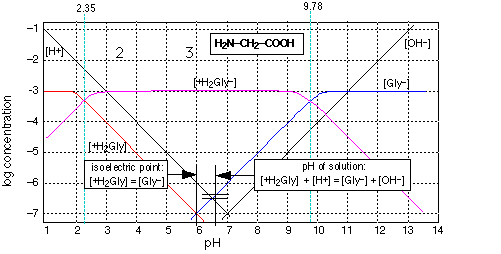
Glycine is the simplest of the amino acids, the building blocks of proteins. It is also a zwitterion (the word comes from the German term for "hermaphrodite" ) which chemists use to denote a species that possesses both an acidic and a basic functional group, both of which can simultaneously exist in their ionized (conjugate) forms. Examination of this graph shows that the double-ionic form (the true zwitterion) reigns supreme between pH 3 and 9; outside this range, the glycinium anion or the glycinate cation prevails. Notice that the completely un-ionized form does not exist in solution.
The log-C vs. pH diagram is constructed as s superposition of plots for each conjugate pair at its respective pKa. Note especially that the pH of a solution of glycine does lie exactly at the crossing point [Gly–] = [H+], but is slightly displaced from it according to the proton balance equation shown in the inset on the graph. The other important quantity shown on this graph is the isoelectric point, which is the pH at which the concentrations of the cationic and anionic forms are identical.
It goes without saying that treating this system algebraically would be far more complicated than the results would warrant for most applications.
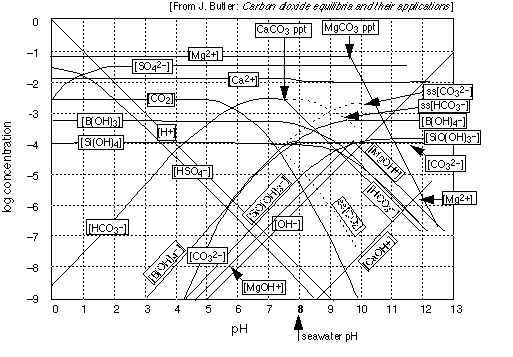
Note especially that
- the only really important pH on this graph is 8, the approximate pH of the natural ocean.
- The pH of the ocean is controlled mainly by the carbonate system because it is more concentrated than the two minor buffering systems, borate and silicate.
- The surface waters of the ocean are everywhere supersaturated in calcium bicarbonate and in CO2 , as shown by the dotted curves (the "ss[CO2 ]" label is the illegible one-- sorry!)
- Ion-pair complexes such as MgOH+ are significant species in seawater; there are many others.
Contributors and Attributions
Stephen Lower, Professor Emeritus (Simon Fraser U.) Chem1 Virtual Textbook


