
Infrared spectroscopy 2
- Page ID
- 15739
\( \newcommand{\vecs}[1]{\overset { \scriptstyle \rightharpoonup} {\mathbf{#1}} } \)
\( \newcommand{\vecd}[1]{\overset{-\!-\!\rightharpoonup}{\vphantom{a}\smash {#1}}} \)
\( \newcommand{\dsum}{\displaystyle\sum\limits} \)
\( \newcommand{\dint}{\displaystyle\int\limits} \)
\( \newcommand{\dlim}{\displaystyle\lim\limits} \)
\( \newcommand{\id}{\mathrm{id}}\) \( \newcommand{\Span}{\mathrm{span}}\)
( \newcommand{\kernel}{\mathrm{null}\,}\) \( \newcommand{\range}{\mathrm{range}\,}\)
\( \newcommand{\RealPart}{\mathrm{Re}}\) \( \newcommand{\ImaginaryPart}{\mathrm{Im}}\)
\( \newcommand{\Argument}{\mathrm{Arg}}\) \( \newcommand{\norm}[1]{\| #1 \|}\)
\( \newcommand{\inner}[2]{\langle #1, #2 \rangle}\)
\( \newcommand{\Span}{\mathrm{span}}\)
\( \newcommand{\id}{\mathrm{id}}\)
\( \newcommand{\Span}{\mathrm{span}}\)
\( \newcommand{\kernel}{\mathrm{null}\,}\)
\( \newcommand{\range}{\mathrm{range}\,}\)
\( \newcommand{\RealPart}{\mathrm{Re}}\)
\( \newcommand{\ImaginaryPart}{\mathrm{Im}}\)
\( \newcommand{\Argument}{\mathrm{Arg}}\)
\( \newcommand{\norm}[1]{\| #1 \|}\)
\( \newcommand{\inner}[2]{\langle #1, #2 \rangle}\)
\( \newcommand{\Span}{\mathrm{span}}\) \( \newcommand{\AA}{\unicode[.8,0]{x212B}}\)
\( \newcommand{\vectorA}[1]{\vec{#1}} % arrow\)
\( \newcommand{\vectorAt}[1]{\vec{\text{#1}}} % arrow\)
\( \newcommand{\vectorB}[1]{\overset { \scriptstyle \rightharpoonup} {\mathbf{#1}} } \)
\( \newcommand{\vectorC}[1]{\textbf{#1}} \)
\( \newcommand{\vectorD}[1]{\overrightarrow{#1}} \)
\( \newcommand{\vectorDt}[1]{\overrightarrow{\text{#1}}} \)
\( \newcommand{\vectE}[1]{\overset{-\!-\!\rightharpoonup}{\vphantom{a}\smash{\mathbf {#1}}}} \)
\( \newcommand{\vecs}[1]{\overset { \scriptstyle \rightharpoonup} {\mathbf{#1}} } \)
\(\newcommand{\longvect}{\overrightarrow}\)
\( \newcommand{\vecd}[1]{\overset{-\!-\!\rightharpoonup}{\vphantom{a}\smash {#1}}} \)
\(\newcommand{\avec}{\mathbf a}\) \(\newcommand{\bvec}{\mathbf b}\) \(\newcommand{\cvec}{\mathbf c}\) \(\newcommand{\dvec}{\mathbf d}\) \(\newcommand{\dtil}{\widetilde{\mathbf d}}\) \(\newcommand{\evec}{\mathbf e}\) \(\newcommand{\fvec}{\mathbf f}\) \(\newcommand{\nvec}{\mathbf n}\) \(\newcommand{\pvec}{\mathbf p}\) \(\newcommand{\qvec}{\mathbf q}\) \(\newcommand{\svec}{\mathbf s}\) \(\newcommand{\tvec}{\mathbf t}\) \(\newcommand{\uvec}{\mathbf u}\) \(\newcommand{\vvec}{\mathbf v}\) \(\newcommand{\wvec}{\mathbf w}\) \(\newcommand{\xvec}{\mathbf x}\) \(\newcommand{\yvec}{\mathbf y}\) \(\newcommand{\zvec}{\mathbf z}\) \(\newcommand{\rvec}{\mathbf r}\) \(\newcommand{\mvec}{\mathbf m}\) \(\newcommand{\zerovec}{\mathbf 0}\) \(\newcommand{\onevec}{\mathbf 1}\) \(\newcommand{\real}{\mathbb R}\) \(\newcommand{\twovec}[2]{\left[\begin{array}{r}#1 \\ #2 \end{array}\right]}\) \(\newcommand{\ctwovec}[2]{\left[\begin{array}{c}#1 \\ #2 \end{array}\right]}\) \(\newcommand{\threevec}[3]{\left[\begin{array}{r}#1 \\ #2 \\ #3 \end{array}\right]}\) \(\newcommand{\cthreevec}[3]{\left[\begin{array}{c}#1 \\ #2 \\ #3 \end{array}\right]}\) \(\newcommand{\fourvec}[4]{\left[\begin{array}{r}#1 \\ #2 \\ #3 \\ #4 \end{array}\right]}\) \(\newcommand{\cfourvec}[4]{\left[\begin{array}{c}#1 \\ #2 \\ #3 \\ #4 \end{array}\right]}\) \(\newcommand{\fivevec}[5]{\left[\begin{array}{r}#1 \\ #2 \\ #3 \\ #4 \\ #5 \\ \end{array}\right]}\) \(\newcommand{\cfivevec}[5]{\left[\begin{array}{c}#1 \\ #2 \\ #3 \\ #4 \\ #5 \\ \end{array}\right]}\) \(\newcommand{\mattwo}[4]{\left[\begin{array}{rr}#1 \amp #2 \\ #3 \amp #4 \\ \end{array}\right]}\) \(\newcommand{\laspan}[1]{\text{Span}\{#1\}}\) \(\newcommand{\bcal}{\cal B}\) \(\newcommand{\ccal}{\cal C}\) \(\newcommand{\scal}{\cal S}\) \(\newcommand{\wcal}{\cal W}\) \(\newcommand{\ecal}{\cal E}\) \(\newcommand{\coords}[2]{\left\{#1\right\}_{#2}}\) \(\newcommand{\gray}[1]{\color{gray}{#1}}\) \(\newcommand{\lgray}[1]{\color{lightgray}{#1}}\) \(\newcommand{\rank}{\operatorname{rank}}\) \(\newcommand{\row}{\text{Row}}\) \(\newcommand{\col}{\text{Col}}\) \(\renewcommand{\row}{\text{Row}}\) \(\newcommand{\nul}{\text{Nul}}\) \(\newcommand{\var}{\text{Var}}\) \(\newcommand{\corr}{\text{corr}}\) \(\newcommand{\len}[1]{\left|#1\right|}\) \(\newcommand{\bbar}{\overline{\bvec}}\) \(\newcommand{\bhat}{\widehat{\bvec}}\) \(\newcommand{\bperp}{\bvec^\perp}\) \(\newcommand{\xhat}{\widehat{\xvec}}\) \(\newcommand{\vhat}{\widehat{\vvec}}\) \(\newcommand{\uhat}{\widehat{\uvec}}\) \(\newcommand{\what}{\widehat{\wvec}}\) \(\newcommand{\Sighat}{\widehat{\Sigma}}\) \(\newcommand{\lt}{<}\) \(\newcommand{\gt}{>}\) \(\newcommand{\amp}{&}\) \(\definecolor{fillinmathshade}{gray}{0.9}\)The covalent bonds in molecules are not rigid sticks or rods, such as found in molecular model kits, but are more like stiff springs that can be stretched and bent. In addition to the facile rotation of groups about single bonds, molecules experience a wide variety of vibrational motions, characteristic of their component atoms. Consequently, virtually all organic compounds will absorb infrared radiation that corresponds in energy to these vibrations. Infrared spectrometers, similar in principle to the UV-Visible spectrometer, permit chemists to obtain absorption spectra of compounds that are a unique reflection of their molecular structure.
Below are some characteristic vibrational modes of organic molecules:
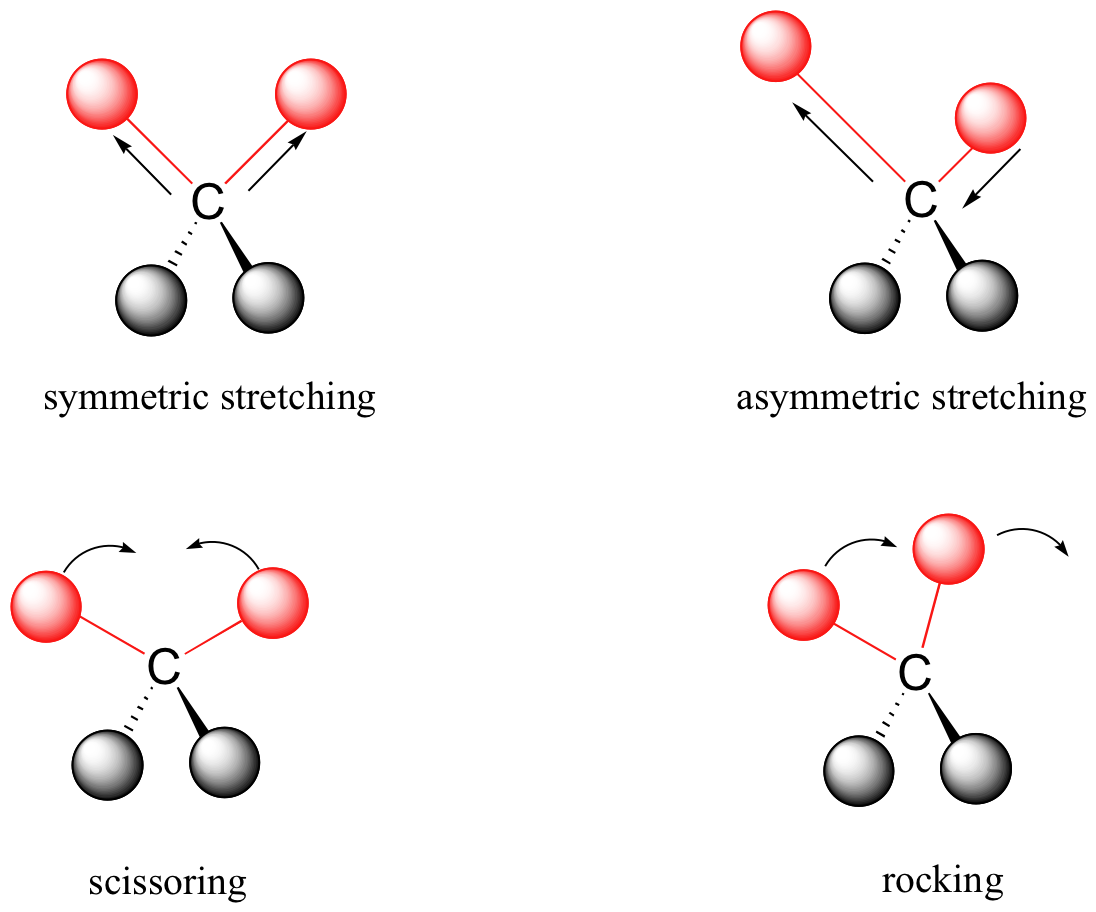
The energy of molecular vibration is quantized rather than continuous, meaning that a molecule can only stretch and bend at certain 'allowed' frequencies. If a molecule is exposed to electromagnetic radiation that matches the frequency of one of its vibrational modes, it will in most cases absorb energy from the radiation and jump to a higher vibrational energy state - what this means is that the amplitude of the vibration will increase, but the vibrational frequency will remain the same. The difference in energy between the two vibrational states is equal to the energy associated with the wavelength of radiation that was absorbed. It turns out that it is the infrared region of the electromagnetic spectrum which contains frequencies corresponding to the vibrational frequencies of organic bonds.
Let's take 2-hexanone as an example. Picture the carbonyl bond of the ketone group as a spring. This spring is constantly bouncing back and forth, stretching and compressing, pushing the carbon and oxygen atoms further apart and then pulling them together. This is the stretching mode of the carbonyl bond. In the space of one second, the spring 'bounces' back and forth 5.15 x 10¹³ times - in other words, the ground-state frequency of carbonyl stretching for a the ketone group is about 5.15 x 10¹³ Hz.
If our ketone sample is irradiated with infrared light, the carbonyl bond will specifically absorb light with this same frequency, which by equations 4.1 and 4.2 corresponds to a wavelength of 5.83 x 10⁻⁶ m and an energy of 4.91 kcal/mol. When the carbonyl bond absorbs this energy, it jumps up to an excited vibrational state.
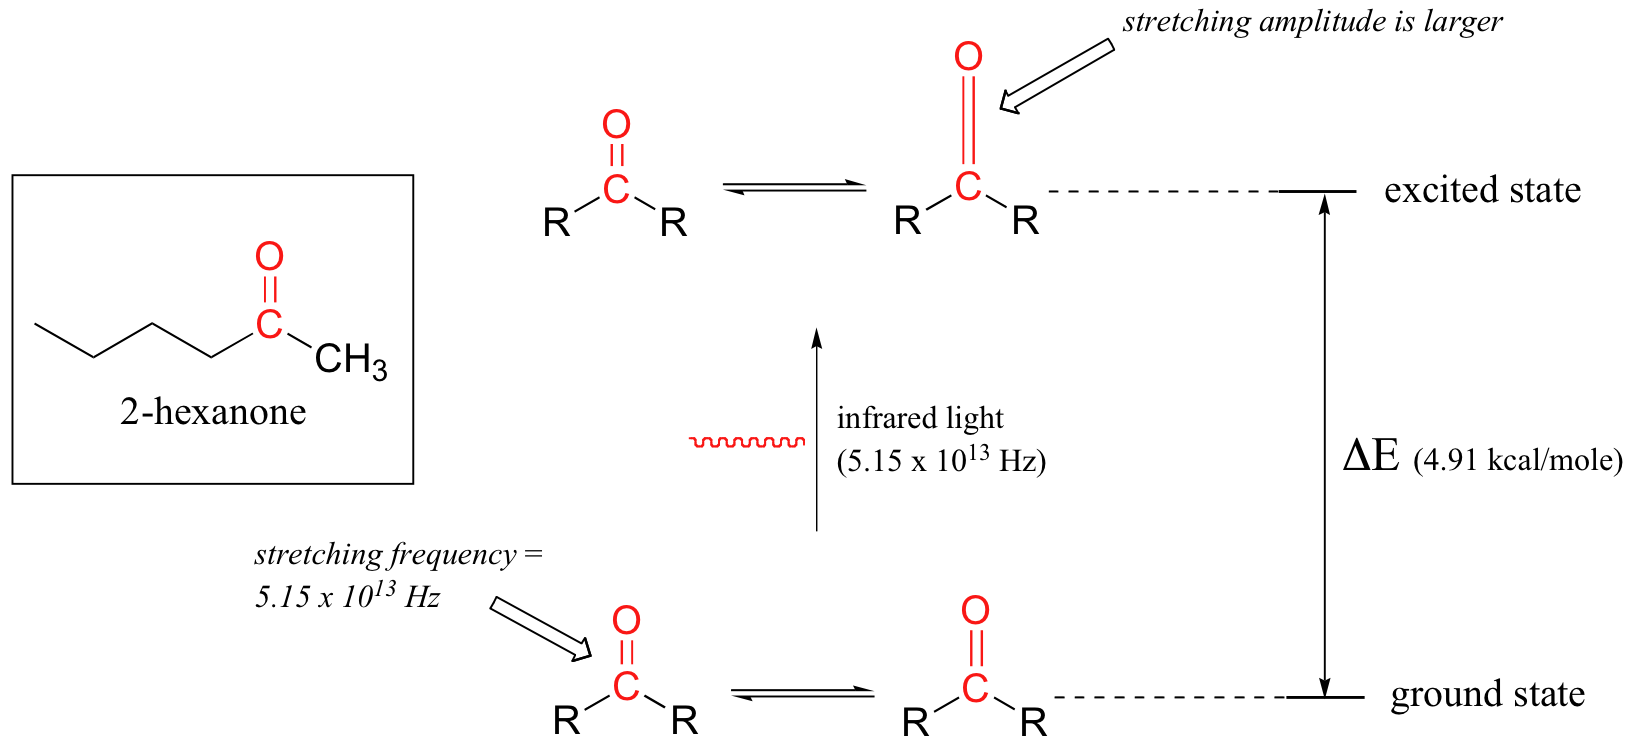
The value of ΔE - the energy difference between the low energy (ground) and high energy (excited) vibrational states - is equal to 4.91 kcal/mol, the same as the energy associated with the absorbed light frequency. The molecule does not remain in its excited vibrational state for very long, but quickly releases energy to the surrounding environment in form of heat, and returns to the ground state.
With an instrument called an infrared spectrophotometer, we can 'see' this vibrational transition. In the spectrophotometer, infrared light with frequencies ranging from about 1013 to 1014 Hz is passed though our sample of cyclohexane. Most frequencies pass right through the sample and are recorded by a detector on the other side.
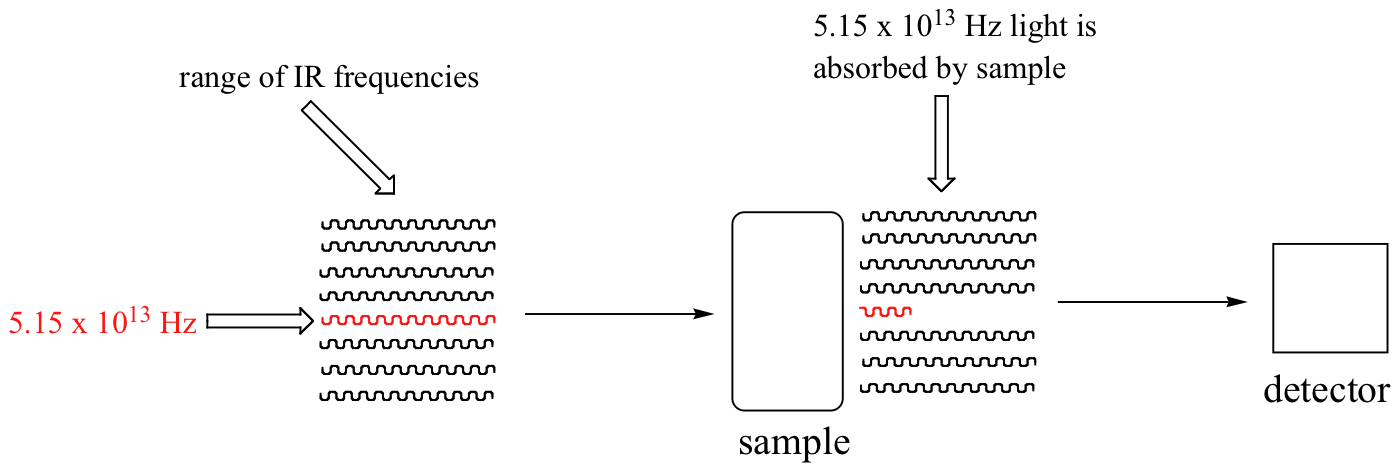
Our 5.15 x 10¹³ Hz carbonyl stretching frequency, however, is absorbed by the 2-hexanone sample, and so the detector records that the intensity of this frequency, after having passed through the sample, is something less than 100% of its initial intensity.
The vibrations of a 2-hexanone molecule are not, of course, limited to the simple stretching of the carbonyl bond. The various carbon-carbon bonds also stretch and bend, as do the carbon-hydrogen bonds, and all of these vibrational modes also absorb different frequencies of infrared light.
The power of infrared spectroscopy arises from the observation that different functional groups have different characteristic absorption frequencies. The carbonyl bond in a ketone, as we saw with our 2-hexanone example, typically absorbs in the range of 5.11 - 5.18 x 10¹³ Hz, depending on the molecule. The carbon-carbon triple bond of an alkyne, on the other hand, absorbs in the range 6.30 - 6.80 x 10¹³ Hz. The technique is therefore very useful as a means of identifying which functional groups are present in a molecule of interest. If we pass infrared light through an unknown sample and find that it absorbs in the carbonyl frequency range but not in the alkyne range, we can infer that the molecule contains a carbonyl group but not an alkyne.
Some bonds absorb infrared light more strongly than others, and some bonds do not absorb at all. In order for a vibrational mode to absorb infrared light, it must result in a periodic change in the dipole moment of the molecule. Such vibrations are said to be infrared active. In general, the greater the polarity of the bond, the stronger its IR absorption. The carbonyl bond is very polar, and absorbs very strongly. The carbon-carbon triple bond in most alkynes, in contrast, is much less polar, and thus a stretching vibration does not result in a large change in the overall dipole moment of the molecule. Alkyne groups absorb rather weakly compared to carbonyls.
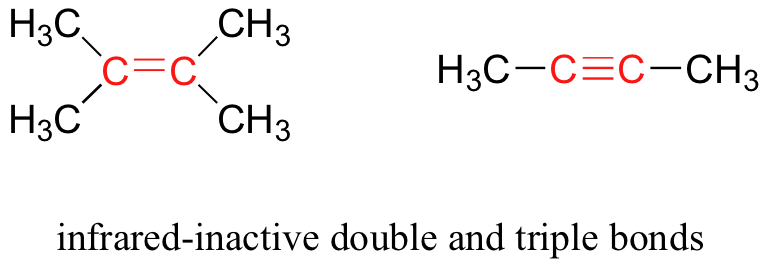
Some kinds of vibrations are infrared inactive. The stretching vibrations of completely symmetrical double and triple bonds, for example, do not result in a change in dipole moment, and therefore do not result in any absorption of light (but other bonds and vibrational modes in these molecules do absorb IR light).
Now, let's look at some actual output from IR spectroscopy experiments. Below is the IR spectrum for 2-hexanone.

There are a number of things that need to be explained in order for you to understand what it is that we are looking at. On the horizontal axis we see IR wavelengths expressed in terms of a unit called wavenumber (cm-1), which tells us how many waves fit into one centimeter. On the vertical axis we see ‘% transmittance’, which tells us how strongly light was absorbed at each frequency (100% transmittance means no absorption occurred at that frequency). The solid line traces the values of % transmittance for every wavelength – the ‘peaks’ (which are actually pointing down) show regions of strong absorption. For some reason, it is typical in IR spectroscopy to report wavenumber values rather than wavelength (in meters) or frequency (in Hz). The ‘upside down’ vertical axis, with absorbance peaks pointing down rather than up, is also a curious convention in IR spectroscopy. We wouldn’t want to make things too easy for you!
Express the wavenumber value of 3000 cm-1 in terms of wavelength (in meter units). Template:ExampleEndThe key absorption peak in this spectrum is that from the carbonyl double bond, at 1716 cm-1 (corresponding to a wavelength of 5.86 mm, a frequency of 5.15 x 10¹³ Hz, and a ΔE value of 4.91 kcal/mol). Notice how strong this peak is, relative to the others on the spectrum: a strong peak in the 1650-1750 cm-1 region is a dead giveaway for the presence of a carbonyl group. Within that range, carboxylic acids, esters, ketones, and aldehydes tend to absorb in the shorter wavelength end (1700-1750 cm-1), while conjugated unsaturated ketones and amides tend to absorb on the longer wavelength end (1650-1700 cm-1).
The jagged peak at approximately 2900-3000 cm-1 is characteristic of tetrahedral carbon-hydrogen bonds. This peak is not terribly useful, as just about every organic molecule that you will have occasion to analyze has these bonds. Nevertheless, it can serve as a familiar reference point to orient yourself in a spectrum.
You will notice that there are many additional peaks in this spectrum in the longer-wavelength 400 -1400 cm-1 region. This part of the spectrum is called the fingerprint region. While it is usually very difficult to pick out any specific functional group identifications from this region, it does, nevertheless, contain valuable information. The reason for this is suggested by the name: just like a human fingerprint, the pattern of absorbance peaks in the fingerprint region is unique to every molecule, meaning that the data from an unknown sample can be compared to the IR spectra of known standards in order to make a positive identification. In the mid-1990's, for example, several paintings were identified as forgeries because scientists were able to identify the IR footprint region of red and yellow pigment compounds that would not have been available to the artist who supposedly created the painting (for more details see Chemical and Engineering News, Sept 10, 2007, p. 28).
Now, let’s take a look at the IR spectrum for 1-hexanol.

As you can see, the carbonyl peak is gone, and in its place is a very broad ‘mountain’ centered at about 3400 cm-1. This signal is characteristic of the O-H stretching mode of alcohols, and is a dead giveaway for the presence of an alcohol group. The breadth of this signal is a consequence of hydrogen bonding between molecules.
In the spectrum of octanoic acid we see, as expected, the characteristic carbonyl peak, this time at 1709 cm-1.

We also see a low, broad absorbance band that looks like an alcohol, except that it is displaced slightly to the right (long-wavelength) side of the spectrum, causing it to overlap to some degree with the C-H region. This is the characteristic carboxylic acid O-H single bond stretching absorbance.
The spectrum for 1-octene shows two peaks that are characteristic of alkenes: the one at 1642 cm-1 is due to stretching of the carbon-carbon double bond, and the one at 3079 cm-1 is due to stretching of the s bond between the alkene carbons and their attached hydrogens.

Alkynes have characteristic IR absorbance peaks in the range of 2100-2250 cm-1 due to stretching of the carbon-carbon triple bond, and terminal alkenes can be identified by their absorbance at about 3300 cm-1, due to stretching of the bond between the sp-hybridized carbon and the terminal hydrogen.
It is possible to identify other functional groups such as amines and ethers, but the characteristic peaks for these groups are considerably more subtle and/or variable, and often are overlapped with peaks from the fingerprint region. For this reason, we will limit our discussion here to the most easily recognized functional groups, which are summarized in this table.
As you can imagine, obtaining an IR spectrum for a compound will not allow us to figure out the complete structure of even a simple molecule, unless we happen to have a reference spectrum for comparison. In conjunction with other analytical methods, however, IR spectroscopy can prove to be a very valuable tool, given the information it provides about the presence or absence of key functional groups. IR can also be a quick and convenient way for a chemist to check to see if a reaction has proceeded as planned. If we were to run a reaction in which we wished to convert cyclohexanone to cyclohexanol, for example, a quick comparison of the IR spectra of starting compound and product would tell us if we had successfully converted the ketone group to an alcohol.
More examples of IR spectra
To illustrate the usefulness of infrared absorption spectra, examples for five C4H8O isomers are presented below their corresponding structural formulas. Try to associate each spectrum with one of the isomers in the row above it.
Contributors
- Organic Chemistry With a Biological Emphasis by Tim Soderberg (University of Minnesota, Morris)
- William Reusch, Professor Emeritus (Michigan State U.), Virtual Textbook of Organic Chemistry