2.5: Condensation of Gases and the Critical State
- Page ID
- 41407
\( \newcommand{\vecs}[1]{\overset { \scriptstyle \rightharpoonup} {\mathbf{#1}} } \)
\( \newcommand{\vecd}[1]{\overset{-\!-\!\rightharpoonup}{\vphantom{a}\smash {#1}}} \)
\( \newcommand{\id}{\mathrm{id}}\) \( \newcommand{\Span}{\mathrm{span}}\)
( \newcommand{\kernel}{\mathrm{null}\,}\) \( \newcommand{\range}{\mathrm{range}\,}\)
\( \newcommand{\RealPart}{\mathrm{Re}}\) \( \newcommand{\ImaginaryPart}{\mathrm{Im}}\)
\( \newcommand{\Argument}{\mathrm{Arg}}\) \( \newcommand{\norm}[1]{\| #1 \|}\)
\( \newcommand{\inner}[2]{\langle #1, #2 \rangle}\)
\( \newcommand{\Span}{\mathrm{span}}\)
\( \newcommand{\id}{\mathrm{id}}\)
\( \newcommand{\Span}{\mathrm{span}}\)
\( \newcommand{\kernel}{\mathrm{null}\,}\)
\( \newcommand{\range}{\mathrm{range}\,}\)
\( \newcommand{\RealPart}{\mathrm{Re}}\)
\( \newcommand{\ImaginaryPart}{\mathrm{Im}}\)
\( \newcommand{\Argument}{\mathrm{Arg}}\)
\( \newcommand{\norm}[1]{\| #1 \|}\)
\( \newcommand{\inner}[2]{\langle #1, #2 \rangle}\)
\( \newcommand{\Span}{\mathrm{span}}\) \( \newcommand{\AA}{\unicode[.8,0]{x212B}}\)
\( \newcommand{\vectorA}[1]{\vec{#1}} % arrow\)
\( \newcommand{\vectorAt}[1]{\vec{\text{#1}}} % arrow\)
\( \newcommand{\vectorB}[1]{\overset { \scriptstyle \rightharpoonup} {\mathbf{#1}} } \)
\( \newcommand{\vectorC}[1]{\textbf{#1}} \)
\( \newcommand{\vectorD}[1]{\overrightarrow{#1}} \)
\( \newcommand{\vectorDt}[1]{\overrightarrow{\text{#1}}} \)
\( \newcommand{\vectE}[1]{\overset{-\!-\!\rightharpoonup}{\vphantom{a}\smash{\mathbf {#1}}}} \)
\( \newcommand{\vecs}[1]{\overset { \scriptstyle \rightharpoonup} {\mathbf{#1}} } \)
\( \newcommand{\vecd}[1]{\overset{-\!-\!\rightharpoonup}{\vphantom{a}\smash {#1}}} \)
\(\newcommand{\avec}{\mathbf a}\) \(\newcommand{\bvec}{\mathbf b}\) \(\newcommand{\cvec}{\mathbf c}\) \(\newcommand{\dvec}{\mathbf d}\) \(\newcommand{\dtil}{\widetilde{\mathbf d}}\) \(\newcommand{\evec}{\mathbf e}\) \(\newcommand{\fvec}{\mathbf f}\) \(\newcommand{\nvec}{\mathbf n}\) \(\newcommand{\pvec}{\mathbf p}\) \(\newcommand{\qvec}{\mathbf q}\) \(\newcommand{\svec}{\mathbf s}\) \(\newcommand{\tvec}{\mathbf t}\) \(\newcommand{\uvec}{\mathbf u}\) \(\newcommand{\vvec}{\mathbf v}\) \(\newcommand{\wvec}{\mathbf w}\) \(\newcommand{\xvec}{\mathbf x}\) \(\newcommand{\yvec}{\mathbf y}\) \(\newcommand{\zvec}{\mathbf z}\) \(\newcommand{\rvec}{\mathbf r}\) \(\newcommand{\mvec}{\mathbf m}\) \(\newcommand{\zerovec}{\mathbf 0}\) \(\newcommand{\onevec}{\mathbf 1}\) \(\newcommand{\real}{\mathbb R}\) \(\newcommand{\twovec}[2]{\left[\begin{array}{r}#1 \\ #2 \end{array}\right]}\) \(\newcommand{\ctwovec}[2]{\left[\begin{array}{c}#1 \\ #2 \end{array}\right]}\) \(\newcommand{\threevec}[3]{\left[\begin{array}{r}#1 \\ #2 \\ #3 \end{array}\right]}\) \(\newcommand{\cthreevec}[3]{\left[\begin{array}{c}#1 \\ #2 \\ #3 \end{array}\right]}\) \(\newcommand{\fourvec}[4]{\left[\begin{array}{r}#1 \\ #2 \\ #3 \\ #4 \end{array}\right]}\) \(\newcommand{\cfourvec}[4]{\left[\begin{array}{c}#1 \\ #2 \\ #3 \\ #4 \end{array}\right]}\) \(\newcommand{\fivevec}[5]{\left[\begin{array}{r}#1 \\ #2 \\ #3 \\ #4 \\ #5 \\ \end{array}\right]}\) \(\newcommand{\cfivevec}[5]{\left[\begin{array}{c}#1 \\ #2 \\ #3 \\ #4 \\ #5 \\ \end{array}\right]}\) \(\newcommand{\mattwo}[4]{\left[\begin{array}{rr}#1 \amp #2 \\ #3 \amp #4 \\ \end{array}\right]}\) \(\newcommand{\laspan}[1]{\text{Span}\{#1\}}\) \(\newcommand{\bcal}{\cal B}\) \(\newcommand{\ccal}{\cal C}\) \(\newcommand{\scal}{\cal S}\) \(\newcommand{\wcal}{\cal W}\) \(\newcommand{\ecal}{\cal E}\) \(\newcommand{\coords}[2]{\left\{#1\right\}_{#2}}\) \(\newcommand{\gray}[1]{\color{gray}{#1}}\) \(\newcommand{\lgray}[1]{\color{lightgray}{#1}}\) \(\newcommand{\rank}{\operatorname{rank}}\) \(\newcommand{\row}{\text{Row}}\) \(\newcommand{\col}{\text{Col}}\) \(\renewcommand{\row}{\text{Row}}\) \(\newcommand{\nul}{\text{Nul}}\) \(\newcommand{\var}{\text{Var}}\) \(\newcommand{\corr}{\text{corr}}\) \(\newcommand{\len}[1]{\left|#1\right|}\) \(\newcommand{\bbar}{\overline{\bvec}}\) \(\newcommand{\bhat}{\widehat{\bvec}}\) \(\newcommand{\bperp}{\bvec^\perp}\) \(\newcommand{\xhat}{\widehat{\xvec}}\) \(\newcommand{\vhat}{\widehat{\vvec}}\) \(\newcommand{\uhat}{\widehat{\uvec}}\) \(\newcommand{\what}{\widehat{\wvec}}\) \(\newcommand{\Sighat}{\widehat{\Sigma}}\) \(\newcommand{\lt}{<}\) \(\newcommand{\gt}{>}\) \(\newcommand{\amp}{&}\) \(\definecolor{fillinmathshade}{gray}{0.9}\)The most striking feature of real gases is that they cease to remain gases as the temperature is lowered and the pressure is increased.
The Van der Waals Equation of State
In the last lecture, we saw that for the pair potential
\[u(r) = \begin{cases} \infty & r \leq \sigma \\ -\dfrac{C_6}{r^6} & r > \sigma \end{cases} \label{\(\PageIndex{1}\)}\]
we could write the second virial coefficient as
\[B_2(T) = \dfrac{2}{3} \pi N_0 \sigma^3 \left[ 1 - \dfrac{C_6}{3 k_B T \sigma^6} \right] \label{\(\PageIndex{2}\)}\]
Let us introduce to simplifying variables
\[\begin{align} b &= \dfrac{2}{3} \pi N_0 \sigma^3 \\ a &= \dfrac{2 \pi N_0^2 C_6}{9 \sigma^3} \end{align} \label{\(\PageIndex{3}\)}\]
in terms of which
\[B_2(T) = b - \dfrac{a}{RT} \label{\(\PageIndex{4}\)}\]
With these definitions, the virial equation of state becomes
\[\begin{align} P &= \dfrac{nRT}{V} + \dfrac{n^2}{V^2} RT \left( b - \dfrac{a}{RT} \right) \\ &= \dfrac{nRT}{V} \left(1 + \dfrac{nb}{V} \right) - \dfrac{an^2}{V^2} \end{align} \label{\(\PageIndex{5}\)}\]
If we assume \(nb/V\) is small, then we can also write
\[1 + \dfrac{nb}{V} \approx \dfrac{1}{1 - \dfrac{nb}{V}} \label{\(\PageIndex{6}\)}\]
so that
\[P = \dfrac{nRT}{V - nb} - \dfrac{an^2}{V^2} \label{\(\PageIndex{7}\)}\]
which is known as the van der Waals equation of state.

The first term in this equation is easy to motivate. In fact, it looks very much like the equation of state for an ideal gas having volume \(V - nb\) rather than \(V\). This part of the van der Waals equation is due entirely to the hard-wall potential \(u_o(r)\). Essentially, this potential energy term describes a system of “billiard balls” of diameter \(\sigma\). The figure below shows two of these billiard ball type particles at the point of contact (also called the distance of closest approach). At this point, they undergo a collision and separate, so that cannot be closer than the distance shown in the figure. At this point, the distance between their centers is also \(\sigma\), as the figure indicates. Because of this distance of closest approach, the total volume available to the particles is not \(V\) but some volume less than \(V\). This reduction in volume can be calculated as follows: Figure \(\PageIndex{1}\) shows a shaded sphere that just contains the pair of billiard ball particles. The volume of this sphere is the volume excluded from any two particles. The radius of the sphere is \(\sigma\) as the figure shows. Hence, the excluded volume for the two particles is \(4 \pi \sigma^3/3\), which is the volume of the shaded sphere. From this, we see that the excluded volume for any one particle is just half of this or \(2 \pi \sigma^3/3\). The excluded volume for a mole of such particles is just \(2 \pi \sigma^3 N_0/3\), which is the parameter \(b\):
\[b = \dfrac{2}{3} \pi \sigma^3 N_0 \label{\(\PageIndex{8}\)}\]
Given \(n\) moles of gas, the total excluded volume is then \(nb\), so that the total available volume is simply \(V - nb\).
Isotherms of the van der Waals equation are shown in the figure below (left panel). In the figure the volume axis is the molar volume denoted \(\bar{V} = V/n\). At sufficiently high temperature, the isotherms approach those of an ideal gas. However, we also see something strange in some of the isotherms. Specifically, we see a region in which \(P\) and \(V\) increase together, and we know that this cannot actually happen in a real gas. It should be clear that many approximations and assumptions go into the derivation of the van der Waals equation so that some of the important physics is missing from the model. Hence, we should not be surprised if the van der Waals equation has some unphysical behavior buried in it.
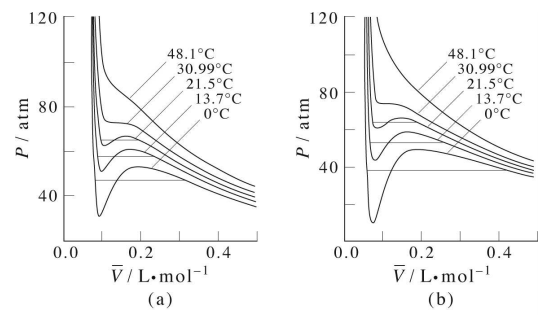
In fact, we know that at sufficiently low temperatures, any real gas, when compressed, must undergo a transition from gas to liquid. The signature of such a transition is a discontinuous change in the volume, signifying the condensation of the gas into a liquid that occupies a significantly lower volume. Unfortunately, the van der Waals equation does not correctly predict this behavior, and hence, it must be added in ad hoc. This is done by drawing a horizontal line through the isotherm (Figure \(\PageIndex{2}\)) and in the figure below. The vertical position of the line is
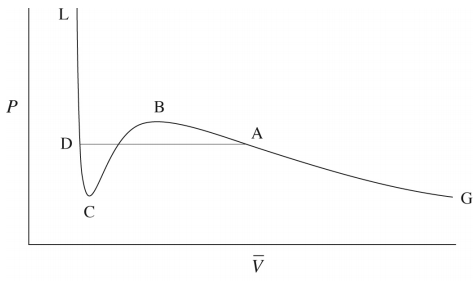
chosen so that the area above the line (between the line and the isotherm) and below the line (again between the line and the isotherm) is exactly the same. In this way, we entirely remove the artifact of the unphysical increase of \(P\) with \(V\) when we compute the compressional work on the gas from \(\int P(V) \: dV\), to be discussed in our section on thermodynamics. This horizontal line is called the tie line.
As it happens, there is exactly one isotherm along which the van der Waals equation correctly predicts the gas-to-liquid phase transition. Along this isotherm, the volume discontinuity captured by the tie line is shrunken down to a single point (so that there is no possibility of an increase of \(P\) with \(V\)!). This isotherm, in fact, corresponds to the highest possible temperature at which such a transition can occur. As we approach this isotherm from higher temperatures, this isotherm is a kind of dividing line between the system’s remaining a gas at all value of \(P\) and \(V\) and the system’s actually undergoing a gas-to-liquid transition. Hence, this isotherm is called the critical isotherm (Figure \(\PageIndex{4}\)): The temperature of this isotherm is called the critical temperature, denoted \(T_c\). The point at which the curve flattens out, signifying the phase transition, is called the critical point. If we draw a curve through the isotherms joining all points of these isotherms at which the tie lines begin, continue the curve up to the critical isotherm, and down the other side where the tie lines end, this curve reaches a maximum at the critical point. This is illustrated below:
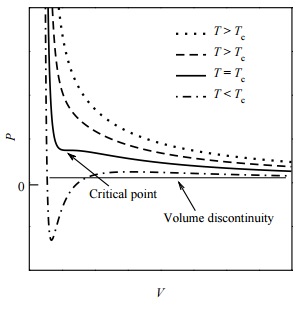
The shape of the critical isotherm at the critical point allows us to determine the exact temperature, pressure, and volume at which the phase transition from gas to liquid will occur. At this point, the isotherm is both horizontal and flat. This means that both the first and second derivatives of \(P\) with respect to \(V\) must vanish:
\[\dfrac{\partial P}{\partial V} = 0, \: \: \: \dfrac{\partial^2 P}{\partial V^2} = 0 \label{\(\PageIndex{9}\)}\]
Substituting the van der Waals equation into these two conditions, we find the following:
\[\begin{align} -\dfrac{nRT}{\left( V - nb \right)^2} + \dfrac{2 an^2}{V^3} &= 0 \\ \dfrac{2nRT}{\left( V - nb \right)^3} - \dfrac{6an^2}{V^4} &= 0 \end{align} \label{\(\PageIndex{1}\)0}\]
Hence, we have two equations in two unknowns \(V\) and \(T\) for the critical temperature and critical volume. Once these are determined, the van der Waals equation, itself, allows us to determine the critical pressure.
To solve the equations, first divide one by the other. This gives us a simple condition for the volume:
\[\begin{align} \dfrac{V - nb}{2} &= \dfrac{V}{3} \\ 3V - 3nb &= 2V \\ V &= 3nb \equiv V_c \end{align} \label{\(\PageIndex{1}\)1}\]
This is the critical volume. Now use either of the two conditions to obtain the critical temperature \(T_c\). If we use the first one, we find
\[\begin{align} \dfrac{nRT_c}{\left( V_c - nb \right)^2} &= \dfrac{2an^2}{V_c^3} \\ \dfrac{nRT_c}{\left( 3nb - nb \right)^2} &= \dfrac{2an^2}{\left( 3nb \right)^3} \\ \dfrac{nRT_c}{4n^2b^2} &= \dfrac{2an^2}{27n^3b^3} \\ RT_c &= \dfrac{8a}{27b} \end{align} \label{\(\PageIndex{1}\)2}\]
Finally, plugging the critical temperature and volume into the van der Waals equation, we obtain the critical pressure
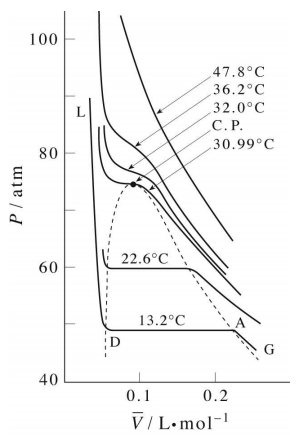
as
\[\begin{align} P &= \dfrac{nRT_c}{V_c - nb} - \dfrac{an^2}{V_c^2} \\ &= \dfrac{8an/27b}{3nb - nb} - \dfrac{an^2}{\left( 3nb \right)^2} \\ &= \dfrac{a}{27b^2} \end{align} \label{\(\PageIndex{1}\)3}\]
PVT Surface of a real gas
The plot illustrates this behavior; as the volume is decreased, the lower-temperature isotherms suddenly change into straight lines. Under these conditions, the pressure remains constant as the volume is reduced. This can only mean that the gas is “disappearing" as we squeeze the system down to a smaller volume. In its place, we obtain a new state of matter, the liquid. In the green-shaded region, two phases, liquid, and gas, are simultaneously present. Finally, at very small volume all the gas has disappeared and only the liquid phase remains. At this point the isotherms bend strongly upward, reflecting our common experience that a liquid is practically incompressible.
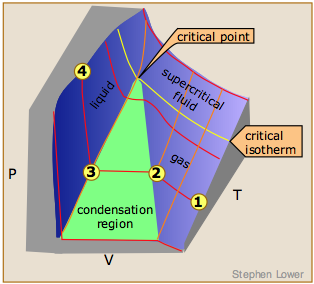
To better understand this plot, look at the isotherm labeled  . As the gas is compressed from
  to
to  , the pressure rises in much the same way as Boyle's law predicts. Compression beyond
 , however, does not cause any rise in the pressure. What happens instead is that some of the gas condenses to a liquid. At
  , the substance is entirely in its liquid state. The very steep rise to
  corresponds to our ordinary experience that liquids have very low compressibilities. The range of volumes possible for the liquid diminishes as the critical temperature is approached.
The critical point
Liquid and gas can coexist only within the regions indicated by the green-shaded area in the diagram above. As the temperature and pressure rise, this region becomes more narrow, finally reaching zero width at the critical point. The values of P, T, and V at this juncture are known as the critical constants Pc , Tc , and Vc . The isotherm that passes through the critical point is called the critical isotherm. Beyond this isotherm, the gas and liquids become indistinguishable; there is only a single fluid phase, sometimes referred to as a supercritical liquid.
Critical Behaviour of carbon dioxide
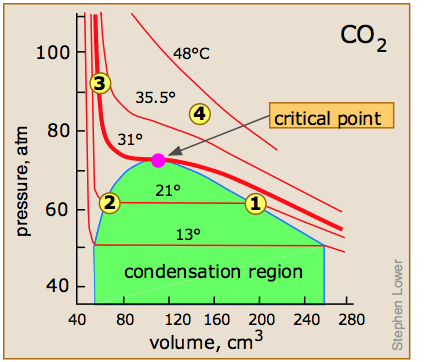
At temperatures below 31°C (the critical temperature), CO2 acts somewhat like an ideal gas even at a rather high pressure ( ). Below 31°, an attempt to compress the gas to a smaller volume eventually causes condensation to begin. Thus at 21°C, at a pressure of about 62 atm (
 ), the volume can be reduced from 200 cm3 to about 55 cm3 without any further rise in the pressure. Instead of the gas being compressed, it is replaced with the far more compact liquid as the gas is essentially being "squeezed" into its liquid phase. After all of the gas has disappeared (
 ), the pressure rises very rapidly because now all that remains is an almost incompressible liquid. Above this isotherm (
 ), CO2 exists only as a supercritical fluid.
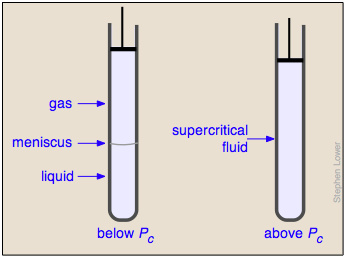
What happens if you have some liquid carbon dioxide in a transparent cylinder at just under its Pc of 62 atm, and you then compress it slightly? Nothing very dramatic until you notice that the meniscus has disappeared. By successively reducing and increasing the pressure, you can "turn the meniscus on and off".
One intriguing consequence of the very limited bounds of the liquid state is that you could start with a gas at large volume and low temperature, raise the temperature, reduce the volume, and then reduce the temperature so as to arrive at the liquid region at the lower left, without ever passing through the two-phase region, and thus without undergoing condensation!
Supercritical fluids
The supercritical state of matter, as the fluid above the critical point is often called, possesses the flow properties of a gas and the solvent properties of a liquid. The density of a supercritical fluid can be changed over a wide range by adjusting the pressure; this, in turn, changes its solubility, which can thus be optimized for a particular application. The picture at the right shows a commercial laboratory device used for carrying out chemical reactions under supercritical conditions.
Supercritical carbon dioxide is widely used to dissolve the caffeine out of coffee beans and as a dry-cleaning solvent. Supercritical water has recently attracted interest as a medium for chemically decomposing dangerous environmental pollutants such as PCBs. Supercritical fluids are being increasingly employed as as substitutes for organic solvents (so-called "green chemistry") in a range of industrial and laboratory processes. Applications that involve supercritical fluids include extractions, nano particle and nano structured film formation, supercritical drying, carbon capture and storage, as well as enhanced oil recovery studies.
Contributors and Attributions
Stephen Lower, Professor Emeritus (Simon Fraser U.) Chem1 Virtual Textbook

