
2.4: Functional Groups
- Page ID
- 354263

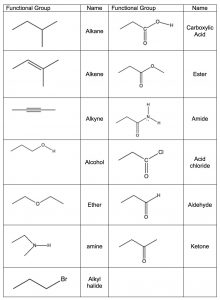
The idea that a carbonyl group can be recognized, regardless of the structure of the rest of the molecule, is evidence for a major organizing idea of organic chemistry—that of functional groups. Functional groups are recognizable clusters of atoms within a larger molecule that have predictable properties allowing us to organize and make sense of organic chemistry. Rather than having to look at very large molecules as whole entities, (for example biomolecules that have many thousands to millions of carbon atoms) we can identify functional groups, and if we know how they behave we can predict how the molecule will behave.[14] A list of common functional groups is shown in the table (\(\rightarrow\)) and it is important that over time you learn to recognize each of them. Later, we will consider each of these groups in more detail and discuss their chemistry. For the moment, it is enough to be able to recognize these groups and understand how to use the evidence for the existence of functional groups that can be obtained from IR spectroscopy. Molecules with functional groups always give rise to particular patterns of peaks that correspond to the vibrations associated with that group.
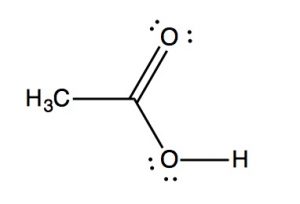
IR spectra can provide evidence for the presence of many of these functional groups, although in practice the most easily detected groups are double bonds—especially the carbonyl (\(1600-1800 \mathrm{~cm}^{-1}\)), and \(\mathrm{OH}\) and \(\mathrm{N-H}\) groups (above \(3000 \mathrm{~cm}^{-1}\)). For example, the spectrum of acetic acid (below) shows two very strong absorptions (above the fingerprint region): a very broad absorption around \(3000 \mathrm{~cm}^{-1}\), and a stronger, narrower one around \(1720 \mathrm{~cm}^{-1}\).
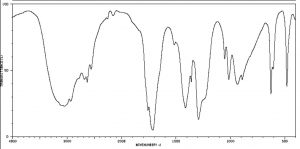
IR spectrum of Acetic Acid
The broad peak corresponds to the \(\mathrm{O-H}\) group in the carboxylic acid. It is so broad because this group participates in hydrogen bonding of various types and strengths, meaning that the energy required to promote this bond stretch varies with the degree of hydrogen bonding. The peak at \(1720\) corresponds to the carbonyl group. It should be noted that there are also \(\mathrm{C-H}\) stretches around \(3000\) that are hidden by the strong \(\mathrm{OH}\) stretches. The take-home message here is that IR spectroscopy is good for identifying clusters of atoms (functional groups) within a larger molecule, but it does not provide us with information about how the atoms in the molecule are actually arranged and connected. For that we need to turn to another kind of spectroscopy: nuclear magnetic resonance.
Questions to Answer
- What factors predict the strength of the IR absorption?
- What factors predict the position of the IR absorption?
- Draw a structure for a carboxylic acid in solution in methanol and use it to explain why the \(\mathrm{O-H}\) bond absorption is so broad.
Nuclear Magnetic Resonance (NMR) Spectroscopy
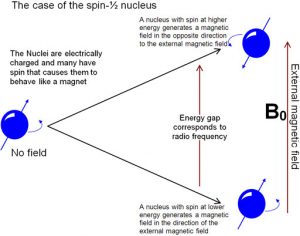
is a form of spectroscopy based on the fact that atomic nuclei behave like tiny spinning charges that generate a magnetic field. Just as with electrons, nuclei have a characteristic that we call “spin” that is quantized.[15] Nuclei can have spins that are integers (\((1,2,3 \ldots)\)) or non-integral spins (\(\frac{1}{2}, \frac{3}{2}, \frac{5}{2} \ldots)\)), and some have no spin. Those nuclei with a non-integral-spin quantum number are said to be NMR active, and of these the two most relevant to NMR analyses of organic molecules are \(\mathrm{H-} 1\) and \(\mathrm{C-} 13\), which have spin quantum numbers of \(\frac{1}{2}\). When materials that contain carbon or hydrogen are placed in a magnetic field their nuclei can assume either of two possible orientations with respect to the field: a low energy orientation in which the spin- associated nuclear magnet is aligned parallel to the field and a high energy orientation in which the nuclear magnet is aligned anti-parallel to (against) the field. A parallel nucleus can be flipped to the anti-parallel orientation by absorbing the appropriate amount of electromagnetic energy—which happens to be in the radio-wave range. From the pattern of energy absorbed, we can deduce the structure of the molecule being analyzed (see below)
The energies of electromagnetic radiation that cause the nuclei to spin flip are referred to as resonance frequencies, (which is why the method is called nuclear magnetic resonance (NMR) spectroscopy). The same phenomena is involved in magnetic resonance imaging (MRI)—although the “nuclear” part of the name was removed because of concerns that patients might be worried (needlessly) about exposure to damaging radiation. Both NMR and MRI involve placing the specimen, either a chemical sample or a human body, into a very strong magnetic field, but the energy used to “flip” the spin of the nuclei within the sample is relatively low, that is in the radiofrequency range. We are constantly bombarded by low energy radio-waves but their energy is not enough to be absorbed by most molecules, and so they have little effect.[16] It is only when very high magnetic fields are applied to a sample (or body) that the spin states of the nuclei are split (into orientations that are parallel and anti-parallel to the field) and we observe the absorption (or emission) of these low energy radio-waves.
An NMR spectrum (or an MRI image for that matter) requires a sample to be placed into a strong magnetic field. In older NMR spectrometers, the field strength is changed, and the resonance frequencies are recorded. Newer (now almost all) NMR machines operate with a fixed magnetic field strength; the sample is irradiated with radio frequency (RF) radiation at all relevant frequencies which excites all NMR active nuclei into the more energetic spin state. As the nuclei relax, the machine records the energies of the emissions, which are then resolved into distinct wavelength using a Fourier-transform-based deconvolution.
The separation of the spin states (and therefore the amount of energy required to flip them) depends upon the strength of the external magnetic field. For example, for a relatively small magnet of 1.4 Tesla the RF used is \(60 \mathrm{ MHz}\); at 7 Tesla the frequency is around \(300 \mathrm{ MHz}\).[17] The most modern instruments use very strong magnets, operating in the \(1000 \mathrm{ MHz}\) range. In practice stronger magnets provide better, more detailed spectra. Since different NMR instruments use different magnetic field strengths, they will also produce different RF absorption/emission peaks for same molecule. In order to make measurements from different NMR instruments comparable, the scale is set to show signals in terms of parts per million (\(\mathrm{ppm}\)) from a reference signal (see following section on chemical shift).