2.7: Resonance Signal Areas and Widths
- Page ID
- 394067

\( \newcommand{\vecs}[1]{\overset { \scriptstyle \rightharpoonup} {\mathbf{#1}} } \)
\( \newcommand{\vecd}[1]{\overset{-\!-\!\rightharpoonup}{\vphantom{a}\smash {#1}}} \)
\( \newcommand{\dsum}{\displaystyle\sum\limits} \)
\( \newcommand{\dint}{\displaystyle\int\limits} \)
\( \newcommand{\dlim}{\displaystyle\lim\limits} \)
\( \newcommand{\id}{\mathrm{id}}\) \( \newcommand{\Span}{\mathrm{span}}\)
( \newcommand{\kernel}{\mathrm{null}\,}\) \( \newcommand{\range}{\mathrm{range}\,}\)
\( \newcommand{\RealPart}{\mathrm{Re}}\) \( \newcommand{\ImaginaryPart}{\mathrm{Im}}\)
\( \newcommand{\Argument}{\mathrm{Arg}}\) \( \newcommand{\norm}[1]{\| #1 \|}\)
\( \newcommand{\inner}[2]{\langle #1, #2 \rangle}\)
\( \newcommand{\Span}{\mathrm{span}}\)
\( \newcommand{\id}{\mathrm{id}}\)
\( \newcommand{\Span}{\mathrm{span}}\)
\( \newcommand{\kernel}{\mathrm{null}\,}\)
\( \newcommand{\range}{\mathrm{range}\,}\)
\( \newcommand{\RealPart}{\mathrm{Re}}\)
\( \newcommand{\ImaginaryPart}{\mathrm{Im}}\)
\( \newcommand{\Argument}{\mathrm{Arg}}\)
\( \newcommand{\norm}[1]{\| #1 \|}\)
\( \newcommand{\inner}[2]{\langle #1, #2 \rangle}\)
\( \newcommand{\Span}{\mathrm{span}}\) \( \newcommand{\AA}{\unicode[.8,0]{x212B}}\)
\( \newcommand{\vectorA}[1]{\vec{#1}} % arrow\)
\( \newcommand{\vectorAt}[1]{\vec{\text{#1}}} % arrow\)
\( \newcommand{\vectorB}[1]{\overset { \scriptstyle \rightharpoonup} {\mathbf{#1}} } \)
\( \newcommand{\vectorC}[1]{\textbf{#1}} \)
\( \newcommand{\vectorD}[1]{\overrightarrow{#1}} \)
\( \newcommand{\vectorDt}[1]{\overrightarrow{\text{#1}}} \)
\( \newcommand{\vectE}[1]{\overset{-\!-\!\rightharpoonup}{\vphantom{a}\smash{\mathbf {#1}}}} \)
\( \newcommand{\vecs}[1]{\overset { \scriptstyle \rightharpoonup} {\mathbf{#1}} } \)
\(\newcommand{\longvect}{\overrightarrow}\)
\( \newcommand{\vecd}[1]{\overset{-\!-\!\rightharpoonup}{\vphantom{a}\smash {#1}}} \)
\(\newcommand{\avec}{\mathbf a}\) \(\newcommand{\bvec}{\mathbf b}\) \(\newcommand{\cvec}{\mathbf c}\) \(\newcommand{\dvec}{\mathbf d}\) \(\newcommand{\dtil}{\widetilde{\mathbf d}}\) \(\newcommand{\evec}{\mathbf e}\) \(\newcommand{\fvec}{\mathbf f}\) \(\newcommand{\nvec}{\mathbf n}\) \(\newcommand{\pvec}{\mathbf p}\) \(\newcommand{\qvec}{\mathbf q}\) \(\newcommand{\svec}{\mathbf s}\) \(\newcommand{\tvec}{\mathbf t}\) \(\newcommand{\uvec}{\mathbf u}\) \(\newcommand{\vvec}{\mathbf v}\) \(\newcommand{\wvec}{\mathbf w}\) \(\newcommand{\xvec}{\mathbf x}\) \(\newcommand{\yvec}{\mathbf y}\) \(\newcommand{\zvec}{\mathbf z}\) \(\newcommand{\rvec}{\mathbf r}\) \(\newcommand{\mvec}{\mathbf m}\) \(\newcommand{\zerovec}{\mathbf 0}\) \(\newcommand{\onevec}{\mathbf 1}\) \(\newcommand{\real}{\mathbb R}\) \(\newcommand{\twovec}[2]{\left[\begin{array}{r}#1 \\ #2 \end{array}\right]}\) \(\newcommand{\ctwovec}[2]{\left[\begin{array}{c}#1 \\ #2 \end{array}\right]}\) \(\newcommand{\threevec}[3]{\left[\begin{array}{r}#1 \\ #2 \\ #3 \end{array}\right]}\) \(\newcommand{\cthreevec}[3]{\left[\begin{array}{c}#1 \\ #2 \\ #3 \end{array}\right]}\) \(\newcommand{\fourvec}[4]{\left[\begin{array}{r}#1 \\ #2 \\ #3 \\ #4 \end{array}\right]}\) \(\newcommand{\cfourvec}[4]{\left[\begin{array}{c}#1 \\ #2 \\ #3 \\ #4 \end{array}\right]}\) \(\newcommand{\fivevec}[5]{\left[\begin{array}{r}#1 \\ #2 \\ #3 \\ #4 \\ #5 \\ \end{array}\right]}\) \(\newcommand{\cfivevec}[5]{\left[\begin{array}{c}#1 \\ #2 \\ #3 \\ #4 \\ #5 \\ \end{array}\right]}\) \(\newcommand{\mattwo}[4]{\left[\begin{array}{rr}#1 \amp #2 \\ #3 \amp #4 \\ \end{array}\right]}\) \(\newcommand{\laspan}[1]{\text{Span}\{#1\}}\) \(\newcommand{\bcal}{\cal B}\) \(\newcommand{\ccal}{\cal C}\) \(\newcommand{\scal}{\cal S}\) \(\newcommand{\wcal}{\cal W}\) \(\newcommand{\ecal}{\cal E}\) \(\newcommand{\coords}[2]{\left\{#1\right\}_{#2}}\) \(\newcommand{\gray}[1]{\color{gray}{#1}}\) \(\newcommand{\lgray}[1]{\color{lightgray}{#1}}\) \(\newcommand{\rank}{\operatorname{rank}}\) \(\newcommand{\row}{\text{Row}}\) \(\newcommand{\col}{\text{Col}}\) \(\renewcommand{\row}{\text{Row}}\) \(\newcommand{\nul}{\text{Nul}}\) \(\newcommand{\var}{\text{Var}}\) \(\newcommand{\corr}{\text{corr}}\) \(\newcommand{\len}[1]{\left|#1\right|}\) \(\newcommand{\bbar}{\overline{\bvec}}\) \(\newcommand{\bhat}{\widehat{\bvec}}\) \(\newcommand{\bperp}{\bvec^\perp}\) \(\newcommand{\xhat}{\widehat{\xvec}}\) \(\newcommand{\vhat}{\widehat{\vvec}}\) \(\newcommand{\uhat}{\widehat{\uvec}}\) \(\newcommand{\what}{\widehat{\wvec}}\) \(\newcommand{\Sighat}{\widehat{\Sigma}}\) \(\newcommand{\lt}{<}\) \(\newcommand{\gt}{>}\) \(\newcommand{\amp}{&}\) \(\definecolor{fillinmathshade}{gray}{0.9}\)For use of NMR spectra as an aid to quantitative analysis and structure determinations, it is important to consider the limitations of the relationship between the magnitude of the nuclear resonance signal and the number of nuclei involved. In the first place, for a given kind of nuclei, the area under the resonance curve is expected to be closely proportional to the number of nuclei involved in the absence of large solvent effects. Thus, one should be able to determine the amount of benzene in mixtures with cyclohexane by measuring the area under the benzene peak and employing a single calibration mixture, provided that the volume of the material in the receiver coil was the same in each case. Another way of making such an analysis would be to take the ratio between the areas under the benzene and cyclohexane peaks. With very sharp peaks, a rough analysis may also be possible on the basis of peak heights, but this is not to be regarded as a generally satisfactory procedure unless the resonance lines have exactly the same width.
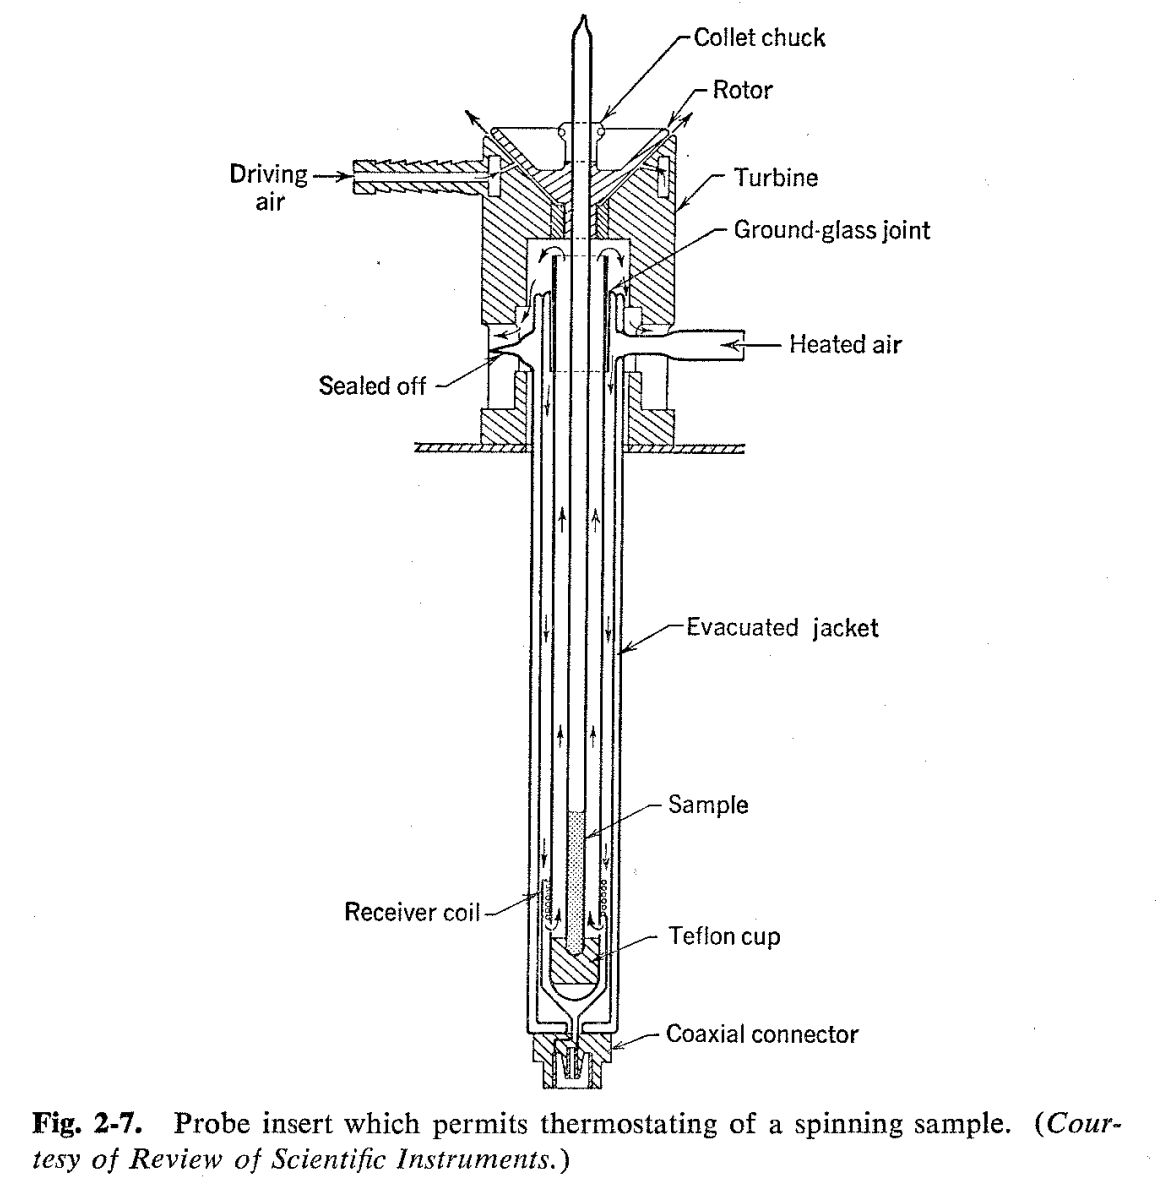
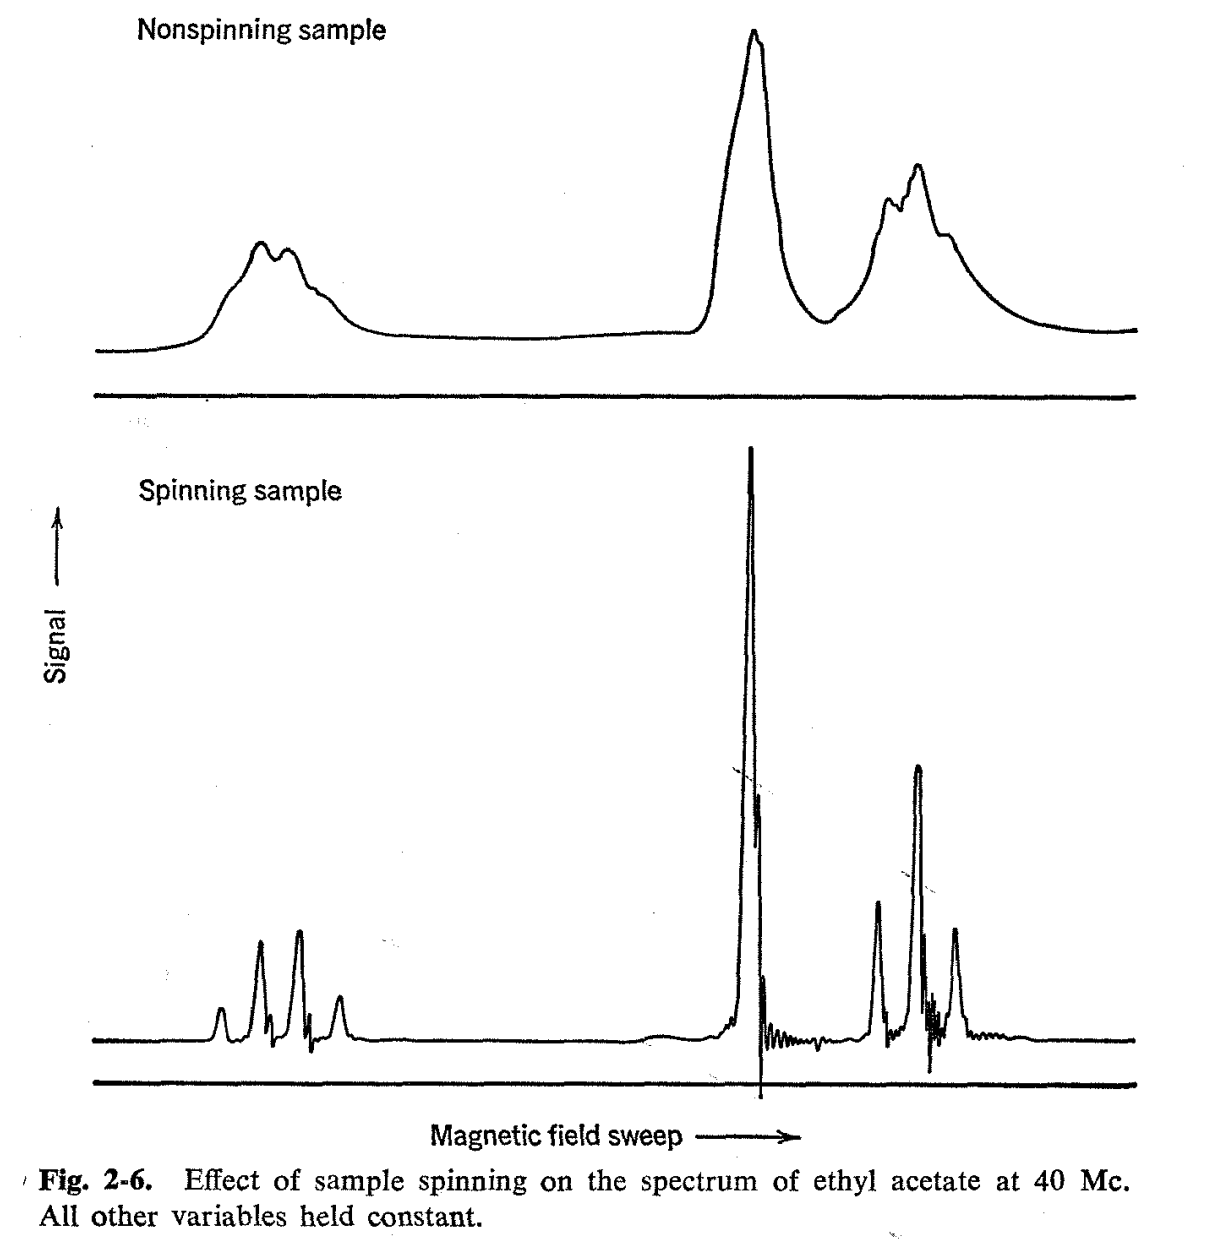
In general, the width of a resonance line is usually determined by the relaxation time T2 so that the width at one-half of the full signal strength is numerically equal to 2/T2 (cf. discussion on page 97). Here, we distinguish between the intrinsic relaxation time of the sample and the relaxation time which results from use of a nonhomogeneous external magnetic field. The line width which can be ascribed to the sample itself is sometimes called the "natural line width," and for many nonviscous substances it is smaller than can be achieved even with the most homogeneous magnetic fields now available. Line widths can often be reduced by spinning the sample in the magnetic field with the aid of an air turbine or some similar device. This has the effect of averaging out the field inhomogeneities perpendicular to the direction of spinning and, as is seen in Fig. 2-6, produces a very notable sharpening of the spectrum. An apparatus which permits thermostating of a spinning sample is shown in Fig. 2-7.
Under conditions of "slow passage" through a nuclear resonance spectrum (see Appendix A), the areas under the peaks are approximately proportional to the number of nuclei and (1 + H12T1T2\(\gamma\)2) -1/2 where H1 is the magnitude of the rotating field vector. Consequently, when the oscillator field strength is large and the relaxation times long, so that H12T1T2\(\gamma\)2 >_ 1, the areas will be a function of the relaxation times and H1. This will be important not only for nuclei with different relaxation times because of different chemical locations (as for protons on the ring or side-chain of toluene), but also for those located in equivalent molecular positions and subjected to different solvent influences as might change the relaxation times.
The importance of relaxation times on resonance signal areas under slow-passage conditions can be reduced by operating at low oscillator field strengths or, better, by extrapolating the ratio of the areas at several oscillator strengths to zero. However, this does not necessarily solve the signal-area problem, since slow passage is not generally practical for the determination of high-resolution spectra of organic liquids. In analysis of multicomponent systems, appropriate corrections can be made empirically with suitable calibration graphs. A much more serious problem may arise in structure determinations when one requires ratios of numbers of nuclei in different chemical locations for a given substance. For example, t-butylbenzene as an unknown could be distinguished from tetramethylbenzene by showing that the ratio between aliphatic and aromatic hydrogens is 9:5 for one and 12:2 for the other. Such a structure proof is unambiguous, provided the differences in relaxation times between the aromatic and aliphatic hydrogens are not so great as to cause the resonance signal areas to differ greatly from the theoretical values. An example of the kind of difficulties sometimes encountered is provided by cyclobutene, which gives areas under the methylene and double-bond hydrogen resonances as high as 2.8:1 (vs. the theoretical 2: 1) even at low oscillator strengths.