12.2: NMR Spectra - an introduction and overview
- Page ID
- 45270
\( \newcommand{\vecs}[1]{\overset { \scriptstyle \rightharpoonup} {\mathbf{#1}} } \)
\( \newcommand{\vecd}[1]{\overset{-\!-\!\rightharpoonup}{\vphantom{a}\smash {#1}}} \)
\( \newcommand{\id}{\mathrm{id}}\) \( \newcommand{\Span}{\mathrm{span}}\)
( \newcommand{\kernel}{\mathrm{null}\,}\) \( \newcommand{\range}{\mathrm{range}\,}\)
\( \newcommand{\RealPart}{\mathrm{Re}}\) \( \newcommand{\ImaginaryPart}{\mathrm{Im}}\)
\( \newcommand{\Argument}{\mathrm{Arg}}\) \( \newcommand{\norm}[1]{\| #1 \|}\)
\( \newcommand{\inner}[2]{\langle #1, #2 \rangle}\)
\( \newcommand{\Span}{\mathrm{span}}\)
\( \newcommand{\id}{\mathrm{id}}\)
\( \newcommand{\Span}{\mathrm{span}}\)
\( \newcommand{\kernel}{\mathrm{null}\,}\)
\( \newcommand{\range}{\mathrm{range}\,}\)
\( \newcommand{\RealPart}{\mathrm{Re}}\)
\( \newcommand{\ImaginaryPart}{\mathrm{Im}}\)
\( \newcommand{\Argument}{\mathrm{Arg}}\)
\( \newcommand{\norm}[1]{\| #1 \|}\)
\( \newcommand{\inner}[2]{\langle #1, #2 \rangle}\)
\( \newcommand{\Span}{\mathrm{span}}\) \( \newcommand{\AA}{\unicode[.8,0]{x212B}}\)
\( \newcommand{\vectorA}[1]{\vec{#1}} % arrow\)
\( \newcommand{\vectorAt}[1]{\vec{\text{#1}}} % arrow\)
\( \newcommand{\vectorB}[1]{\overset { \scriptstyle \rightharpoonup} {\mathbf{#1}} } \)
\( \newcommand{\vectorC}[1]{\textbf{#1}} \)
\( \newcommand{\vectorD}[1]{\overrightarrow{#1}} \)
\( \newcommand{\vectorDt}[1]{\overrightarrow{\text{#1}}} \)
\( \newcommand{\vectE}[1]{\overset{-\!-\!\rightharpoonup}{\vphantom{a}\smash{\mathbf {#1}}}} \)
\( \newcommand{\vecs}[1]{\overset { \scriptstyle \rightharpoonup} {\mathbf{#1}} } \)
\( \newcommand{\vecd}[1]{\overset{-\!-\!\rightharpoonup}{\vphantom{a}\smash {#1}}} \)
\(\newcommand{\avec}{\mathbf a}\) \(\newcommand{\bvec}{\mathbf b}\) \(\newcommand{\cvec}{\mathbf c}\) \(\newcommand{\dvec}{\mathbf d}\) \(\newcommand{\dtil}{\widetilde{\mathbf d}}\) \(\newcommand{\evec}{\mathbf e}\) \(\newcommand{\fvec}{\mathbf f}\) \(\newcommand{\nvec}{\mathbf n}\) \(\newcommand{\pvec}{\mathbf p}\) \(\newcommand{\qvec}{\mathbf q}\) \(\newcommand{\svec}{\mathbf s}\) \(\newcommand{\tvec}{\mathbf t}\) \(\newcommand{\uvec}{\mathbf u}\) \(\newcommand{\vvec}{\mathbf v}\) \(\newcommand{\wvec}{\mathbf w}\) \(\newcommand{\xvec}{\mathbf x}\) \(\newcommand{\yvec}{\mathbf y}\) \(\newcommand{\zvec}{\mathbf z}\) \(\newcommand{\rvec}{\mathbf r}\) \(\newcommand{\mvec}{\mathbf m}\) \(\newcommand{\zerovec}{\mathbf 0}\) \(\newcommand{\onevec}{\mathbf 1}\) \(\newcommand{\real}{\mathbb R}\) \(\newcommand{\twovec}[2]{\left[\begin{array}{r}#1 \\ #2 \end{array}\right]}\) \(\newcommand{\ctwovec}[2]{\left[\begin{array}{c}#1 \\ #2 \end{array}\right]}\) \(\newcommand{\threevec}[3]{\left[\begin{array}{r}#1 \\ #2 \\ #3 \end{array}\right]}\) \(\newcommand{\cthreevec}[3]{\left[\begin{array}{c}#1 \\ #2 \\ #3 \end{array}\right]}\) \(\newcommand{\fourvec}[4]{\left[\begin{array}{r}#1 \\ #2 \\ #3 \\ #4 \end{array}\right]}\) \(\newcommand{\cfourvec}[4]{\left[\begin{array}{c}#1 \\ #2 \\ #3 \\ #4 \end{array}\right]}\) \(\newcommand{\fivevec}[5]{\left[\begin{array}{r}#1 \\ #2 \\ #3 \\ #4 \\ #5 \\ \end{array}\right]}\) \(\newcommand{\cfivevec}[5]{\left[\begin{array}{c}#1 \\ #2 \\ #3 \\ #4 \\ #5 \\ \end{array}\right]}\) \(\newcommand{\mattwo}[4]{\left[\begin{array}{rr}#1 \amp #2 \\ #3 \amp #4 \\ \end{array}\right]}\) \(\newcommand{\laspan}[1]{\text{Span}\{#1\}}\) \(\newcommand{\bcal}{\cal B}\) \(\newcommand{\ccal}{\cal C}\) \(\newcommand{\scal}{\cal S}\) \(\newcommand{\wcal}{\cal W}\) \(\newcommand{\ecal}{\cal E}\) \(\newcommand{\coords}[2]{\left\{#1\right\}_{#2}}\) \(\newcommand{\gray}[1]{\color{gray}{#1}}\) \(\newcommand{\lgray}[1]{\color{lightgray}{#1}}\) \(\newcommand{\rank}{\operatorname{rank}}\) \(\newcommand{\row}{\text{Row}}\) \(\newcommand{\col}{\text{Col}}\) \(\renewcommand{\row}{\text{Row}}\) \(\newcommand{\nul}{\text{Nul}}\) \(\newcommand{\var}{\text{Var}}\) \(\newcommand{\corr}{\text{corr}}\) \(\newcommand{\len}[1]{\left|#1\right|}\) \(\newcommand{\bbar}{\overline{\bvec}}\) \(\newcommand{\bhat}{\widehat{\bvec}}\) \(\newcommand{\bperp}{\bvec^\perp}\) \(\newcommand{\xhat}{\widehat{\xvec}}\) \(\newcommand{\vhat}{\widehat{\vvec}}\) \(\newcommand{\uhat}{\widehat{\uvec}}\) \(\newcommand{\what}{\widehat{\wvec}}\) \(\newcommand{\Sighat}{\widehat{\Sigma}}\) \(\newcommand{\lt}{<}\) \(\newcommand{\gt}{>}\) \(\newcommand{\amp}{&}\) \(\definecolor{fillinmathshade}{gray}{0.9}\)Objectives
After completing this section, you should be able to
- explain, in general terms, the origin of shielding effects in NMR spectroscopy.
- explain the number of peaks occurring in the 1H or 13C NMR spectrum of a simple compound, such as methyl acetate.
- describe, and sketch a diagram of, a simple NMR spectrometer.
- explain the difference in time scales of NMR and infrared spectroscopy.
- predict the number of peaks expected in the 1H or 13C NMR spectrum of a given compound.
Study Notes
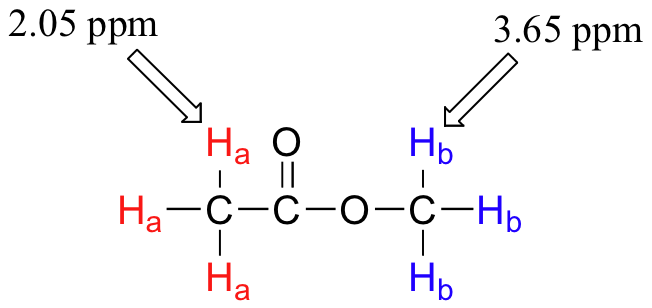
Before you go on, make sure that you understand that each signal in the 1H NMR spectrum shown for methyl acetate is due to a different proton environment. The three protons on the same methyl group are equivalent and appear in the spectrum as one signal. However, the two methyl groups are in two different environments (one is more deshielded) and so we see two signals in the whole spectrum (aside from the TMS reference peak).
Methyl acetate has a very simple 1H NMR spectrum, because there is no proton-proton coupling, and therefore no splitting of the signals. In later sections, we discuss splitting patterns in 1H NMR spectra and how they help a chemist determine the structure of organic compounds.
The basics of an NMR experiment
Given that chemically nonequivalent protons have different resonance frequencies in the same applied magnetic field, we can see how NMR spectroscopy can provide us with useful information about the structure of an organic molecule. A full explanation of how a modern NMR instrument functions is beyond the scope of this text, but in very simple terms, here is what happens. First, a sample compound (we'll use methyl acetate) is placed inside a very strong applied magnetic field (B0).
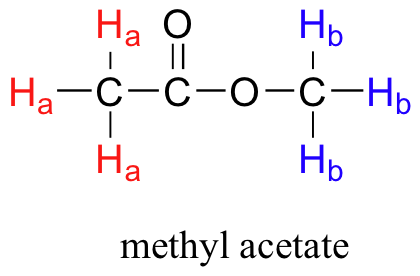
All of the protons begin to precess: the Ha protons at precessional frequency ωa, the Hb protons at ωb.At first, the magnetic moments of (slightly more than) half of the protons are aligned with B0, and half are aligned against B0. Then, the sample is hit with electromagnetic radiation in the radio frequency range. The two specific frequencies which match ωaandωb(i.e. the resonance frequencies) cause those Ha and Hb protons which are aligned with B0 to 'flip' so that they are now aligned against B0. In doing so, the protons absorb radiation at the two resonance frequencies. The NMR instrument records which frequencies were absorbed, as well as the intensity of each absorbance.
In most cases, a sample being analyzed by NMR is in solution. If we use a common laboratory solvent (diethyl ether, acetone, dichloromethane, ethanol, water, etc.) to dissolve our NMR sample, however, we run into a problem – there many more solvent protons in solution than there are sample protons, so the signals from the sample protons will be overwhelmed. To get around this problem, we use special NMR solvents in which all protons have been replaced by deuterium. Recall that deuterium is NMR-active, but its resonance frequency is very different from that of protons, and thus it is `invisible` in 1H-NMR. Some common NMR solvents are shown below.

The Chemical Shift
Let's look at an actual 1H-NMR plot for methyl acetate. Just as in IR and UV-vis spectroscopy, the vertical axis corresponds to intensity of absorbance, the horizontal axis to frequency (typically the vertical axis is not shown in an NMR spectrum).

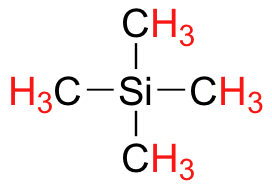
We see three absorbance signals: two of these correspond to Ha and Hb, while the peak at the far right of the spectrum corresponds to the 12 chemically equivalent protons in tetramethylsilane (TMS), a standard reference compound that was added to our sample.
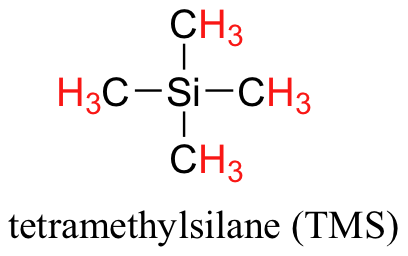
You may be wondering about a few things at this point - why is TMS necessary, and what is the meaning of the `ppm (δ)` label on the horizontal axis? Shouldn't the frequency units be in Hz? Keep in mind that NMR instruments of many different applied field strengths are used in organic chemistry laboratories, and that the proton's resonance frequency range depends on the strength of the applied field. The spectrum above was generated on an instrument with an applied field of approximately 7.1 Tesla, at which strength protons resonate in the neighborhood of 300 million Hz (chemists refer to this as a 300 MHz instrument). If our colleague in another lab takes the NMR spectrum of the same molecule using an instrument with a 2.4 Tesla magnet, the protons will resonate at around 100 million Hz (so we’d call this a 100 MHz instrument). It would be inconvenient and confusing to always have to convert NMR data according to the field strength of the instrument used. Therefore, chemists report resonance frequencies not as absolute values in Hz, but rather as values relative to a common standard, generally the signal generated by the protons in TMS. This is where the ppm – parts per million – term comes in. Regardless of the magnetic field strength of the instrument being used, the resonance frequency of the 12 equivalent protons in TMS is defined as a zero point. The resonance frequencies of protons in the sample molecule are then reported in terms of how much higher they are, in ppm, relative to the TMS signal (almost all protons in organic molecules have a higher resonance frequency than those in TMS, for reasons we shall explore quite soon).
The two proton groups in our methyl acetate sample are recorded as resonating at frequencies 2.05 and 3.67 ppm higher than TMS. One-millionth (1.0 ppm) of 300 MHz is 300 Hz. Thus 2.05 ppm, on this instrument, corresponds to 615 Hz, and 3.67 ppm corresponds to 1101 Hz. If the TMS protons observed by our 7.1 Tesla instrument resonate at exactly 300,000,000 Hz, this means that the protons in our ethyl acetate samples are resonating at 300,000,615 and 300,001,101 Hz, respectively. Likewise, if the TMS protons in our colleague's 2.4 Tesla instrument resonate at exactly 100 MHz, the methyl acetate protons in her sample resonate at 100,000,205 and 100,000,367 Hz (on the 100 MHz instrument, 1.0 ppm corresponds to 100 Hz). The absolute frequency values in each case are not very useful – they will vary according to the instrument used – but the difference in resonance frequency from the TMS standard, expressed in parts per million, should be the same regardless of the instrument.
Expressed this way, the resonance frequency for a given proton in a molecule is called its chemical shift. A frequently used symbolic designation for chemical shift in ppm is the lower-case Greek letter delta (δ). Most protons in organic compounds have chemical shift values between 0 and 12 ppm from TMS, although values below zero and above 12 are occasionally observed. By convention, the left-hand side of an NMR spectrum (higher chemical shift) is called downfield, and the right-hand direction is called upfield.
In our methyl acetate example we included for illustrative purposes a small amount of TMS standard directly in the sample, as was the common procedure for determining the zero point with older NMR instruments.That practice is generally no longer necessary, as modern NMR instruments are designed to use the deuterium signal from the solvent as a standard reference point, then to extrapolate the 0 ppm baseline that corresponds to the TMS proton signal (in an applied field of 7.1 Tesla, the deuterium atom in CDCl3 resonates at 32 MHz, compared to 300 MHz for the protons in TMS). In the remaining NMR spectra that we will see in this text we will not see an actual TMS signal, but we can always assume that the 0 ppm point corresponds to where the TMS protons would resonate if they were present.
Example
A proton has a chemical shift (relative to TMS) of 4.56 ppm.
- a) What is its chemical shift, expressed in Hz, in a 300 MHz instrument? On a 200 MHz instrument?
- b) What is its resonance frequency, expressed in Hz, in a 300 MHz instrument? On a 200 MHz instrument?
(Assume that in these instruments, the TMS protons resonate at exactly 300 or 200 MHz, respectively)
Solution
Diamagnetic shielding and deshielding
We come now to the question of why nonequivalent protons have different chemical shifts. The chemical shift of a given proton is determined primarily by its immediate electronic environment. Consider the methane molecule (CH4), in which the protons have a chemical shift of 0.23 ppm. The valence electrons around the methyl carbon, when subjected to B0, are induced to circulate and thus generate their own very small magnetic field that opposes B0. This induced field, to a small but significant degree, shields the nearby protons from experiencing the full force of B0, an effect known as local diamagnetic shielding. The methane protons therefore do not experience the full force of B0 - what they experience is called Beff, or the effective field, which is slightly weaker than B0.

Therefore, their resonance frequency is slightly lower than what it would be if they did not have electrons nearby to shield them.
Now consider methyl fluoride, CH3F, in which the protons have a chemical shift of 4.26 ppm, significantly higher than that of methane. This is caused by something called the deshielding effect. Because fluorine is more electronegative than carbon, it pulls valence electrons away from the carbon, effectively decreasing the electron density around each of the protons. For the protons, lower electron density means less diamagnetic shielding, which in turn means a greater overall exposure to B0, a stronger Beff, and a higher resonance frequency. Put another way, the fluorine, by pulling electron density away from the protons, is deshielding them, leaving them more exposed to B0. As the electronegativity of the substituent increases, so does the extent of deshielding, and so does the chemical shift. This is evident when we look at the chemical shifts of methane and three halomethane compounds (remember that electronegativity increases as we move up a column in the periodic table).

To a large extent, then, we can predict trends in chemical shift by considering how much deshielding is taking place near a proton. The chemical shift of trichloromethane is, as expected, higher than that of dichloromethane, which is in turn higher than that of chloromethane.

The deshielding effect of an electronegative substituent diminishes sharply with increasing distance:
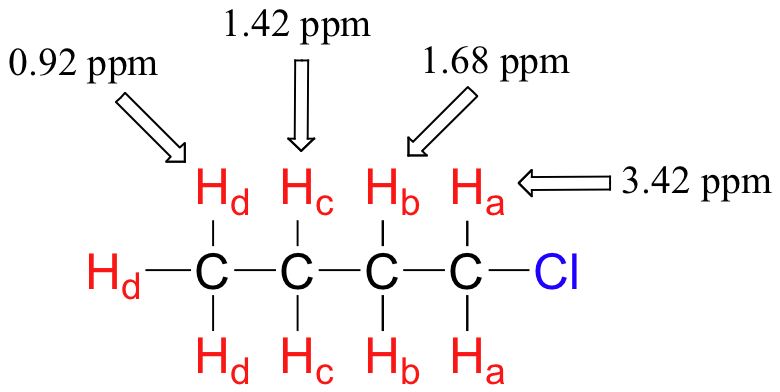
The presence of an electronegative oxygen, nitrogen, sulfur, or sp2-hybridized carbon also tends to shift the NMR signals of nearby protons slightly downfield:
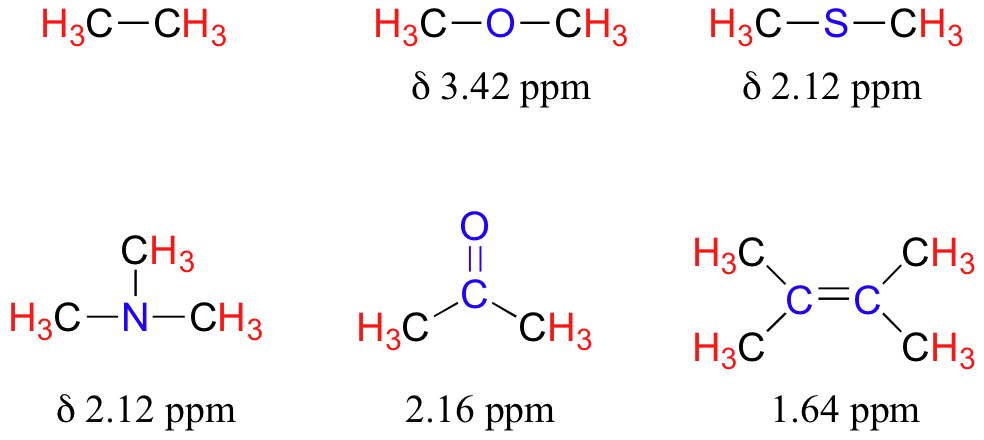
Table 2 lists typical chemical shift values for protons in different chemical environments.
Armed with this information, we can finally assign the two peaks in the the 1H-NMR spectrum of methyl acetate that we saw a few pages back. The signal at 3.65 ppm corresponds to the methyl ester protons (Hb), which are deshielded by the adjacent oxygen atom. The upfield signal at 2.05 ppm corresponds to the acetate protons (Ha), which is deshielded - but to a lesser extent - by the adjacent carbonyl group.
Finally, a note on the use of TMS as a standard in NMR spectroscopy: one of the main reasons why the TMS proton signal was chosen as a zero-point is that the TMS protons are highly shielded: silicon is slightly less electronegative than carbon, and therefore donates some additional shielding electron density. Very few organic molecules contain protons with chemical shifts that are negative relative to TMS.
Exercise
3. 2-cholorobutene shows 4 different hydrogen signals. Explain why this is.
- Answer
-
3. The same colors represent the same signal. 4 different colors for 4 different signals. The hydrogen on the alkene would give two different signals.
Contributors and Attributions
Dr. Dietmar Kennepohl FCIC (Professor of Chemistry, Athabasca University)
Prof. Steven Farmer (Sonoma State University)
Organic Chemistry With a Biological Emphasis by Tim Soderberg (University of Minnesota, Morris)

