
20.3: Spectroscopy of Amines
- Page ID
- 45609
\( \newcommand{\vecs}[1]{\overset { \scriptstyle \rightharpoonup} {\mathbf{#1}} } \)
\( \newcommand{\vecd}[1]{\overset{-\!-\!\rightharpoonup}{\vphantom{a}\smash {#1}}} \)
\( \newcommand{\dsum}{\displaystyle\sum\limits} \)
\( \newcommand{\dint}{\displaystyle\int\limits} \)
\( \newcommand{\dlim}{\displaystyle\lim\limits} \)
\( \newcommand{\id}{\mathrm{id}}\) \( \newcommand{\Span}{\mathrm{span}}\)
( \newcommand{\kernel}{\mathrm{null}\,}\) \( \newcommand{\range}{\mathrm{range}\,}\)
\( \newcommand{\RealPart}{\mathrm{Re}}\) \( \newcommand{\ImaginaryPart}{\mathrm{Im}}\)
\( \newcommand{\Argument}{\mathrm{Arg}}\) \( \newcommand{\norm}[1]{\| #1 \|}\)
\( \newcommand{\inner}[2]{\langle #1, #2 \rangle}\)
\( \newcommand{\Span}{\mathrm{span}}\)
\( \newcommand{\id}{\mathrm{id}}\)
\( \newcommand{\Span}{\mathrm{span}}\)
\( \newcommand{\kernel}{\mathrm{null}\,}\)
\( \newcommand{\range}{\mathrm{range}\,}\)
\( \newcommand{\RealPart}{\mathrm{Re}}\)
\( \newcommand{\ImaginaryPart}{\mathrm{Im}}\)
\( \newcommand{\Argument}{\mathrm{Arg}}\)
\( \newcommand{\norm}[1]{\| #1 \|}\)
\( \newcommand{\inner}[2]{\langle #1, #2 \rangle}\)
\( \newcommand{\Span}{\mathrm{span}}\) \( \newcommand{\AA}{\unicode[.8,0]{x212B}}\)
\( \newcommand{\vectorA}[1]{\vec{#1}} % arrow\)
\( \newcommand{\vectorAt}[1]{\vec{\text{#1}}} % arrow\)
\( \newcommand{\vectorB}[1]{\overset { \scriptstyle \rightharpoonup} {\mathbf{#1}} } \)
\( \newcommand{\vectorC}[1]{\textbf{#1}} \)
\( \newcommand{\vectorD}[1]{\overrightarrow{#1}} \)
\( \newcommand{\vectorDt}[1]{\overrightarrow{\text{#1}}} \)
\( \newcommand{\vectE}[1]{\overset{-\!-\!\rightharpoonup}{\vphantom{a}\smash{\mathbf {#1}}}} \)
\( \newcommand{\vecs}[1]{\overset { \scriptstyle \rightharpoonup} {\mathbf{#1}} } \)
\(\newcommand{\longvect}{\overrightarrow}\)
\( \newcommand{\vecd}[1]{\overset{-\!-\!\rightharpoonup}{\vphantom{a}\smash {#1}}} \)
\(\newcommand{\avec}{\mathbf a}\) \(\newcommand{\bvec}{\mathbf b}\) \(\newcommand{\cvec}{\mathbf c}\) \(\newcommand{\dvec}{\mathbf d}\) \(\newcommand{\dtil}{\widetilde{\mathbf d}}\) \(\newcommand{\evec}{\mathbf e}\) \(\newcommand{\fvec}{\mathbf f}\) \(\newcommand{\nvec}{\mathbf n}\) \(\newcommand{\pvec}{\mathbf p}\) \(\newcommand{\qvec}{\mathbf q}\) \(\newcommand{\svec}{\mathbf s}\) \(\newcommand{\tvec}{\mathbf t}\) \(\newcommand{\uvec}{\mathbf u}\) \(\newcommand{\vvec}{\mathbf v}\) \(\newcommand{\wvec}{\mathbf w}\) \(\newcommand{\xvec}{\mathbf x}\) \(\newcommand{\yvec}{\mathbf y}\) \(\newcommand{\zvec}{\mathbf z}\) \(\newcommand{\rvec}{\mathbf r}\) \(\newcommand{\mvec}{\mathbf m}\) \(\newcommand{\zerovec}{\mathbf 0}\) \(\newcommand{\onevec}{\mathbf 1}\) \(\newcommand{\real}{\mathbb R}\) \(\newcommand{\twovec}[2]{\left[\begin{array}{r}#1 \\ #2 \end{array}\right]}\) \(\newcommand{\ctwovec}[2]{\left[\begin{array}{c}#1 \\ #2 \end{array}\right]}\) \(\newcommand{\threevec}[3]{\left[\begin{array}{r}#1 \\ #2 \\ #3 \end{array}\right]}\) \(\newcommand{\cthreevec}[3]{\left[\begin{array}{c}#1 \\ #2 \\ #3 \end{array}\right]}\) \(\newcommand{\fourvec}[4]{\left[\begin{array}{r}#1 \\ #2 \\ #3 \\ #4 \end{array}\right]}\) \(\newcommand{\cfourvec}[4]{\left[\begin{array}{c}#1 \\ #2 \\ #3 \\ #4 \end{array}\right]}\) \(\newcommand{\fivevec}[5]{\left[\begin{array}{r}#1 \\ #2 \\ #3 \\ #4 \\ #5 \\ \end{array}\right]}\) \(\newcommand{\cfivevec}[5]{\left[\begin{array}{c}#1 \\ #2 \\ #3 \\ #4 \\ #5 \\ \end{array}\right]}\) \(\newcommand{\mattwo}[4]{\left[\begin{array}{rr}#1 \amp #2 \\ #3 \amp #4 \\ \end{array}\right]}\) \(\newcommand{\laspan}[1]{\text{Span}\{#1\}}\) \(\newcommand{\bcal}{\cal B}\) \(\newcommand{\ccal}{\cal C}\) \(\newcommand{\scal}{\cal S}\) \(\newcommand{\wcal}{\cal W}\) \(\newcommand{\ecal}{\cal E}\) \(\newcommand{\coords}[2]{\left\{#1\right\}_{#2}}\) \(\newcommand{\gray}[1]{\color{gray}{#1}}\) \(\newcommand{\lgray}[1]{\color{lightgray}{#1}}\) \(\newcommand{\rank}{\operatorname{rank}}\) \(\newcommand{\row}{\text{Row}}\) \(\newcommand{\col}{\text{Col}}\) \(\renewcommand{\row}{\text{Row}}\) \(\newcommand{\nul}{\text{Nul}}\) \(\newcommand{\var}{\text{Var}}\) \(\newcommand{\corr}{\text{corr}}\) \(\newcommand{\len}[1]{\left|#1\right|}\) \(\newcommand{\bbar}{\overline{\bvec}}\) \(\newcommand{\bhat}{\widehat{\bvec}}\) \(\newcommand{\bperp}{\bvec^\perp}\) \(\newcommand{\xhat}{\widehat{\xvec}}\) \(\newcommand{\vhat}{\widehat{\vvec}}\) \(\newcommand{\uhat}{\widehat{\uvec}}\) \(\newcommand{\what}{\widehat{\wvec}}\) \(\newcommand{\Sighat}{\widehat{\Sigma}}\) \(\newcommand{\lt}{<}\) \(\newcommand{\gt}{>}\) \(\newcommand{\amp}{&}\) \(\definecolor{fillinmathshade}{gray}{0.9}\)NMR
The hydrogens attached to an amine show up ~ 0.5-5.0 ppm. The location is dependent on the amount of hydrogen bonding and the sample's concentration.
The hydrogens on carbons directly bonded to an amine typically appear ~2.3-3.0 ppm.
Addition of D2O will normally cause all hydrogens on non-carbon atoms to exchange with deuteriums, thus making these resonances "disappear." Addition of a few drops of D2O causing a signal to vanish can help confirm the presence of -NH.

IR
The infrared spectrum of aniline is shown beneath the following table. Some of the characteristic absorptions for C-H stretching and aromatic ring substitution are also marked, but not colored.
|
Amine Class |
Stretching Vibrations |
Bending Vibrations |
|
|---|---|---|---|
|
Primary (1°) |
The N-H stretching absorption is less sensitive to hydrogen bonding than are O-H absorptions. In the gas phase and in dilute CCl4 solution free N-H absorption is observed in the 3400 to 3500 cm-1 region. Primary aliphatic amines display two well-defined peaks due to asymmetric (higher frequency) and symmetric N-H stretching, separated by 80 to 100 cm-1. In aromatic amines these absorptions are usually 40 to 70 cm-1 higher in frequency. A smaller absorption near 3200 cm-1 (shaded orange in the spectra) is considered to be the result of interaction between an overtone of the 1600 cm-1 band with the symmetric N-H stretching band. |
Strong in-plane NH2 scissoring absorptions at 1550 to 1650 cm-1, and out-of-plane wagging at 650 to 900 cm-1 (usually broad) are characteristic of 1°-amines. |
|
|
Secondary (2°) |
Secondary amines exhibit only one absorption near 3420 cm-1. Hydrogen bonding in concentrated liquids shifts these absorptions to lower frequencies by about 100 cm-1. Again, this absorption appears at slightly higher frequency when the nitrogen atom is bonded to an aromatic ring. |
A weak N-H bending absorption is sometimes visible at 1500 to 1600 cm-1. A broad wagging absorption at 650 to 900 cm-1 may be discerned in liquid film samples. |
|
|
Tertiary (3°) |
No N-H absorptions. The C-N absorptions are found in the same range, 1200 to 1350 cm-1 (aromatic) and 1000 to 1250 cm-1 (aliphatic) as for 1°-amines. |
Aside from the C-N stretch noted on the left, these compounds have spectra characteristic of their alkyl and aryl substituents. |
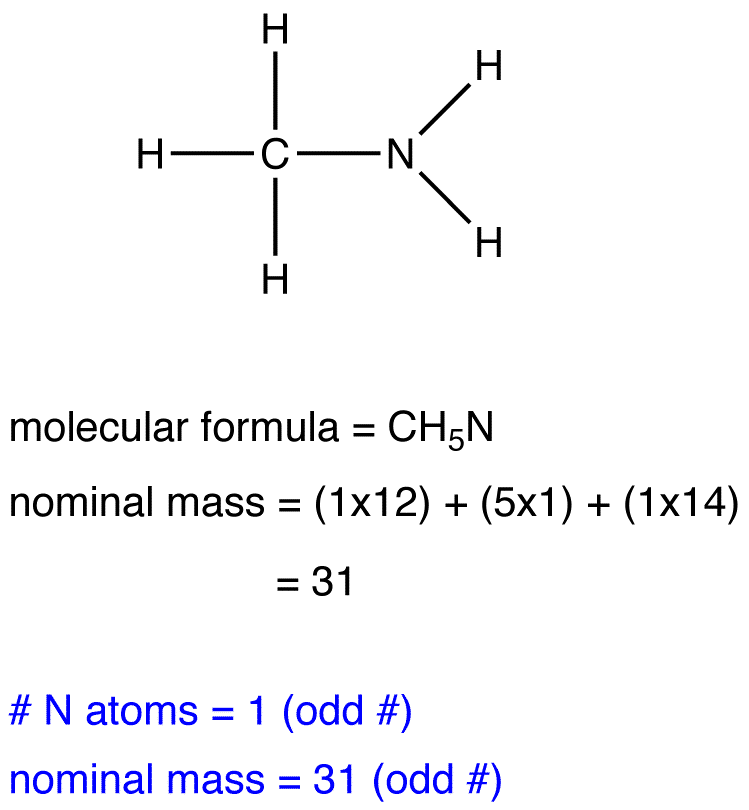
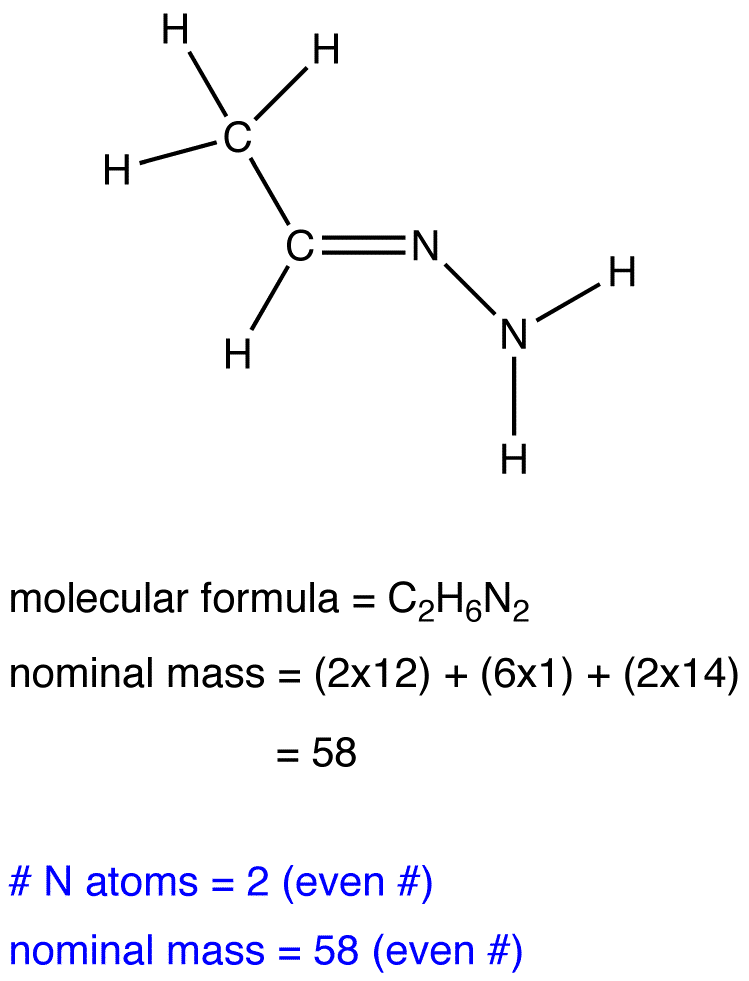
Mass Spectrometry and the Nitrogen Rule
The nitrogen rule states that a molecule that has no or even number of nitrogen atoms has an even nominal mass, whereas a molecule that has an odd number of nitrogen atoms has an odd nominal mass.
eg. 1:

eg. 2:
eg. 3:
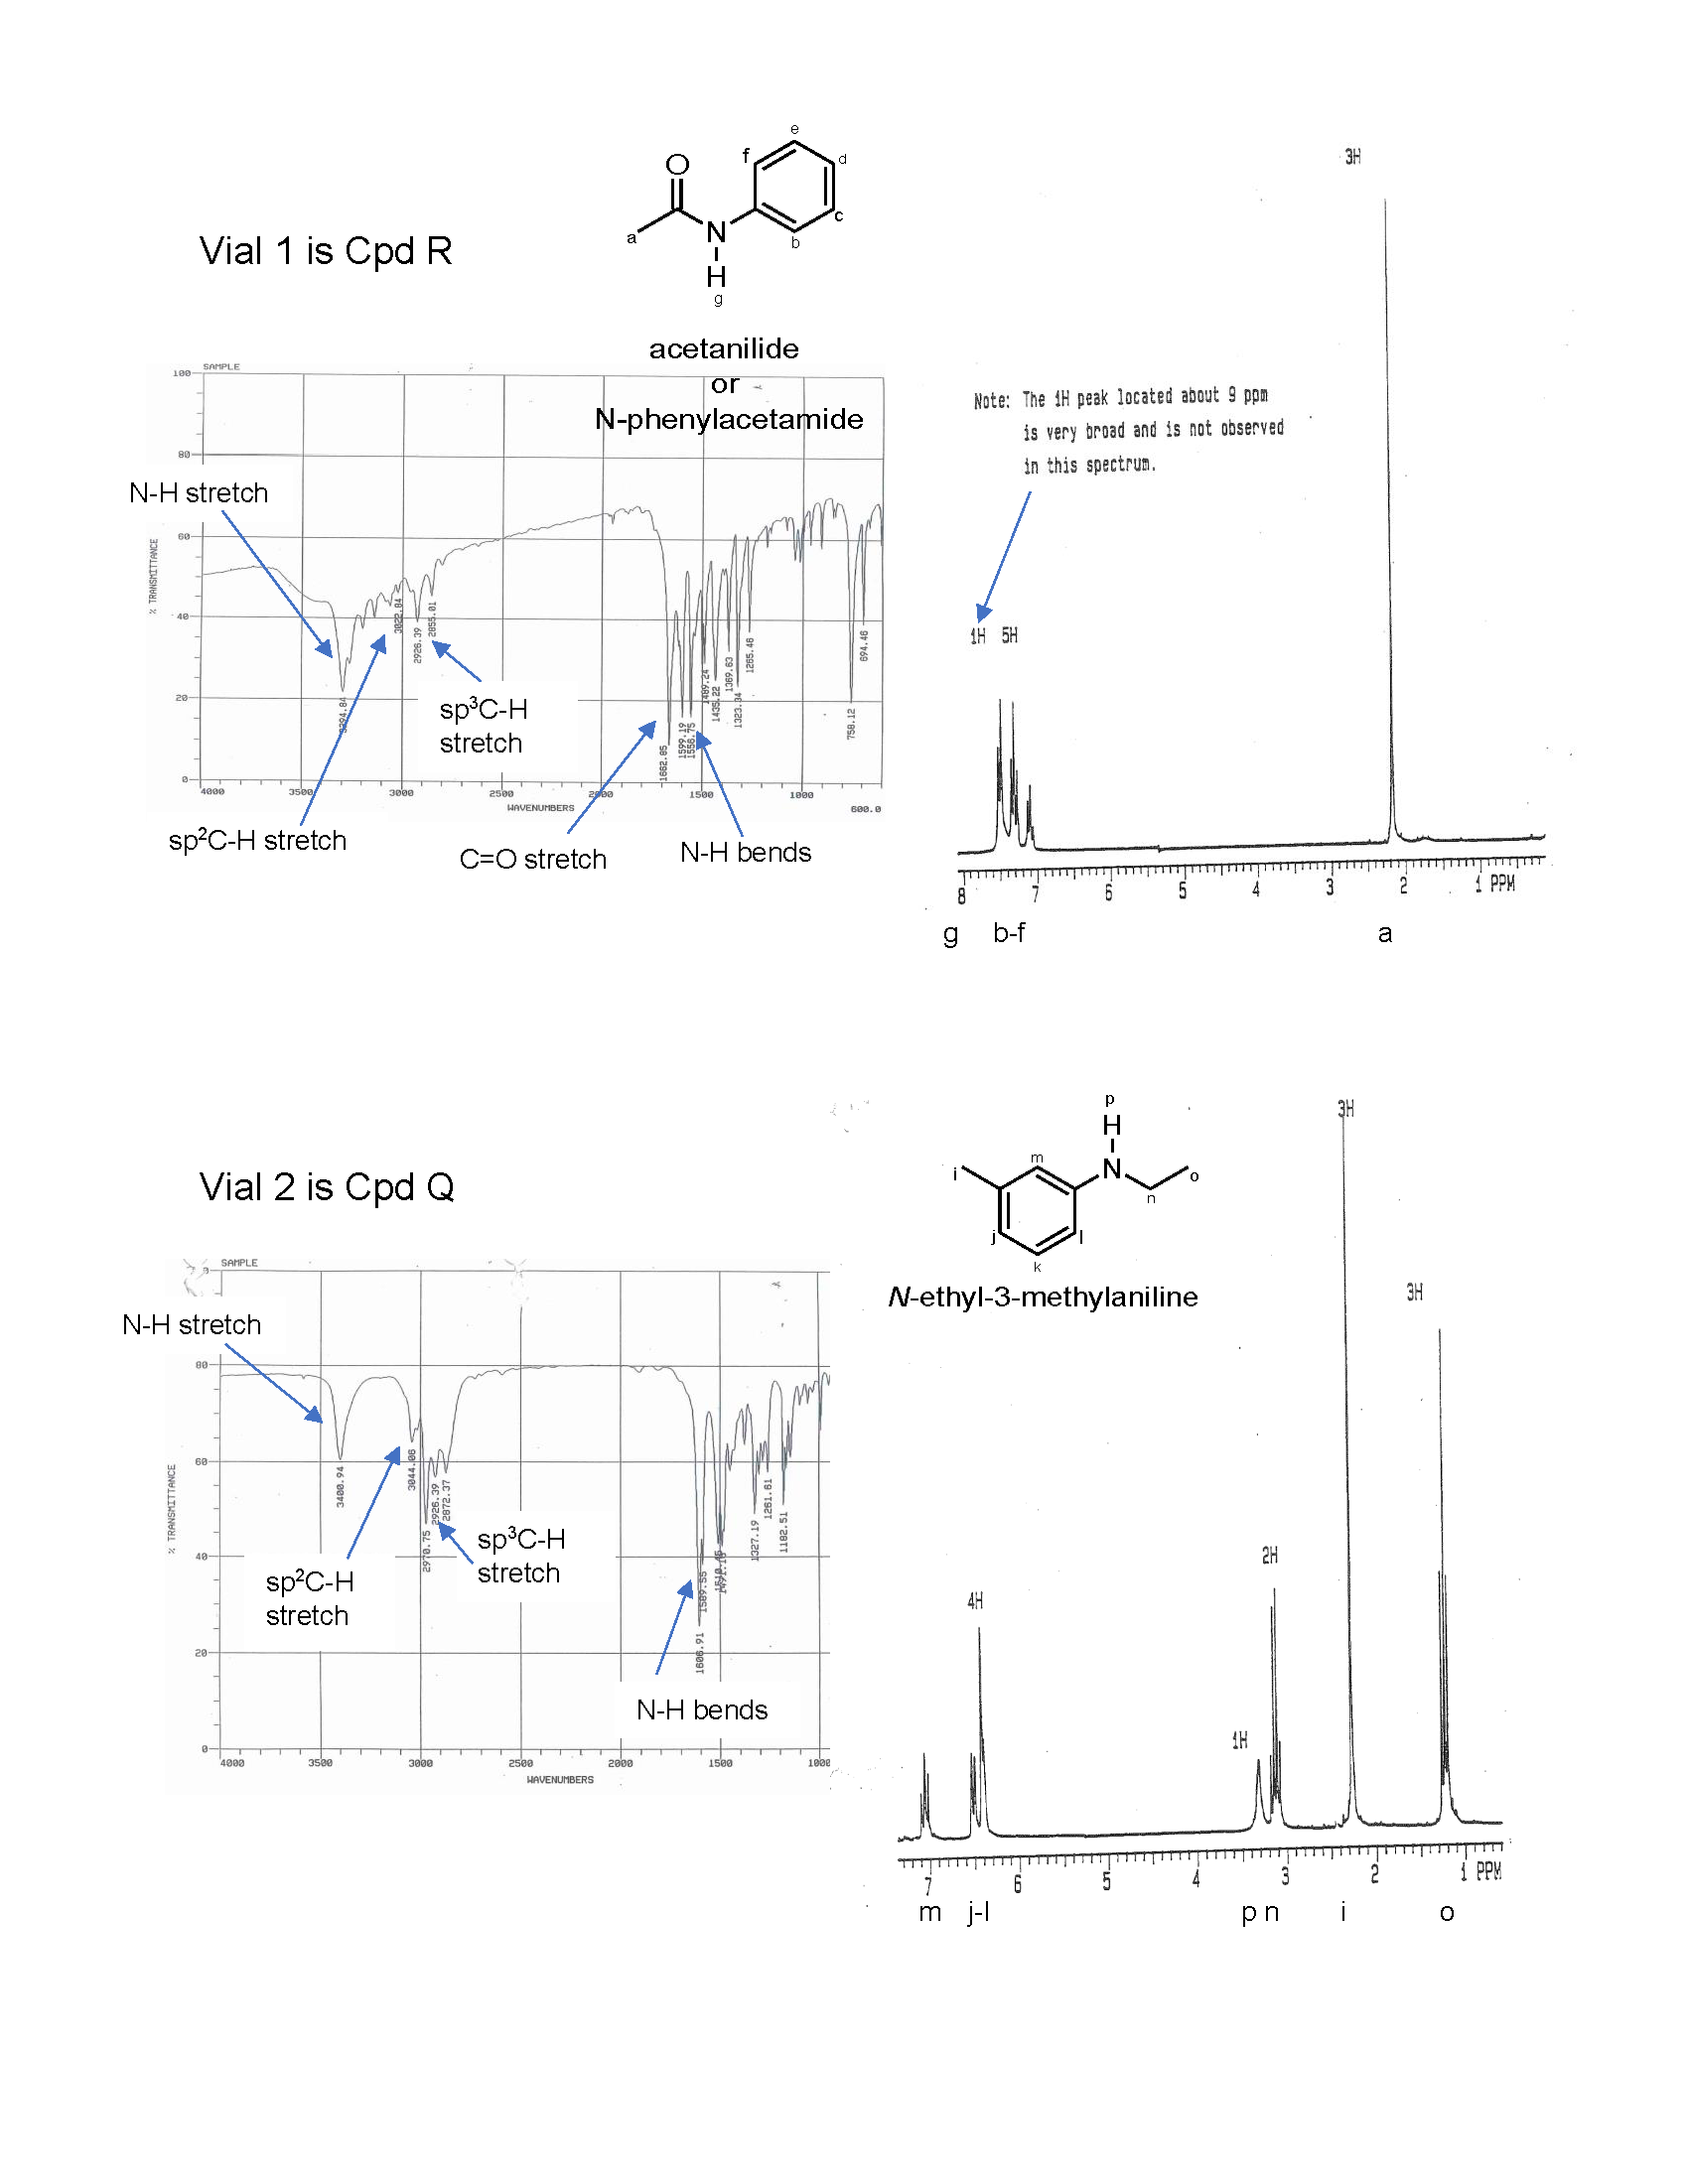
Exercise
7. Oh no! The labels have fallen off two samples: Q and R. The elemental analysis for the samples indicated the following composition: compound Q is 81.15% C, 8.34% H, and 10.52% O and compound R is 71.08% C, 6.72% H, 10.36% N, and 11.84% O. Fortunately, we can analyze the samples using IR and 1H NMR spectroscopy. Name and draw the bond-line structures for compounds Q and R using the information provided. Support your answer by correlating the spectral data to the compound structures.
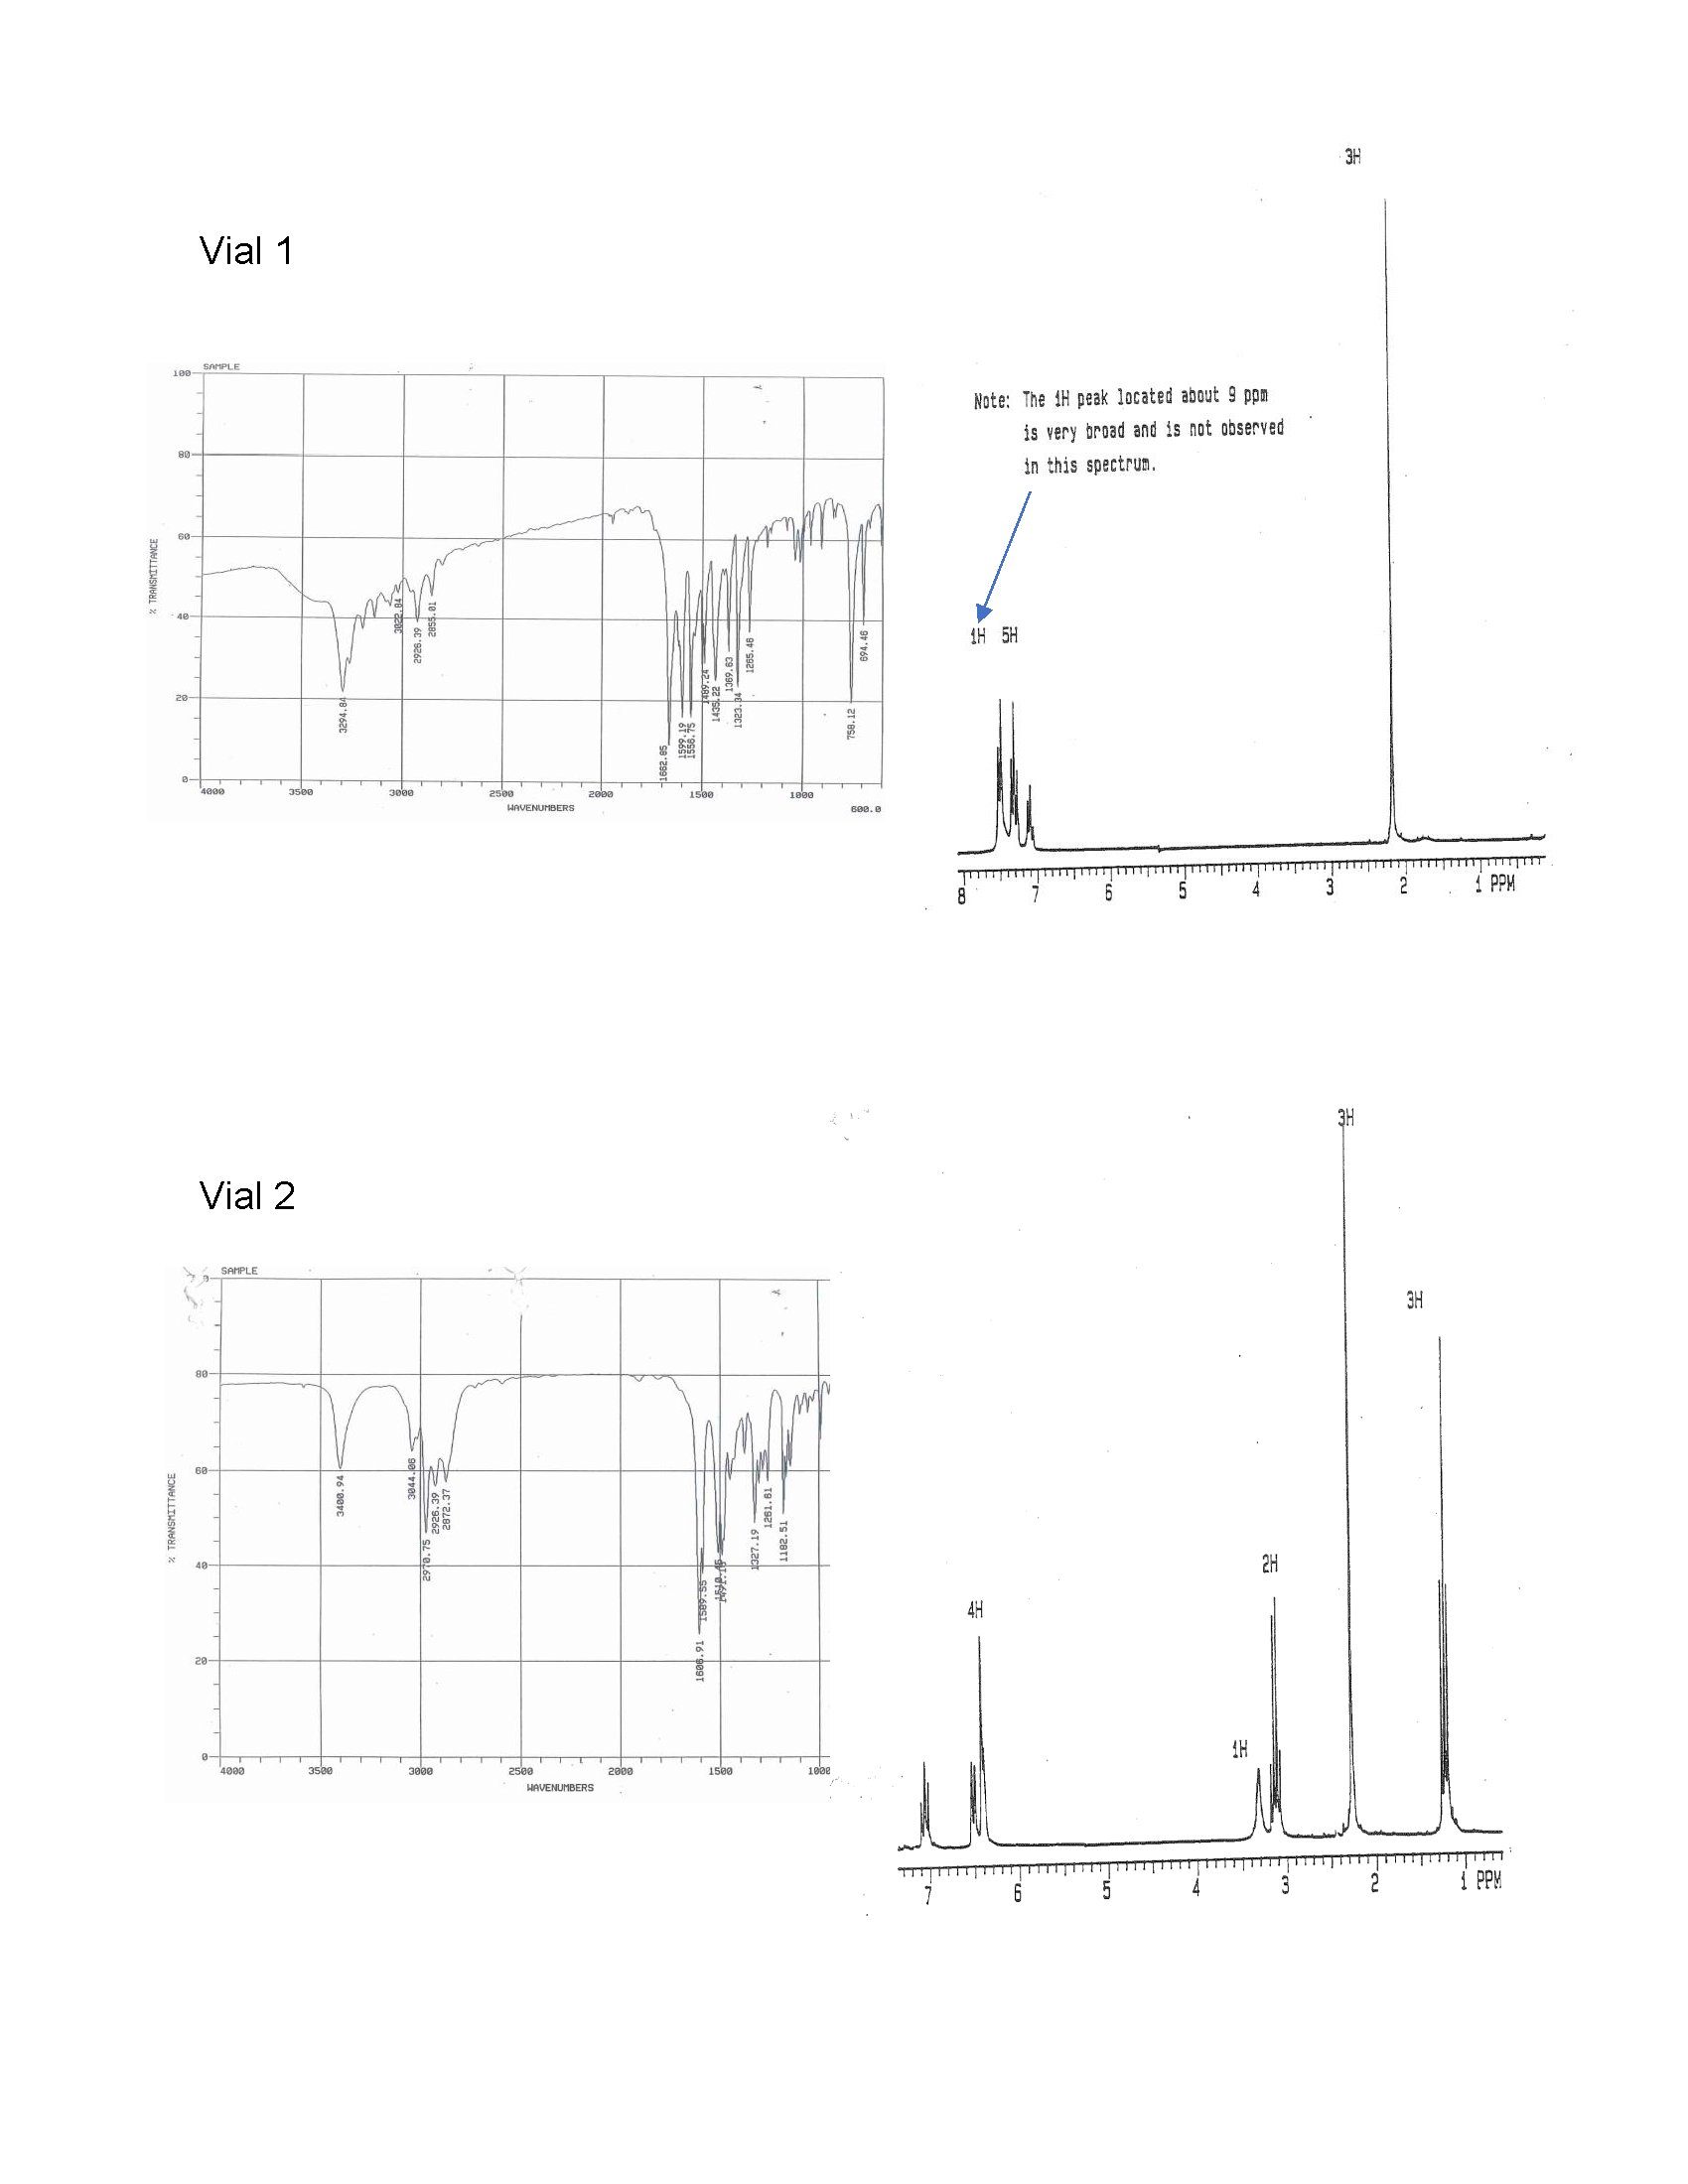
- Answer
-
7. Vial 1 contains compound R which is acetanilide. Vial 2 contains compound Q which is N-ethyl-3-methylaniline.

Contributors and Attributions
Dr. Dietmar Kennepohl FCIC (Professor of Chemistry, Athabasca University)
Prof. Steven Farmer (Sonoma State University)
William Reusch, Professor Emeritus (Michigan State U.), Virtual Textbook of Organic Chemistry
- Gamini Gunawardena from the OChemPal site (Utah Valley University)