
7.6: Interpreting 2-D NMR Spectra
- Page ID
- 432216
- understand how to analyze the different 2-D spectra and what information you can gather from each.
- determine the structure of an unknown molecule using different types of NMR spectroscopy.
This page is devoted to explaining solved structure elucidation problems using different types of 1-D and 2-D NMR spectra to help guide you through different scenarios. The first scenario involves analyzing different types of NMR spectra to determine if you made the desired product.
Did you synthesize menthyl anthranilate? The spectra were taken in DMSO-d6. Use the spectra to determine whether the product desired was made.
1H:
COSY:
13C:
DEPT-135:
HMBC:
Solution
With this example, we have the advantage to knowing what our structure is. It would be helpful to look up what menthyl anthranilate's structure is to start before moving on.
Menthyl Anthranilate: 
Atoms Numbered in Menthyl Anthranilate: 
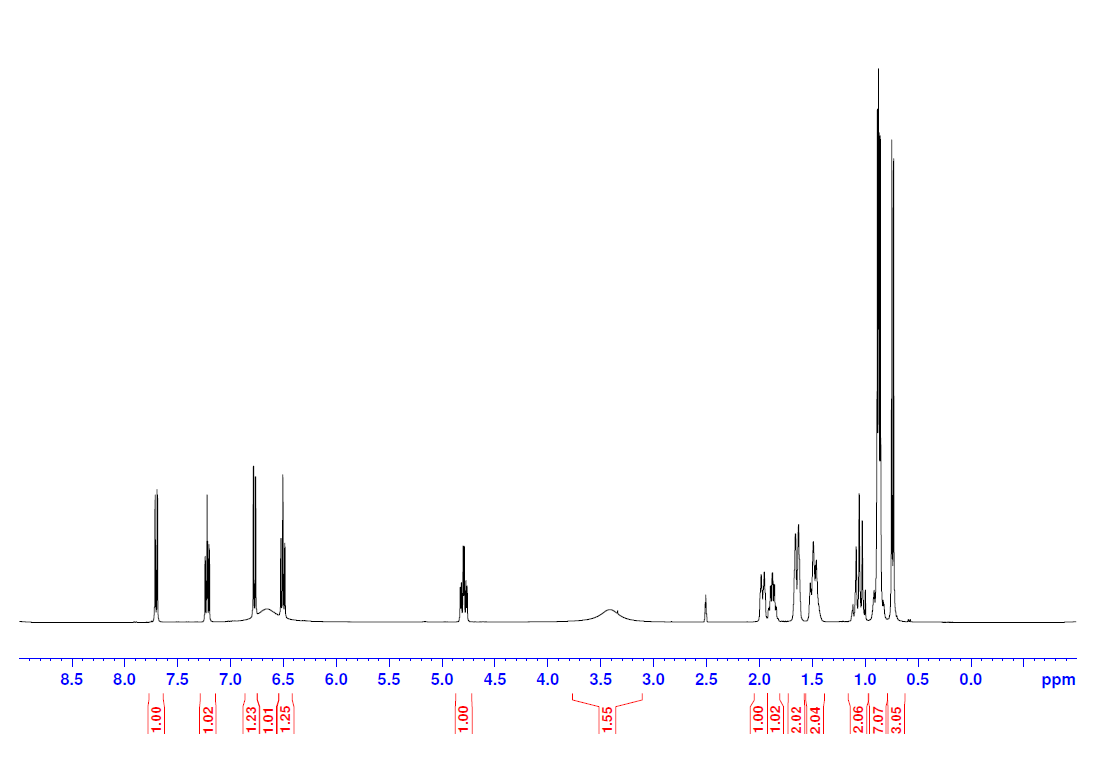
Step 1: Characterization of the peaks in 1H NMR spectrum by considering chemical shift, integration, spin-spin splitting, and coupling constants. Remember if protons are coupled to each other, they will have the same coupling constant, J.
The deuterated solvent is DMSO and the peak for residual solvent appears at 2.50 ppm, which is why this peak is missing integration. The peak at 0.7 ppm is the methyl group at position 7 on the numbered structure. The integration is 3 and there is no other peak that will have that integration. The next peak at 0.9 ppm are the other methyl groups labeled 9 and 10. Both of these peaks are doublets, which correlates to them having one neighboring hydrogen (positions 6 and 8) and this is the case for both. The next three peaks to come all integrate to 2 protons, which will correspond to positions 1, 2, and 5. The hydrogens at position 5 will be the furthest downfield since it is closest to an electron-withdrawing group. Remember, the closer the hydrogen is to an electron-withdrawing group, the more the magnetic field surrounding the hydrogen is influenced. The peak at 4.8 ppm is H4. It is directly attached to an electron-withdrawing group and it integrates to 1H. The broad peak at 3.4 ppm corresponds to the NH2. Broad peaks in NMR often correspond to an averaging and do not show spin-spin splitting. In this case, the hydrogens attached to nitrogen are exchangeable leading to an averaging of "seeing" a different H spin state depending on if an H is attached or not. The peaks in the 6.5 to 8.0 ppm range are the aromatic protons. COSY will help identify the peaks that were not labeled specifically in the 1H spectrum.
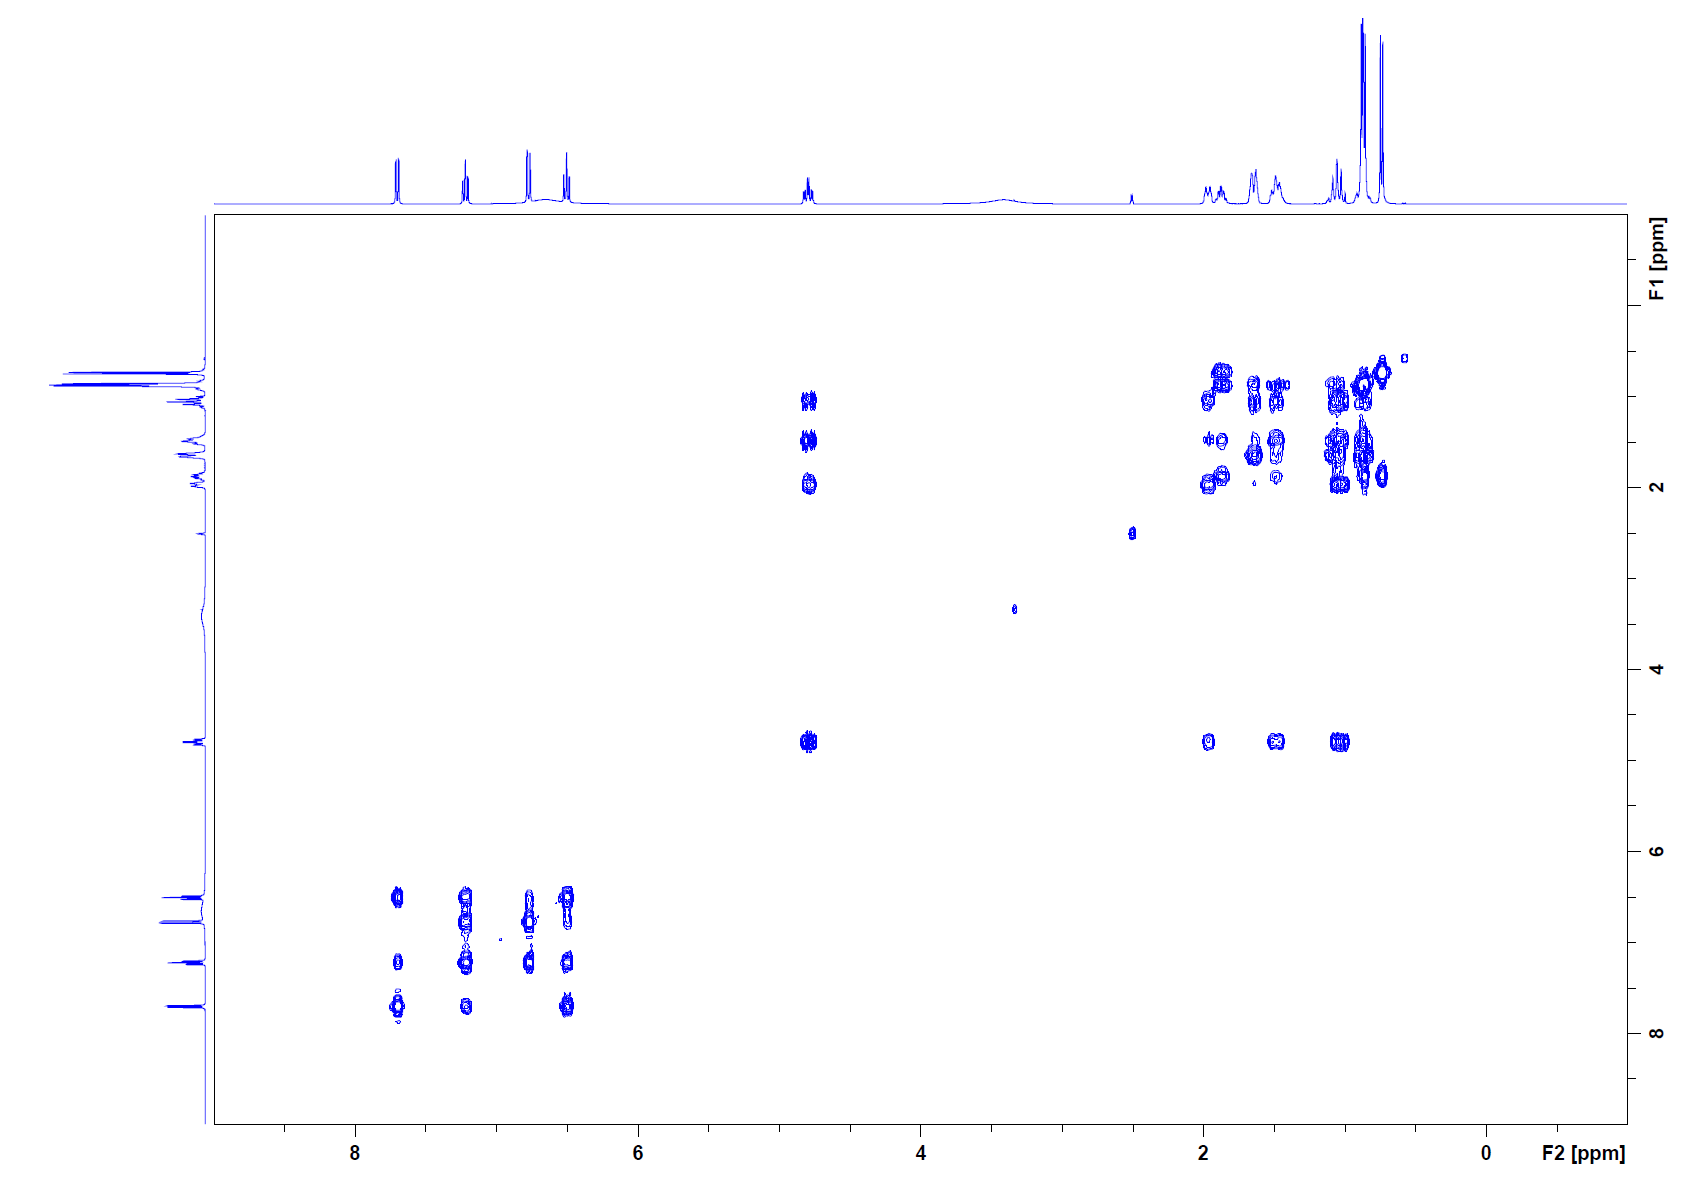
Step 2: Even with the COSY, it is difficult to completely elucidate the structure. The cross peaks in the 6.5-8.0 ppm range are all protons that are part of an aromatic ring. The correlations are indicating that the two groups coming off the ring will be ortho to each other. The correlations indicate that the peak at 7.7 ppm has two other neighbors, which leads to the doublet of doublets. This is the same for the peak at 6.6 ppm, which is also a doublet of doublets. The 7.2 ppm peak is a triplet of doublets, so a total of 3 neighbors and there are 3 cross peaks to confirm this. The peak at 6.5 ppm is also a triplet of doublets and has 3 cross peaks. The only way this pattern can occur is to have ortho groups coming off the aromatic ring. The next protons that can be used to help elucidate the structure come from the peak at 4.8 ppm. This is the methine group attached to the oxygen at C4. The cross peak at (4.8, 1.1) is a methylene group (C5) attached to C4. The cross peak at (4.8, 1.5) indicates a correlation to another methylene group (possibly C2). The cross peak at (4.8, 1.9) is a correlation to another methine group (C3). The peak at 0.9 ppm is a methyl group. The cross peaks of this methyl group indicate that it is attached to a methine group (C6). The remaining correlations are difficult to decipher since it is squished into a small region with overlapping cross peaks.
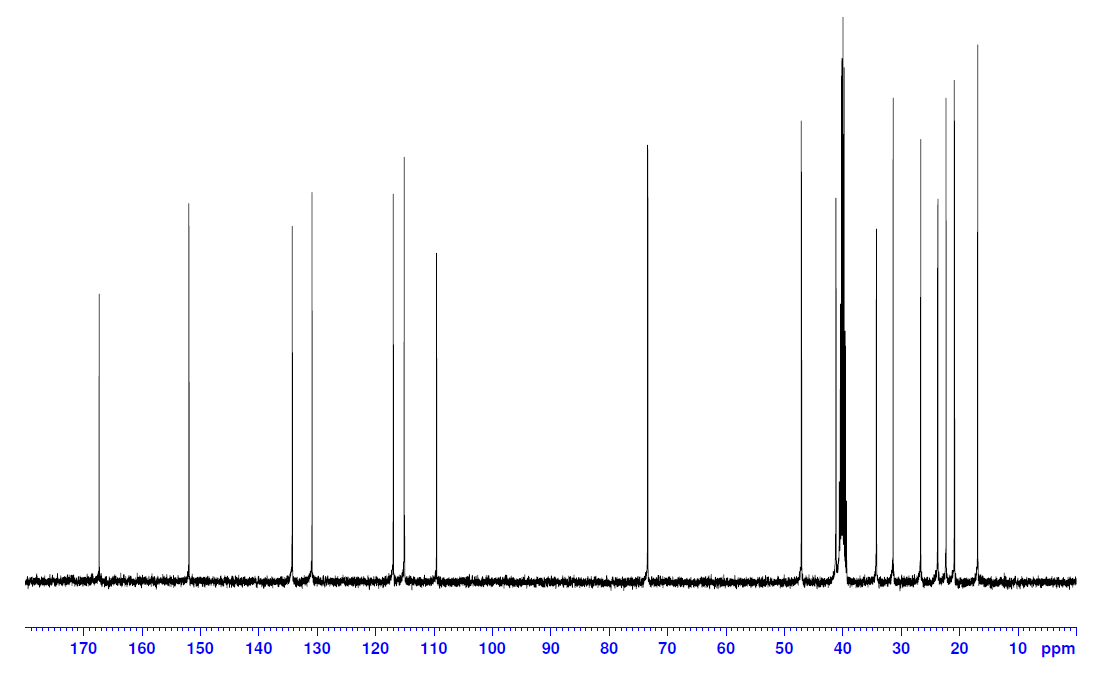
Step 3: 13C NMR analysis is a necessary step in full structural characterization. However, ¹³C NMR alone does not provide enough information to assign the carbons in the molecule. It can be used to confirm the number of carbons in the molecule and this is where DEPT or 2-D NMR will assist. The 13C spectrum above does indeed show all seventeen carbons. The group of peaks around 40 ppm is DMSO-d6, so will not be counted towards the seventeen. However, the peak at 41 ppm is one of the seventeen total carbons.
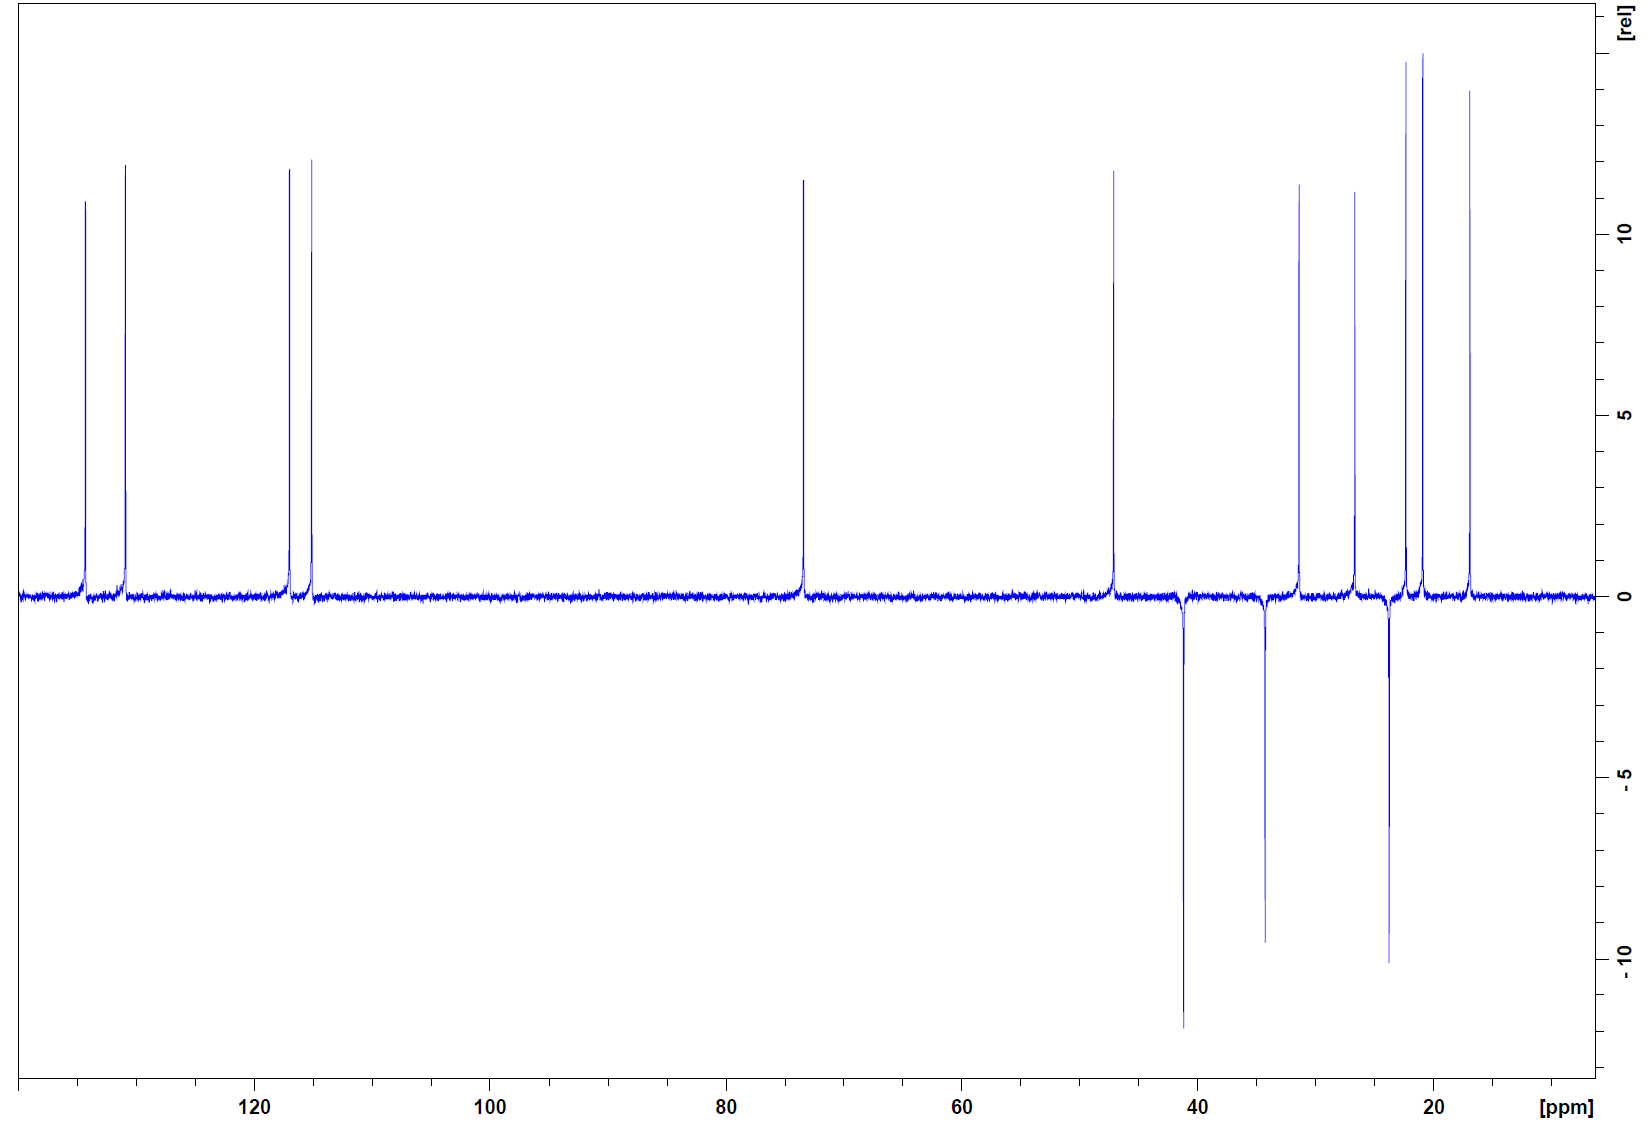
Step 4: DEPT will tell what kinds of carbons do we have in the molecule. There are three quaternary carbons (absent from the DEPT spectrum compared to the 13C spectrum), three methylene groups (negative peaks), and eleven methine and methyl groups.
Step 5: In the HMBC, there are cross peaks that extend to our carbonyl at 167 ppm. These cross peaks indicate that the carbonyl is attached to the aromatic ring just as we can see in the structure. It also shows that there is a correlation between the carbonyl carbon and the methine attached to the oxygen, this confirms the ester functionality. The two other quaternary carbons (152 ppm and 110 ppm) also have cross peaks indicating connection as part of the aromatic ring. Because the carbon spectrum is a wider range, it spreads out the cross peaks and there is less overlap and it is easier to analyze each cross peak. As this is done, each one confirms that the structure is indeed menthyl anthranilate.
This process can be used for known and unknown structure elucidation. You can also see that in more complicated molecules, multiple spectra help shine light on all parts of the molecule.
This next example show how you attempt to determine an unknown structure from molecular formula and different types of 1-D and 2-D NMR spectra.
Identify the compound C8H10 from the spectra below. The sample was dissolved in CDCl3.
1H:
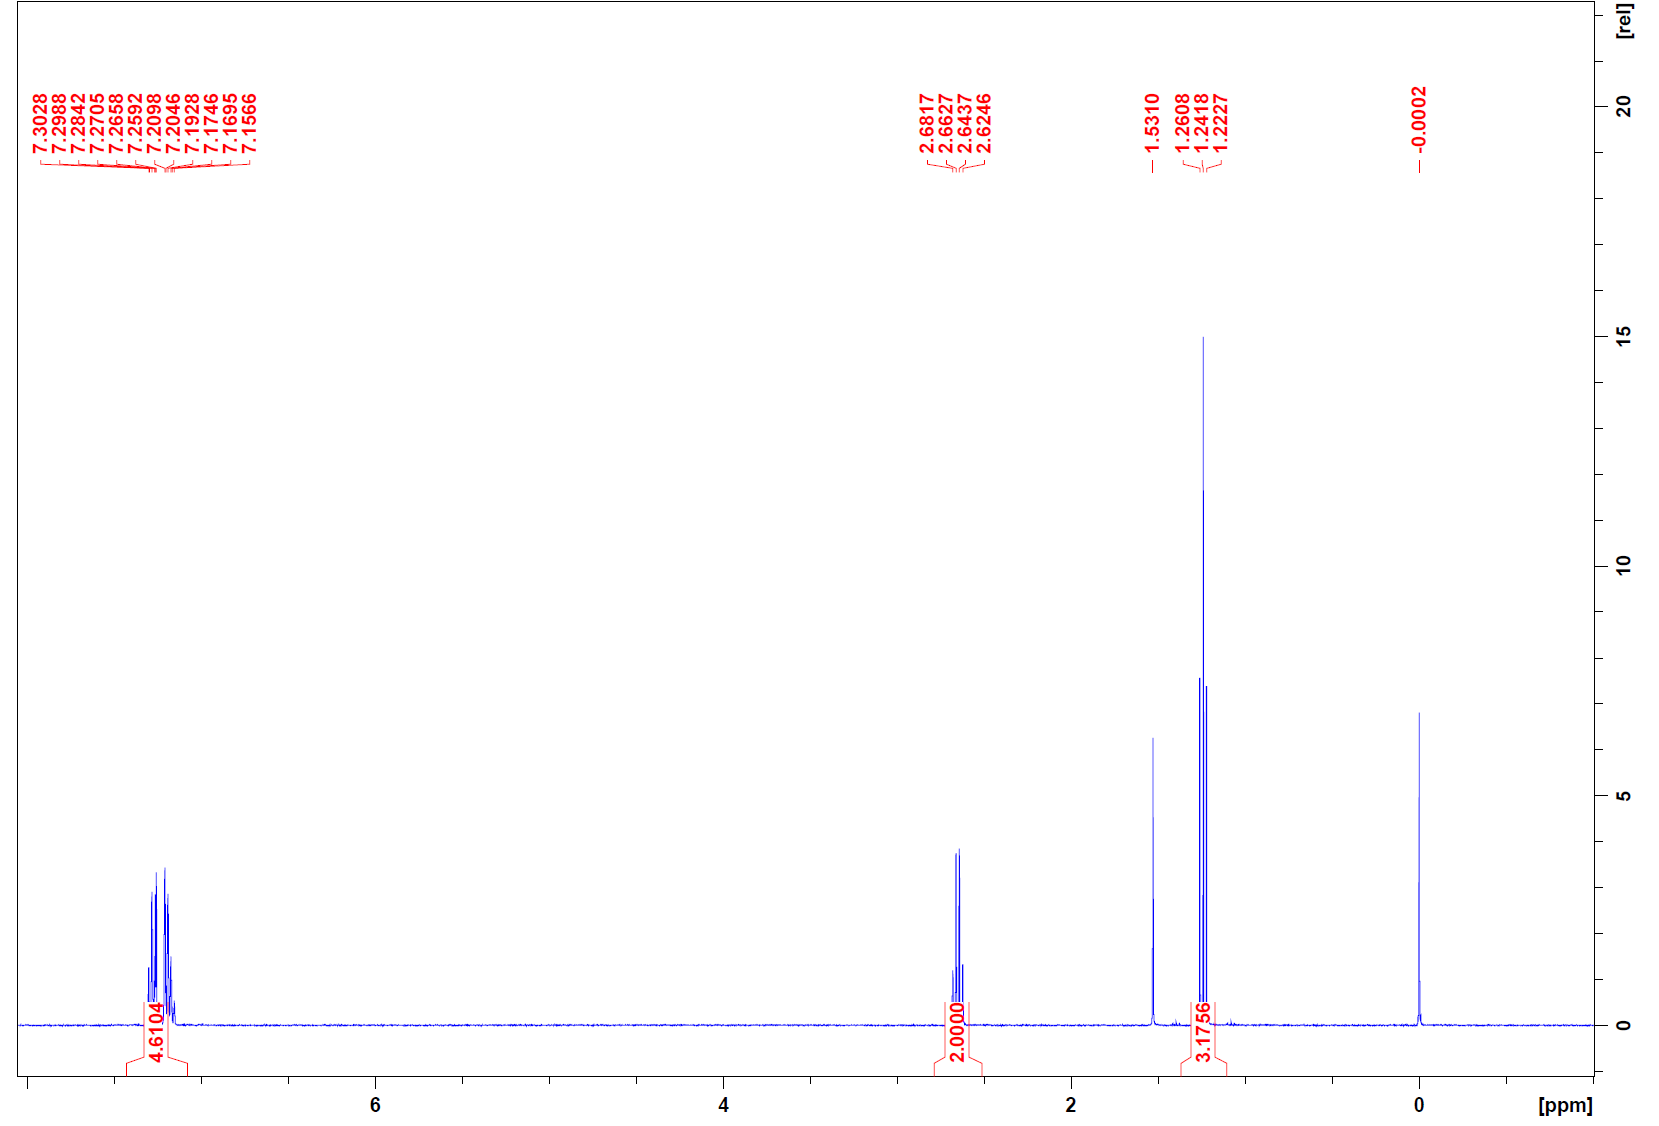
Note: The peak at 0 ppm is TMS and the peak at 1.5 ppm is water. These can be disregarded in analysis.
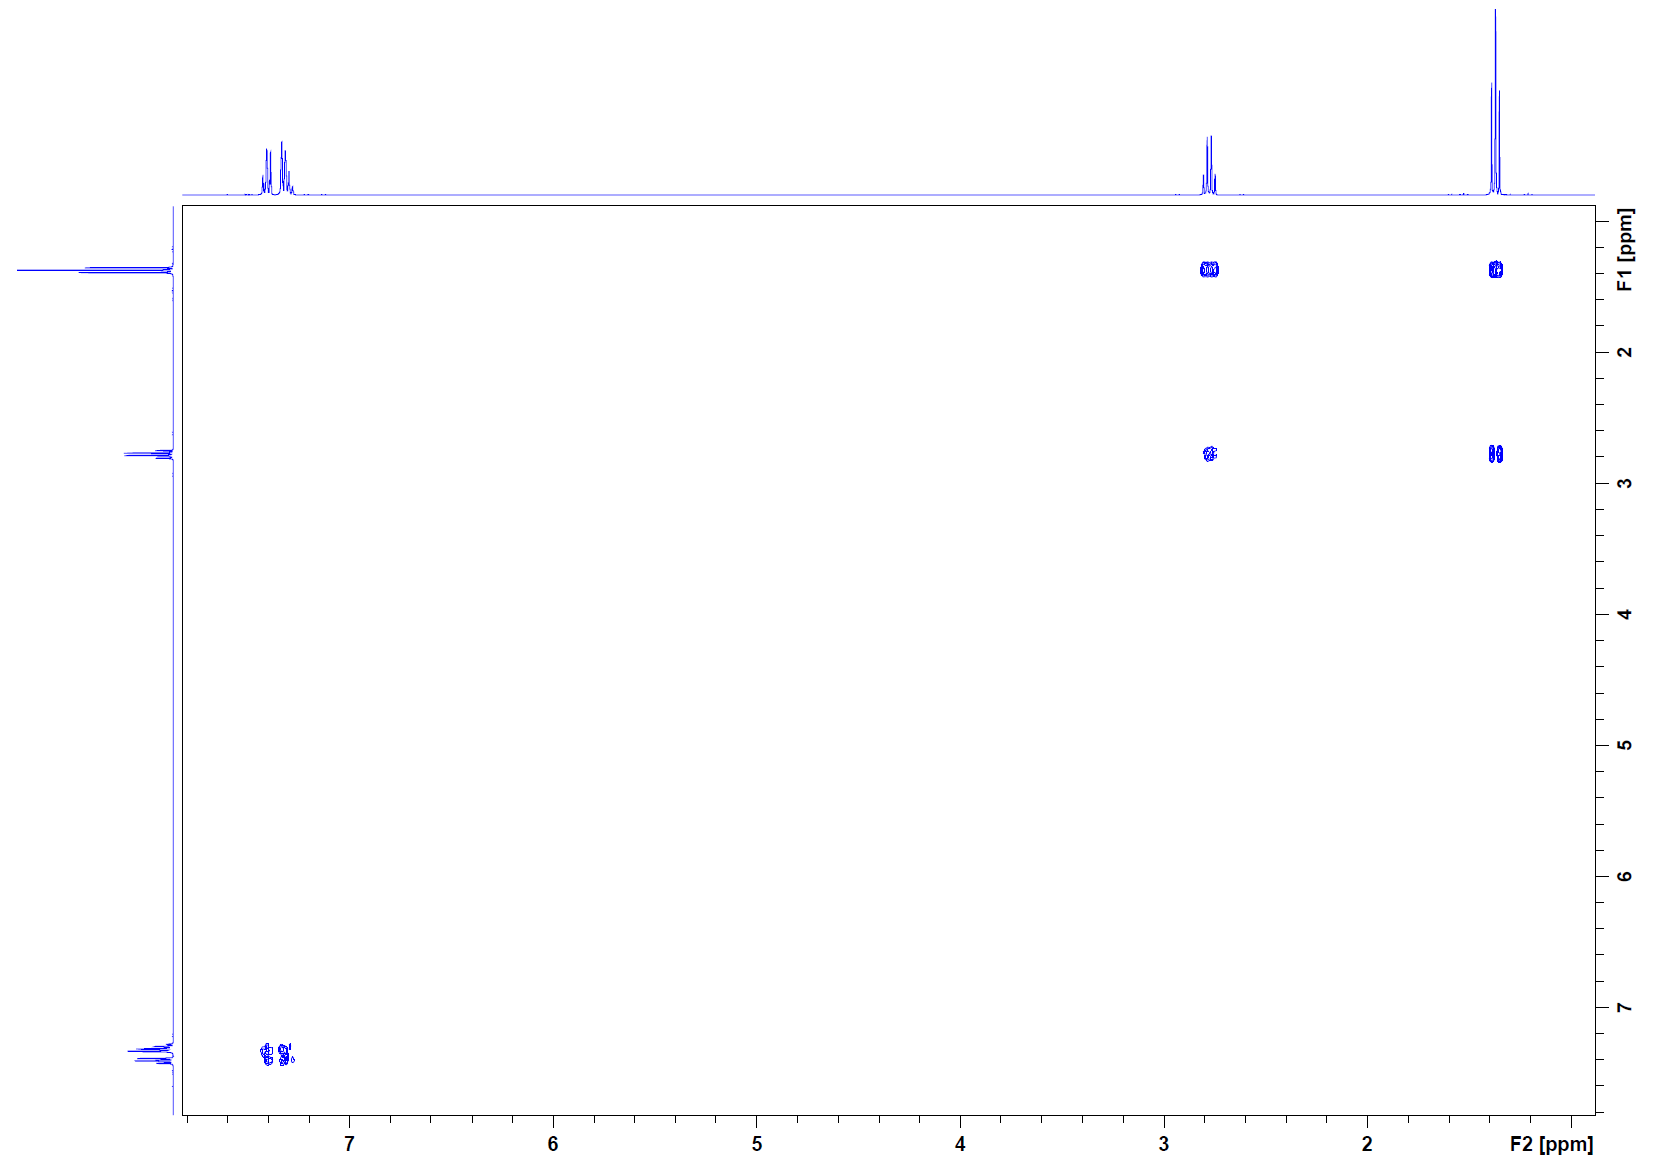
COSY:
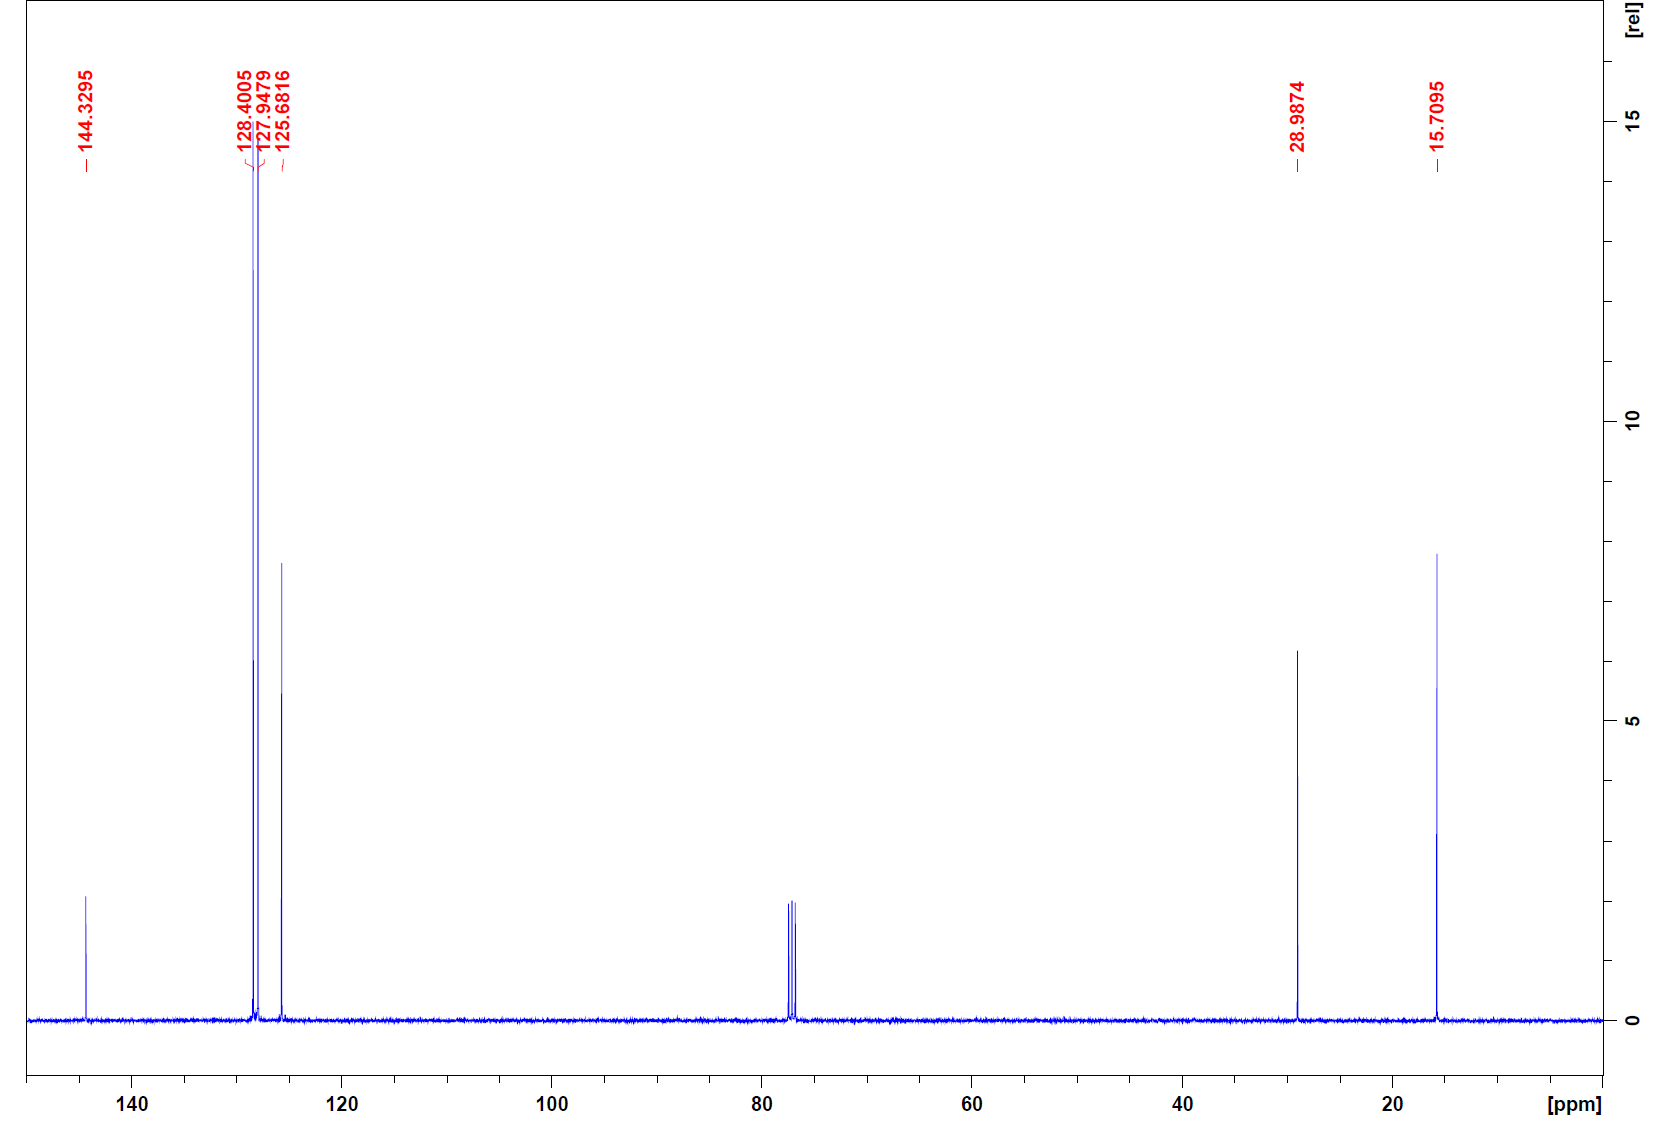
13C:
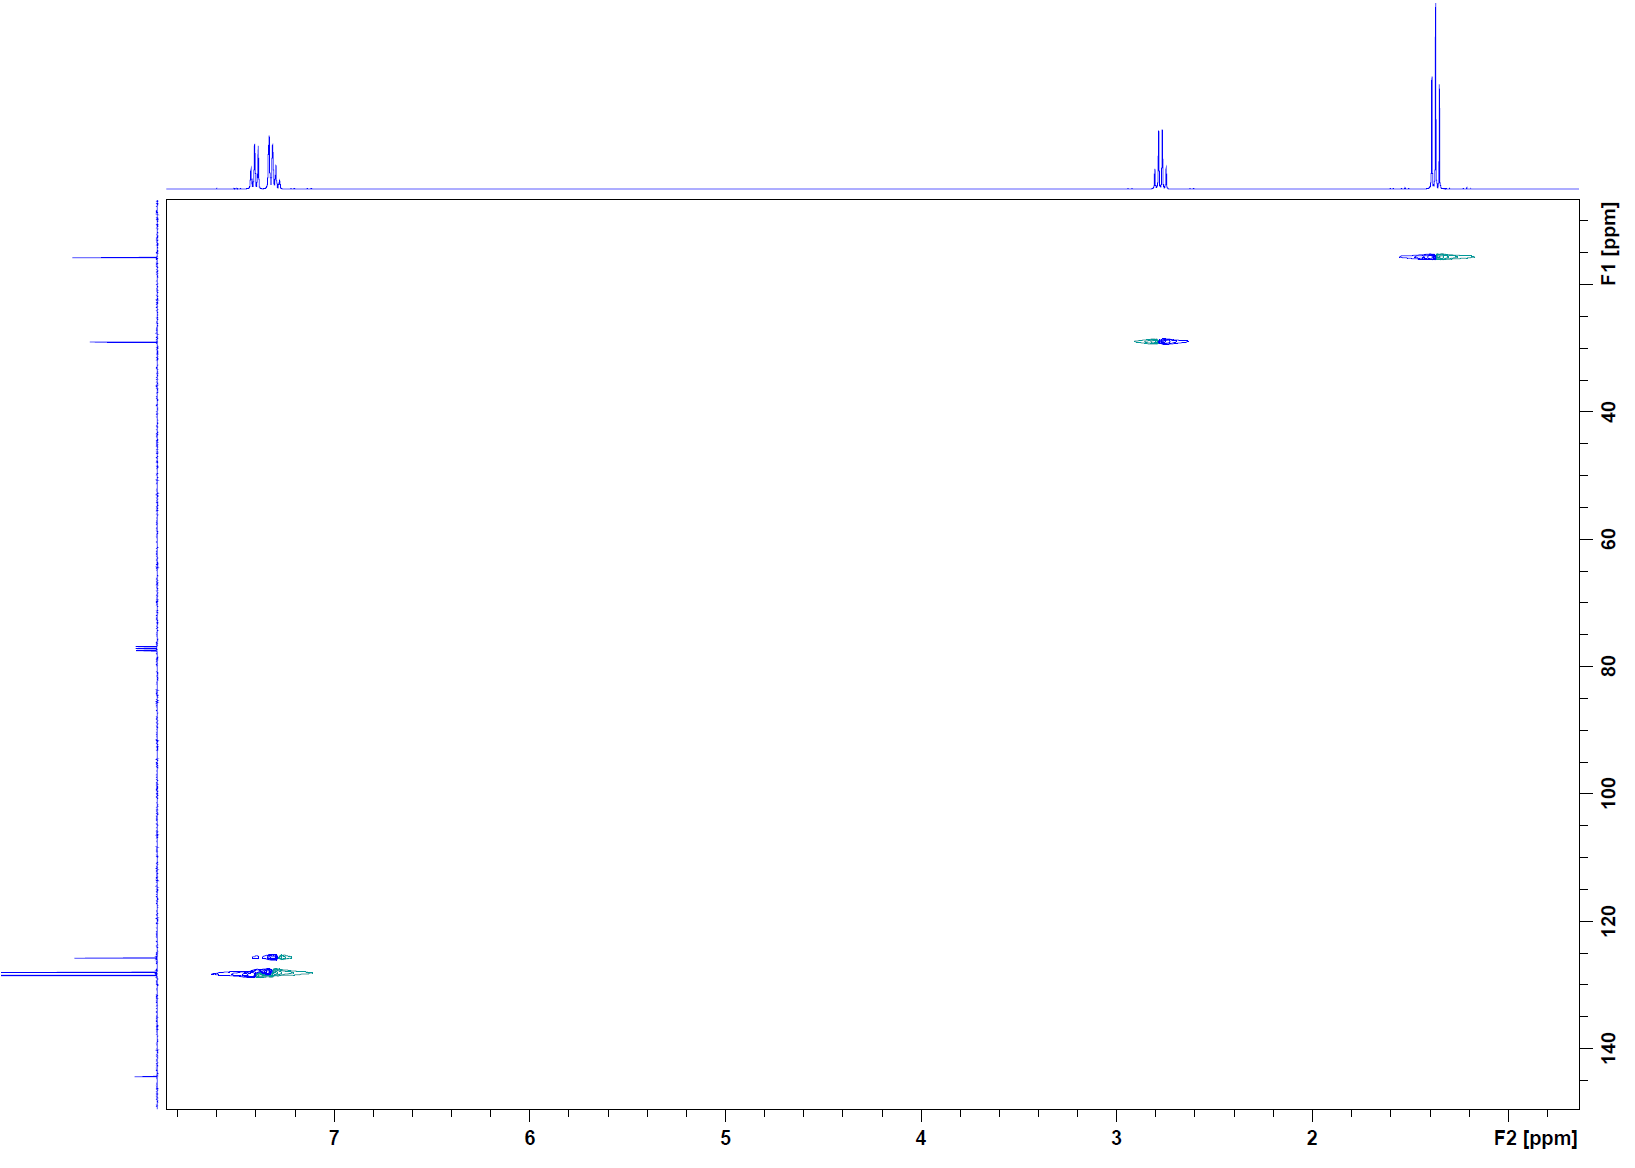
HSQC:
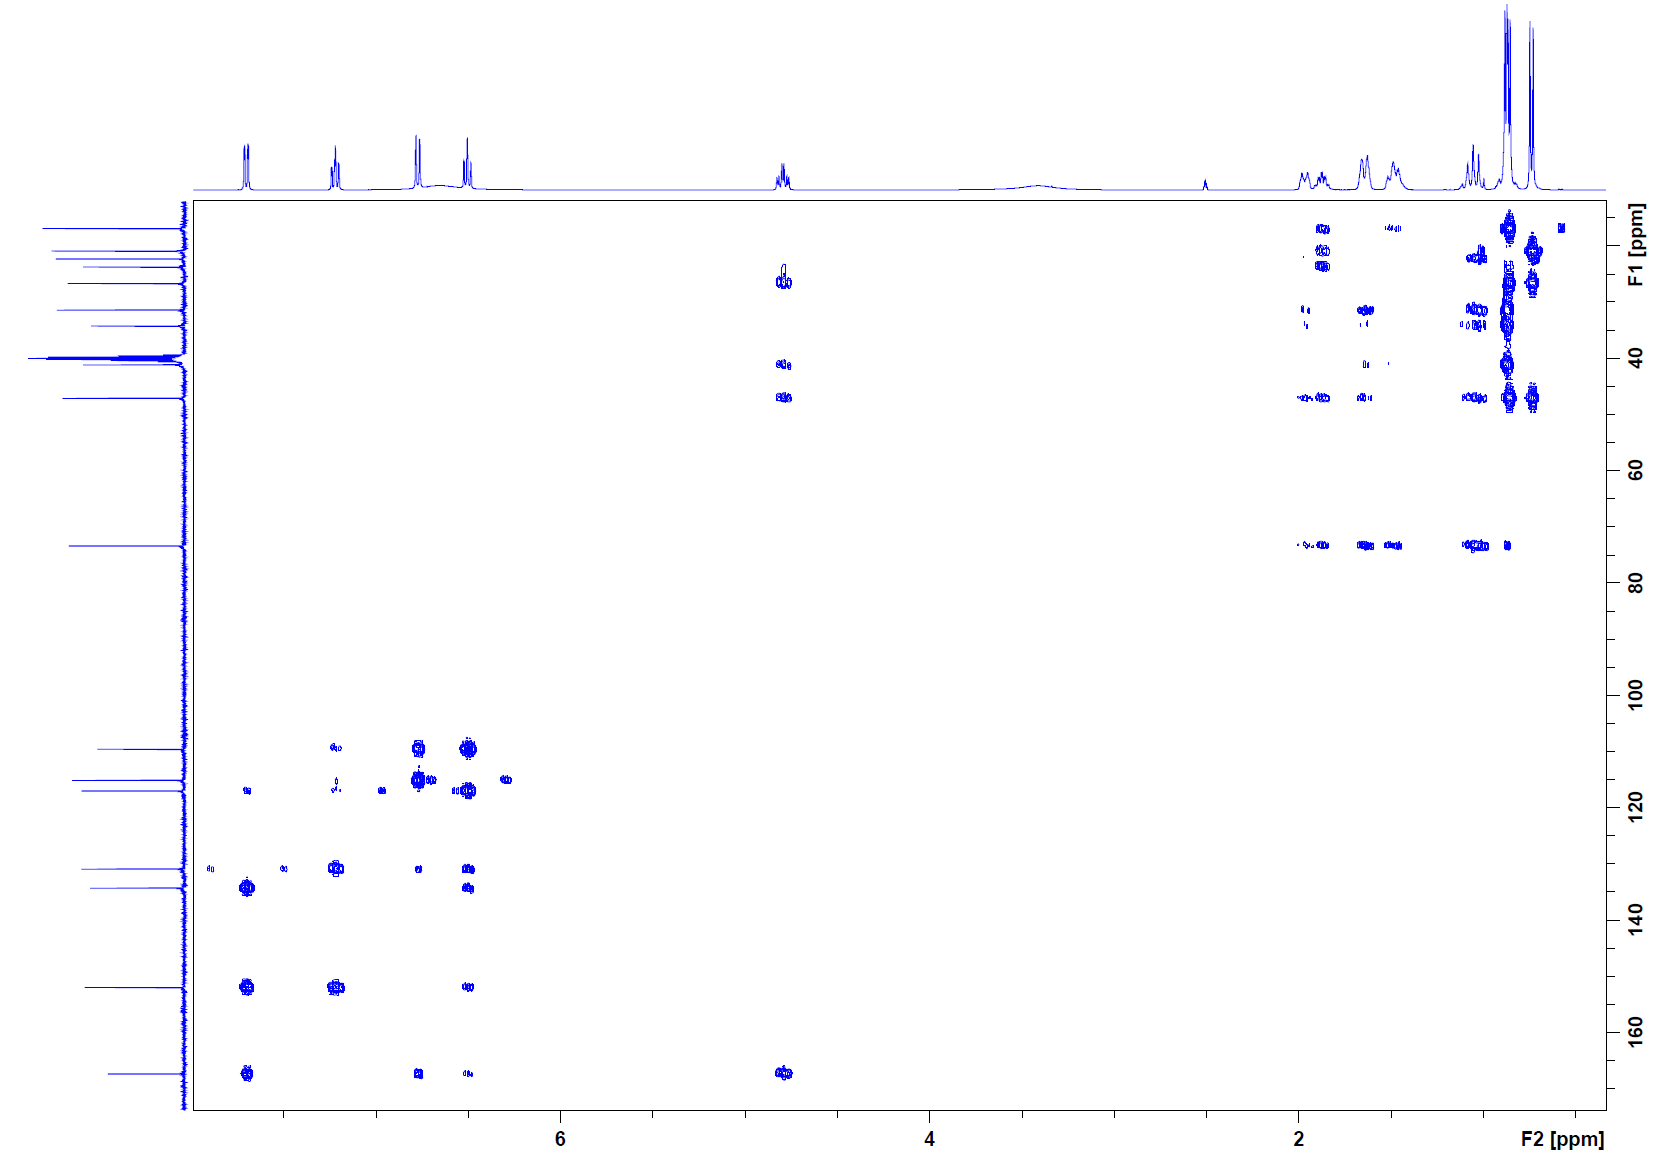
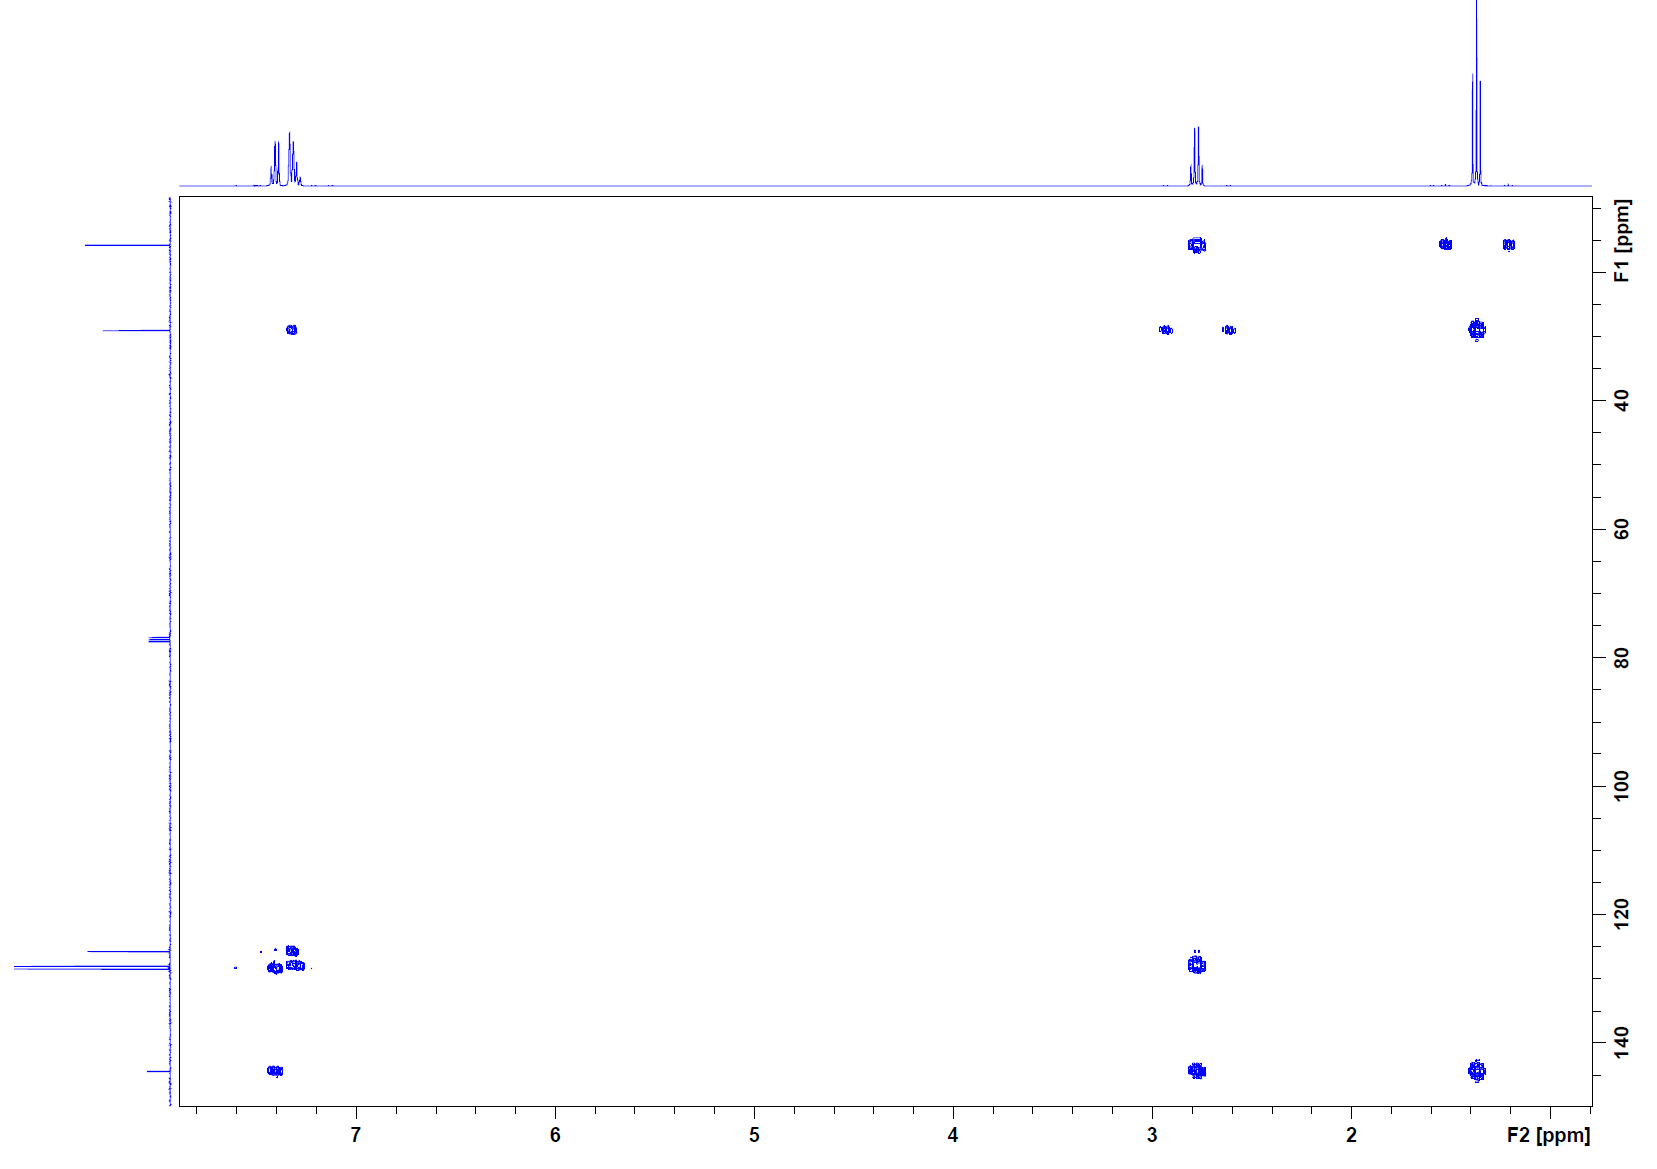
HMBC:
Solution
Degrees of unsaturation = 4.
1H NMR spectrum: At 1.2 ppm there is a triplet that integrates to 3H. This means the fragment must be -CH2-CH3. The peak at 2.67 ppm is a quartet that integrates to 2H, so this is also a -CH2-CH3. The multiplet at 7.2 ppm that integrates to 4.6 is in the aromatic region and with a degree of unsaturation of 4, these are most likely 5 aromatic protons.
COSY: The COSY corroborates with the fragment of a methylene coupling to a methyl group. This information was determined from the two cross peaks: (1.2, 2.67) and (2.67, 1.2). Coupling is reciprocal, so it makes sense that there is symmetry with the coupling. The aromatic region protons do not couple beyond that system itself.
13C: The 13C indicates that there are 6 different types of carbon nuclei. This means there must be some symmetry within the carbons since there should be a total of 8. The peak at 76 ppm is CDCl3.
HSQC: The first cross peak (1.2, 15) corresponds to the methyl group. The next cross peak (2.4, 29) corresponds to the methylene group. The final cross peaks (7.27, 125), (7.27, 128), and (7.27, 128.4) all correspond to the aromatic protons. These carbons are also in the double bond region. There is no cross peak for the carbon at 144 ppm, so this carbon must not have any hydrogens attached to it.
HMBC: Cross peak (1.2, 29) indicates that the methyl group is attached to the methylene group carbon. The cross peak at (2.4, 15) is the reciprocity of this correlation. The methyl hydrogens also have a cross peak at (1.2, 144), so the methylene must be attached to that carbon. When looking down the column for the methylene, there is a cross peak to corroborate this as well as a cross peak at (2.4, 128). This indicates that beyond its attachment to the quarternary carbon is the aromatic system. The cross peaks under the 7.2 ppm peak confirm this.
Final structure: 