4.3: Instrumentation
- Page ID
- 432180
\( \newcommand{\vecs}[1]{\overset { \scriptstyle \rightharpoonup} {\mathbf{#1}} } \)
\( \newcommand{\vecd}[1]{\overset{-\!-\!\rightharpoonup}{\vphantom{a}\smash {#1}}} \)
\( \newcommand{\dsum}{\displaystyle\sum\limits} \)
\( \newcommand{\dint}{\displaystyle\int\limits} \)
\( \newcommand{\dlim}{\displaystyle\lim\limits} \)
\( \newcommand{\id}{\mathrm{id}}\) \( \newcommand{\Span}{\mathrm{span}}\)
( \newcommand{\kernel}{\mathrm{null}\,}\) \( \newcommand{\range}{\mathrm{range}\,}\)
\( \newcommand{\RealPart}{\mathrm{Re}}\) \( \newcommand{\ImaginaryPart}{\mathrm{Im}}\)
\( \newcommand{\Argument}{\mathrm{Arg}}\) \( \newcommand{\norm}[1]{\| #1 \|}\)
\( \newcommand{\inner}[2]{\langle #1, #2 \rangle}\)
\( \newcommand{\Span}{\mathrm{span}}\)
\( \newcommand{\id}{\mathrm{id}}\)
\( \newcommand{\Span}{\mathrm{span}}\)
\( \newcommand{\kernel}{\mathrm{null}\,}\)
\( \newcommand{\range}{\mathrm{range}\,}\)
\( \newcommand{\RealPart}{\mathrm{Re}}\)
\( \newcommand{\ImaginaryPart}{\mathrm{Im}}\)
\( \newcommand{\Argument}{\mathrm{Arg}}\)
\( \newcommand{\norm}[1]{\| #1 \|}\)
\( \newcommand{\inner}[2]{\langle #1, #2 \rangle}\)
\( \newcommand{\Span}{\mathrm{span}}\) \( \newcommand{\AA}{\unicode[.8,0]{x212B}}\)
\( \newcommand{\vectorA}[1]{\vec{#1}} % arrow\)
\( \newcommand{\vectorAt}[1]{\vec{\text{#1}}} % arrow\)
\( \newcommand{\vectorB}[1]{\overset { \scriptstyle \rightharpoonup} {\mathbf{#1}} } \)
\( \newcommand{\vectorC}[1]{\textbf{#1}} \)
\( \newcommand{\vectorD}[1]{\overrightarrow{#1}} \)
\( \newcommand{\vectorDt}[1]{\overrightarrow{\text{#1}}} \)
\( \newcommand{\vectE}[1]{\overset{-\!-\!\rightharpoonup}{\vphantom{a}\smash{\mathbf {#1}}}} \)
\( \newcommand{\vecs}[1]{\overset { \scriptstyle \rightharpoonup} {\mathbf{#1}} } \)
\(\newcommand{\longvect}{\overrightarrow}\)
\( \newcommand{\vecd}[1]{\overset{-\!-\!\rightharpoonup}{\vphantom{a}\smash {#1}}} \)
\(\newcommand{\avec}{\mathbf a}\) \(\newcommand{\bvec}{\mathbf b}\) \(\newcommand{\cvec}{\mathbf c}\) \(\newcommand{\dvec}{\mathbf d}\) \(\newcommand{\dtil}{\widetilde{\mathbf d}}\) \(\newcommand{\evec}{\mathbf e}\) \(\newcommand{\fvec}{\mathbf f}\) \(\newcommand{\nvec}{\mathbf n}\) \(\newcommand{\pvec}{\mathbf p}\) \(\newcommand{\qvec}{\mathbf q}\) \(\newcommand{\svec}{\mathbf s}\) \(\newcommand{\tvec}{\mathbf t}\) \(\newcommand{\uvec}{\mathbf u}\) \(\newcommand{\vvec}{\mathbf v}\) \(\newcommand{\wvec}{\mathbf w}\) \(\newcommand{\xvec}{\mathbf x}\) \(\newcommand{\yvec}{\mathbf y}\) \(\newcommand{\zvec}{\mathbf z}\) \(\newcommand{\rvec}{\mathbf r}\) \(\newcommand{\mvec}{\mathbf m}\) \(\newcommand{\zerovec}{\mathbf 0}\) \(\newcommand{\onevec}{\mathbf 1}\) \(\newcommand{\real}{\mathbb R}\) \(\newcommand{\twovec}[2]{\left[\begin{array}{r}#1 \\ #2 \end{array}\right]}\) \(\newcommand{\ctwovec}[2]{\left[\begin{array}{c}#1 \\ #2 \end{array}\right]}\) \(\newcommand{\threevec}[3]{\left[\begin{array}{r}#1 \\ #2 \\ #3 \end{array}\right]}\) \(\newcommand{\cthreevec}[3]{\left[\begin{array}{c}#1 \\ #2 \\ #3 \end{array}\right]}\) \(\newcommand{\fourvec}[4]{\left[\begin{array}{r}#1 \\ #2 \\ #3 \\ #4 \end{array}\right]}\) \(\newcommand{\cfourvec}[4]{\left[\begin{array}{c}#1 \\ #2 \\ #3 \\ #4 \end{array}\right]}\) \(\newcommand{\fivevec}[5]{\left[\begin{array}{r}#1 \\ #2 \\ #3 \\ #4 \\ #5 \\ \end{array}\right]}\) \(\newcommand{\cfivevec}[5]{\left[\begin{array}{c}#1 \\ #2 \\ #3 \\ #4 \\ #5 \\ \end{array}\right]}\) \(\newcommand{\mattwo}[4]{\left[\begin{array}{rr}#1 \amp #2 \\ #3 \amp #4 \\ \end{array}\right]}\) \(\newcommand{\laspan}[1]{\text{Span}\{#1\}}\) \(\newcommand{\bcal}{\cal B}\) \(\newcommand{\ccal}{\cal C}\) \(\newcommand{\scal}{\cal S}\) \(\newcommand{\wcal}{\cal W}\) \(\newcommand{\ecal}{\cal E}\) \(\newcommand{\coords}[2]{\left\{#1\right\}_{#2}}\) \(\newcommand{\gray}[1]{\color{gray}{#1}}\) \(\newcommand{\lgray}[1]{\color{lightgray}{#1}}\) \(\newcommand{\rank}{\operatorname{rank}}\) \(\newcommand{\row}{\text{Row}}\) \(\newcommand{\col}{\text{Col}}\) \(\renewcommand{\row}{\text{Row}}\) \(\newcommand{\nul}{\text{Nul}}\) \(\newcommand{\var}{\text{Var}}\) \(\newcommand{\corr}{\text{corr}}\) \(\newcommand{\len}[1]{\left|#1\right|}\) \(\newcommand{\bbar}{\overline{\bvec}}\) \(\newcommand{\bhat}{\widehat{\bvec}}\) \(\newcommand{\bperp}{\bvec^\perp}\) \(\newcommand{\xhat}{\widehat{\xvec}}\) \(\newcommand{\vhat}{\widehat{\vvec}}\) \(\newcommand{\uhat}{\widehat{\uvec}}\) \(\newcommand{\what}{\widehat{\wvec}}\) \(\newcommand{\Sighat}{\widehat{\Sigma}}\) \(\newcommand{\lt}{<}\) \(\newcommand{\gt}{>}\) \(\newcommand{\amp}{&}\) \(\definecolor{fillinmathshade}{gray}{0.9}\)After completing this section, you should be able to:
- have basic understanding of how the IR spectrometer works
- understand the basic components of the IR spectrometer
There are two types of instruments used to measure IR absorption: Fourier transform (FT) spectrometers and dispersive spectrometers. FTIR spectrometers are the most commonly used instruments for obtaining IR spectra. FTIR spectrometers have several prominent advantages:
- The signal-to-noise ratio of spectrum is significantly higher than the previous generation infrared spectrometers.
- The accuracy of wavenumber is high. The error is within the range of ± 0.01 cm-1.
- The scan time of all frequencies is short (approximately 1 s).
- The resolution is extremely high (0.1 ~ 0.005 cm-1).
- The scan range is wide (1000 ~ 10 cm-1).
- The interference from stray light is reduced.
Due to these advantages, FTIR Spectrometers have replaced dispersive IR spectrometers.
The Infrared Spectrometer
Development of IR Spectrometers
Up till FTIR spectrometers, there have been three generations of IR spectrometers.
- The first generation IR spectrometer was invented in late 1950s. It utilizes prism optical splitting system. The prisms are made of NaCl. The requirement of the sample’s water content and particle size is extremely strict. Further more, the scan range is narrow. Additionally, the repeatability is fairly poor. As a result, the first generation IR spectrometer is no longer in use.
- The second generation IR spectrometer was introduced to the world in 1960s. It utilizes gratings as the monochrometer. The performance of the second generation IR spectrometer is much better compared with IR spectrometers with prism monochrometer, But there are still several prominent weaknesses such as low sensitivity, low scan speed and poor wavelength accuracy which rendered it out of date after the invention of the third generation IR spectrometer.
- The invention of the third generation IR spectrometer, Fourier transform infrared spectrometer, marked the abdication of monochrometer and the prosperity of interferometer. With this replacement, IR spectrometers became exceptionally powerful. Consequently, various applications of IR spectrometer have been realized.
Dispersive IR Spectrometers
To understand the powerfulness and usefulness of FTIR spectrometer, it is essential to have some background information of dispersive IR Spectrometer. The basic components of a dispersive IR spectrometer include a radiation source, monochromator, and detector. The common IR radiation sources are inert solids that are heated electrically to promote thermal emission of radiation in the infrared region of the electromagnetic spectrum. The monochromator is a device used to disperse or separate a broad spectrum of IR radiation into individual narrow IR frequencies.
Generally, dispersive spectrometers have a double-beam design with two equivalent beams from the same source passing through the sample and reference chambers as independent beams. These reference and sample beams are alternately focused on the detector by making use of an optical chopper, such as, a sector mirror. One beam will proceed, traveling through the sample, while the other beam will pass through a reference species for analytical comparison of transmitted photon wavefront information.
After the incident radiation travels through the sample species, the emitted wavefront of radiation is dispersed by a monochromator (gratings and slits) into its component frequencies. A combination of prisms or gratings with variable-slit mechanisms, mirrors, and filters comprise the dispersive system. Narrower slits gives better resolution by distinguishing more closely spaced frequencies of radiation and wider slits allow more light to reach the detector and provide better system sensitivity. The emitted wavefront beam (analog spectral output) hits the detector and generates an electrical signal as a response.
Detectors are devices that convert the analog spectral output into an electrical signal. These electrical signals are further processed by the computer using mathematical algorithm to arrive at the final spectrum. The detectors used in IR spectrometers can be classified as either photon/quantum detectors or thermal detectors.
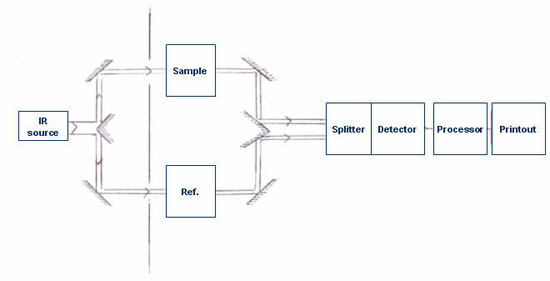
It is the absorption of IR radiation by the sample, producing a change of IR radiation intensity, which gets detected as an off-null signal (e.g. different from reference signal). This change is translated into the recorder response through the actions of synchronous motors. Each frequency that passes through the sample is measured individually by the detector which consequently slows the process of scanning the entire IR region. A block diagram of a classic dispersive IR spectrometer is shown in Figure 4.3.1.
FTIR Spectrometers
The Components of FTIR Spectrometers
A common FTIR spectrometer consists of a source, interferometer, sample compartment, detector, amplifier, A/D convertor, and a computer. The source generates radiation which passes the sample through the interferometer and reaches the detector. Then the signal is amplified and converted to digital signal by the amplifier and analog-to-digital converter, respectively. Eventually, the signal is transferred to a computer in which Fourier transform is carried out. Figure 4.3.2 is a block diagram of an FTIR spectrometer.
The major difference between an FTIR spectrometer and a dispersive IR spectrometer is the Michelson interferometer.
Michelson Interferometer
The Michelson interferometer, which is the core of FTIR spectrometers, is used to split one beam of light into two so that the paths of the two beams are different. Then the Michelson interferometer recombines the two beams and conducts them into the detector where the difference of the intensity of these two beams are measured as a function of the difference of the paths. Figure 4.3.3 is a schematic of the Michelson Interferometer.
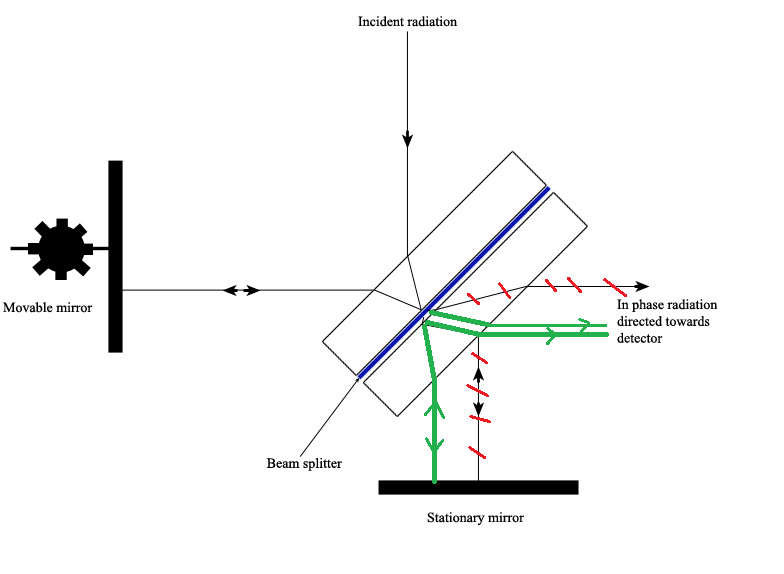
A typical Michelson interferometer consists of two perpendicular mirrors and a beamsplitter. One of the mirror is a stationary mirror and another one is a movable mirror. The beamsplitter is designed to transmit half of the light and reflect half of the light. Subsequently, the transmitted light and the reflected light strike the stationary mirror and the movable mirror, respectively. When reflected back by the mirrors, two beams of light recombine with each other at the beamsplitter.
If the distances travelled by two beams are the same which means the distances between two mirrors and the beamsplitter are the same, the situation is defined as zero path difference (ZPD). But imagine if the movable mirror moves away from the beamsplitter, the light beam which strikes the movable mirror will travel a longer distance than the light beam which strikes the stationary mirror. The distance which the movable mirror is away from the ZPD is defined as the mirror displacement and is represented by ∆. It is obvious that the extra distance travelled by the light which strikes the movable mirror is 2∆. The extra distance is defined as the optical path difference (OPD) and is represented by delta. Therefore,
δ=2Δ(4.3.1.1)(4.3.1.1)δ=2Δ
It is well established that when OPD is the multiples of the wavelength, constructive interference occurs because crests overlap with crests, troughs with troughs. As a result, a maximum intensity signal is observed by the detector. This situation can be described by the following equation:
δ=nλ(4.3.1.2)(4.3.1.2)δ=nλ
with n = 0,1,2,3...
In contrast, when OPD is the half wavelength or half wavelength add multiples of wavelength, destructive interference occurs because crests overlap with troughs. Consequently, a minimum intensity signal is observed by the detector. This situation can be described by the following equation:
δ=(n+12)λ(4.3.1.3)(4.3.1.3)δ=(n+12)λ
with n = 0,1,2,3...
These two situations are two extreme situations. If the OPD is neither n-fold wavelengths nor (n+1/2)-fold wavelengths, the interference should be between constructive and destructive. So the intensity of the signal should be between maximum and minimum. Since the mirror moves back and forth, the intensity of the signal increases and decreases which gives rise to a cosine wave. The plot is defined as an interferogram. When detecting the radiation of a broad band source rather than a single-wavelength source, a peak at ZPD is found in the interferogram. At the other distance scanned, the signal decays quickly since the mirror moves back and forth. Figure 4.3.1.44.3.1.4(a) shows an interferogram of a broad band source.
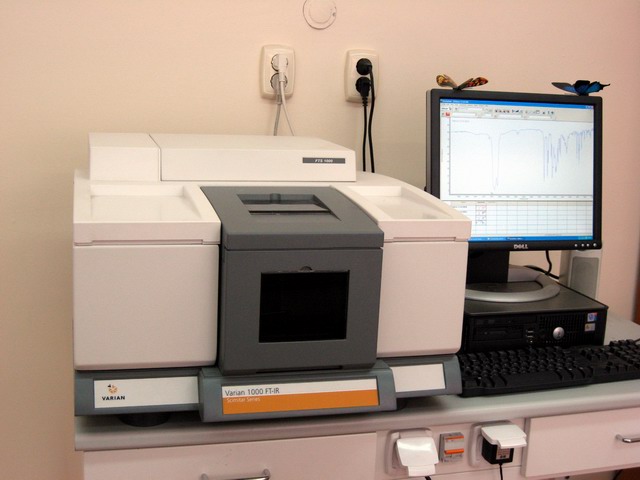
In an infrared spectrometer (Figure \(\PageIndex{4}\) ) the sample to be analyzed is held in front of an infrared laser beam, in order to do this, the sample must be contained in something, consequently this means that the very container the sample is in will absorb some of the infrared beam.
IR Sample Preparation
IR spectra can be obtained from solid, liquid, or gas samples. Nujol mulls and pressed pellets are typically used for collecting spectra of solids, while thin-film cells are used for solution-phase IR spectroscopy. In these methods, infrared radiation is passed through the pellet or thin-film cells. A newer method for obtaining IR spectra uses attenuated total reflectance (ATR), which is discussed below. Gas samples require a special cell for sampling, but are not often used in organic chemistry, so will not be discussed further here.
When preparing a liquid, a drop of neat sample is pressed between two disks. A thin film of solid can be prepared by placing a drop of concentrated solution of the compound in the center of a disk and then allowing the solvent to evaporate. Since all materials have some sort of vibration associated with them pellets and thin-film cells must be considered carefully. If the sample holder has an optical window made of something that absorbs near where your sample does, the sample might not be distinguishable from the optical window of the sample holder. The range that is not blocked by a strong absorbance is known as a window (not to be confused with the optical materials of the cell). Windows are an important factor to consider when choosing the method to perform an analysis, as seen in Table \(\PageIndex{1}\) there are a number of different materials each with their own characteristic absorption spectra and chemical properties. Keep these factors in mind when performing analyses and precious sample will be saved. For most organic compounds NaCl works well though it is susceptible to attack from moisture.
| Material | Transparent Ranges (cm -1) | Solubility | Notes |
|---|---|---|---|
| NaCl | 40,000 - 625 | H2O | Easy to polish, hygroscopic |
| Silica glass | 55,000-3,000 | HF | Attacked by HF |
| Quartz | 40,000-2,500 | HF | Attacked by HF |
| Sapphire | 20,000-1,780 | - | Strong |
| Diamond | 40,000-2,500 and 1,800-200 | - | Very strong, expensive, hard, useless for pellets |
| CaF2 | 70,000-1,110 | Acids | Attacked by acids, avoid ammonium salts |
| BaF2 | 65,000-700 | - | Avoid ammonium salts |
| ZnSe | 10,000 - 550 | Acids | Brittle, attacked by acids |
| AgCl | 25,000-400 | - | Soft, sensitive to light. |
| KCl | 40,000-500 | H2O, Et2O, acetone | Hygroscopic, soft, easily polished, commonly used in making pellets. |
| KBr | 40,000-400 | H2O, EtOH | Hygroscopic, soft, easily polished, commonly used in making pellets. |
| CsBr | 10,000-250 | H2O, EtOH, acetone | Hygroscopic soft |
| CsI | 10,000-200 | H2O, EtOH, MeOH, acetone | Hygroscopic, soft. |
| Teflon | 5,000-1,200; 1,200-900 | - | Inert, disposable |
| Polyethylene | 4,000-3,000; 2,800-1,460; 1,380 - 730; 720- 30 | - | Inert, disposable |
A common method of preparing solid samples for IR analysis is mulling, which is not a true solution, but a fine dispersion of a solid compound in a viscous liquid. The principle here is by grinding the particles to below the wavelength of incident radiation that will be passing through there should be limited scattering. To suspend those tiny particles, an oil, often referred to as Nujol is used. IR-transparent salt plates are used to hold the sample in front of the beam in order to acquire data. To prepare a sample for IR analysis using a salt plate, first decide what segment of the frequency band should be studied, refer to Table \(\PageIndex{1}\) for the materials best suited for the sample.
Attenuated Total Reflectance- Fourier Transform Infrared Spectroscopy
First publicly proposed in 1959 by Jacques Fahrenfort from the Royal Dutch Shell laboratories in Amsterdam, ATR IR spectroscopy was described as a technique to effectively measure weakly absorbing condensed phase materials. In Fahrenfort's first article describing the technique, published in 1961, he used a hemicylindrical ATR crystal (see Experimental Conditions) to produce single-reflection ATR (Figure \(\PageIndex{5}\) ). ATR IR spectroscopy was slow to become accepted as a method of characterization due to concerns about its quantitative effectiveness and reproducibility. The main concern being the sample and ATR crystal contact necessary to achieve decent spectral contrast. In the late 1980’s FTIR spectrometers began improving due to an increased dynamic range, signal to noise ratio, and faster computers. As a result ATR-FTIR also started gaining traction as an efficient spectroscopic technique. These days ATR accessories are often manufactured to work in conjunction with most FTIR spectrometers.
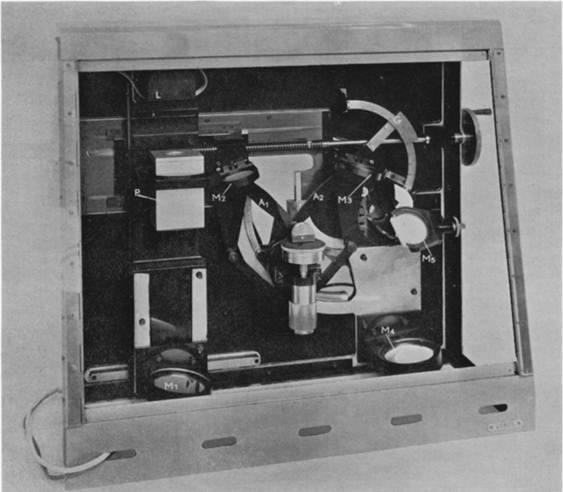
ATR-FTIR is a physical method of compositional analysis that builds upon traditional transmission FTIR spectroscopy to minimize sample preparation and optimize reproducibility. Sample accessories make obtaining IR spectra of solids and liquids easier and it is not necessary to prepare Nujol mulls or disks. With ATR, infrared radiation is passed through an infrared transmitting crystal with a high refractive index. This allows the radiation to reflect within the crystal. This should be a material that is fully transparent to the incident infrared radiation to give a real value for the refractive index, \(\PageIndex{6}\).

We can consider the sample to be absorbing in the infrared. Electromagnetic energy will pass through the crystal/sample interface and propagate into the sample via the evanescent wave. This energy loss must be compensated with the incident IR light. Thus, total reflectance is no longer occurring and the reflection inside the crystal is attenuated. If a sample does not absorb, the reflectance at the interface shows no attenuation. Therefore if the IR light at a particular frequency does not reach the detector, the sample must have absorbed it.
The penetration depth of the evanescent wave within the sample is on the order of 1µm. The expression of the penetration depth is given in \ref{8} and is dependent upon the wavelength and angle of incident light as well as the refractive indices of the ATR crystal and sample. The effective path length is the product of the depth of penetration of the evanescent wave and the number of points that the IR light reflects at the interface between the crystal and sample. This path length is equivalent to the path length of a sample in a traditional transmission FTIR setup.
\[ d_{p} = \frac{ \lambda }{2 \pi n_{1}} (sin \omega - ( \frac{n_{1}}{n_{2}} )^{2} )^{1/2} \label{8} \]
Refractive Indices of ATR Crystal and Sample
Typically an ATR attachment can be used with a traditional FTIR where the beam of incident IR light enters a horizontally positioned crystal with a high refractive index in the range of 1.5 to 4, as can be seen in Table \(\PageIndex{2}\) will consist of organic compounds, inorganic compounds, and polymers which have refractive indices below 2 and can readily be found on a database. The most commonly used crystal is zinc selenide.
| Material | Refractive Index (RI) | Spectral Range (cm-1) |
|---|---|---|
| Zinc Selenide (ZnSe) | 2.4 | 20,000 - 650 |
| Germanium (Ge) | 4 | 5,500 - 870 |
| Sapphire (Al2O3) | 1.74 | 50,000 - 2,000 |
| Diamond (C) | 2.4 | 45,000 - 2,500, 1650 - 200 |
Single and Multiple Reflection Crystals
Multiple reflection ATR was initially more popular than single reflection ATR because of the weak absorbances associated with single reflection ATR. More reflections increased the evanescent wave interaction with the sample, which was believed to increase the signal to noise ratio of the spectrum. When IR spectrometers developed better spectral contrast, single reflection ATR became more popular. The number of reflections and spectral contrast increases with the length of the crystal and decreases with the angle of incidence as well as thickness. Within multiple reflection crystals some of the light is transmitted and some is reflected as the light exits the crystal, resulting in some of the light going back through the crystal for a round trip. Therefore, light exiting the ATR crystal contains components that experienced different number of reflections at the crystal-sample interface.
Angle of Incidence
It was more common in earlier instruments to allow selection of the incident angle. In all cases for total internal reflection to hold, the angle of incidence must exceed the critical angle and ideally complement the angle of the crystal edge so that the light enters at a normal angle of incidence. These days 45° is the standard angle on most ATR-FTIR setups.
ATR Crystal Shape
For the most part ATR crystals will have a trapezoidal shape as shown in Figure \(\PageIndex{6}\). This shape facilitates sample preparation and handling on the crystal surface by enabling the optical setup to be placed below the crystal. However, different crystal shapes (Figure \(\PageIndex{7}\) ) may be used for particular purposes, whether it is to achieve multiple reflections or reduce the spot size. For example, a hemispherical crystal may be used in a microsampling experiment in which the beam diameter can be reduced at no expense to the light intensity. This allows appropriate measurement of a small sample without compromising the quality of the resulting spectral features.
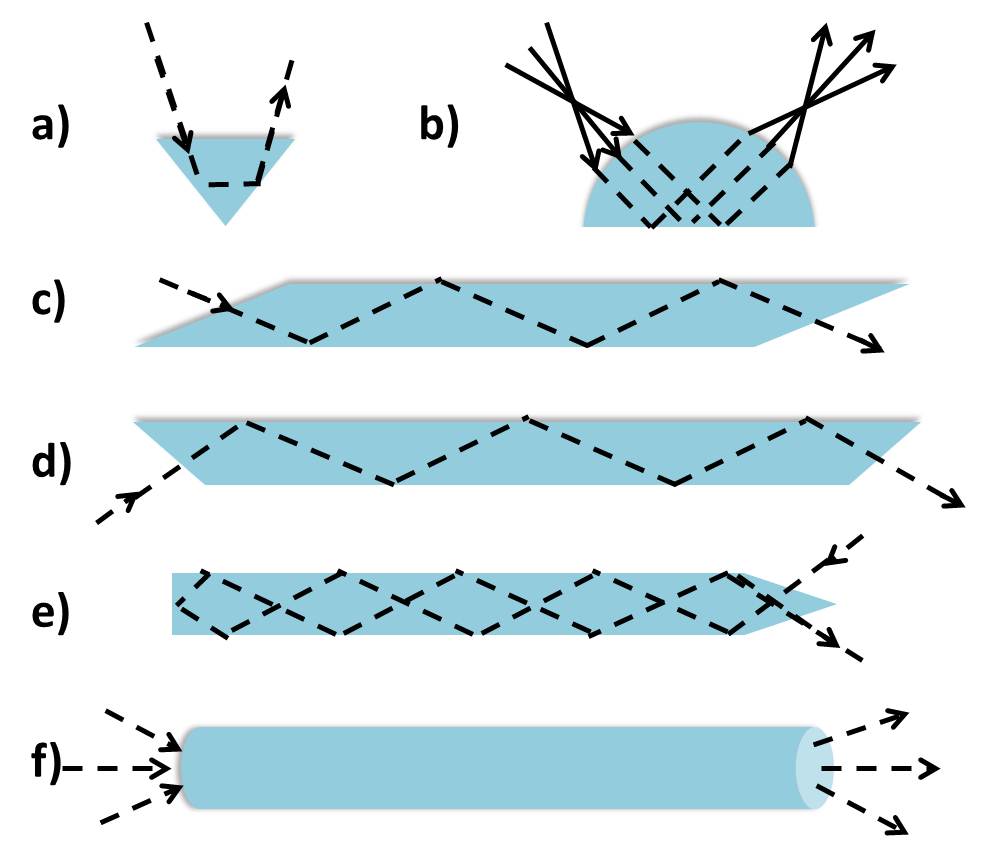
Because the path length of the evanescent wave is confined to the interface between the ATR crystal and sample, the sample should make firm contact with the ATR crystal. The sample sits atop the crystal and intimate contact can be ensured by applying pressure above the sample. However, one must be mindful of the ATR crystal hardness. Too much pressure may distort the crystal and affect the reproducibility of the resulting spectrum.
Why did FTIR spectrometers become the standard over dispersive spectrometers?
- Answer
-
The advantages of FTIR are:
- The signal-to-noise ratio of spectrum is significantly higher than the previous generation infrared spectrometers.
- The accuracy of wavenumber is high.
- The error is within the range of ± 0.01 cm-1.
- The scan time of all frequencies is short (approximately 1 s).
- The resolution is extremely high (0.1 ~ 0.005 cm-1).
- The scan range is wide (1000 ~ 10 cm-1).
- The interference from stray light is reduced.
Essentially, FTIR spectrometers produce more reliable data in a better and faster way.
In transmission IR samples, how are solids prepared?
- Answer
-
Nujol mulls and pressed pellets are typically used for collecting spectra of solids.
What is the standard angle of incidence for an ATR-FTIR spectrometer?
- Answer
-
These days 45° is the standard angle on most ATR-FTIR setups.


