
3.4: Ultraviolet Absorption
- Page ID
- 432172
\( \newcommand{\vecs}[1]{\overset { \scriptstyle \rightharpoonup} {\mathbf{#1}} } \)
\( \newcommand{\vecd}[1]{\overset{-\!-\!\rightharpoonup}{\vphantom{a}\smash {#1}}} \)
\( \newcommand{\id}{\mathrm{id}}\) \( \newcommand{\Span}{\mathrm{span}}\)
( \newcommand{\kernel}{\mathrm{null}\,}\) \( \newcommand{\range}{\mathrm{range}\,}\)
\( \newcommand{\RealPart}{\mathrm{Re}}\) \( \newcommand{\ImaginaryPart}{\mathrm{Im}}\)
\( \newcommand{\Argument}{\mathrm{Arg}}\) \( \newcommand{\norm}[1]{\| #1 \|}\)
\( \newcommand{\inner}[2]{\langle #1, #2 \rangle}\)
\( \newcommand{\Span}{\mathrm{span}}\)
\( \newcommand{\id}{\mathrm{id}}\)
\( \newcommand{\Span}{\mathrm{span}}\)
\( \newcommand{\kernel}{\mathrm{null}\,}\)
\( \newcommand{\range}{\mathrm{range}\,}\)
\( \newcommand{\RealPart}{\mathrm{Re}}\)
\( \newcommand{\ImaginaryPart}{\mathrm{Im}}\)
\( \newcommand{\Argument}{\mathrm{Arg}}\)
\( \newcommand{\norm}[1]{\| #1 \|}\)
\( \newcommand{\inner}[2]{\langle #1, #2 \rangle}\)
\( \newcommand{\Span}{\mathrm{span}}\) \( \newcommand{\AA}{\unicode[.8,0]{x212B}}\)
\( \newcommand{\vectorA}[1]{\vec{#1}} % arrow\)
\( \newcommand{\vectorAt}[1]{\vec{\text{#1}}} % arrow\)
\( \newcommand{\vectorB}[1]{\overset { \scriptstyle \rightharpoonup} {\mathbf{#1}} } \)
\( \newcommand{\vectorC}[1]{\textbf{#1}} \)
\( \newcommand{\vectorD}[1]{\overrightarrow{#1}} \)
\( \newcommand{\vectorDt}[1]{\overrightarrow{\text{#1}}} \)
\( \newcommand{\vectE}[1]{\overset{-\!-\!\rightharpoonup}{\vphantom{a}\smash{\mathbf {#1}}}} \)
\( \newcommand{\vecs}[1]{\overset { \scriptstyle \rightharpoonup} {\mathbf{#1}} } \)
\( \newcommand{\vecd}[1]{\overset{-\!-\!\rightharpoonup}{\vphantom{a}\smash {#1}}} \)
Objectives
- identify the ultraviolet region of the electromagnetic spectrum which is of most use to organic chemists.
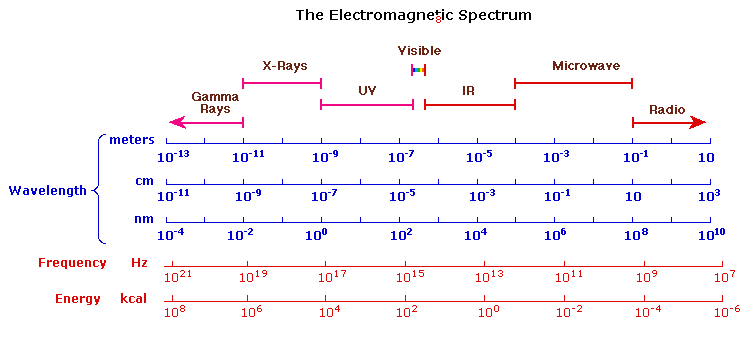
The electromagnetic spectrum was discussed in Chapter 1, but as a reminder most of the radiation that surrounds us is not visible. However, this radiation can be detected by instruments. The following chart displays many of the important regions of the electromagnetic spectrum, and demonstrates the inverse relationship between wavelength and frequency.
UV-Visible Absorption Spectra
To understand why some compounds are colored and others are not, and to determine the relationship of conjugation to color, we must make accurate measurements of light absorption at different wavelengths in and near the visible part of the spectrum. Commercial optical spectrometers enable such experiments to be conducted with ease, and usually survey both the near ultraviolet and visible portions of the spectrum. The visible region of the spectrum comprises photon energies of 36 to 72 kcal/mol, and the near ultraviolet region, out to 200 nm, extends this energy range to 143 kcal/mol. Ultraviolet radiation having wavelengths less than 200 nm is difficult to handle, and is seldom used as a routine tool for structural analysis.
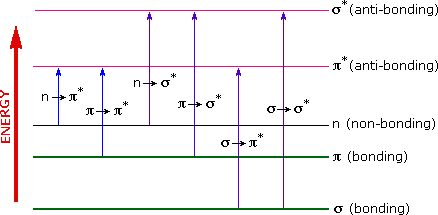
The energies noted above are sufficient to promote or excite a molecular electron to a higher energy orbital. Consequently, absorption spectroscopy carried out in this region is sometimes called "electronic spectroscopy". In Section 3.3, the electronic transitions were discussed, but a summary of the various kinds of electronic excitation that may occur in organic molecules is shown in the diagram below. Of the six transitions outlined, only the non-bonding to anti-bonding and bonding to anti-bonding are achieved by the energies available in the 200 to 800 nm spectrum. As a rule, energetically favored electron promotion will be from the highest occupied molecular orbital (HOMO) to the lowest unoccupied molecular orbital (LUMO), and the resulting species is called an excited state.
When sample molecules are exposed to light having an energy that matches a possible electronic transition within the molecule, some of the light energy will be absorbed as the electron is promoted to a higher energy orbital. An optical spectrometer records the wavelengths at which absorption occurs, together with the degree of absorption at each wavelength. The resulting spectrum is presented as a graph of absorbance (A) versus wavelength, as in the spectrum shown below of beta-carotene as well as the structure. Beta-carotene absorbs most strongly from 400 to 500 nm. This is the blue/green part of the spectrum and beta-carotene appears orange because it reflects back red/yellow. Absorbance usually ranges from 0 (no absorption) to 2 (99% absorption), and is precisely defined in context with spectrometer operation.


Spectrum from: https://scilearn.sydney.edu.au/organ...The%20Spectrum
What is the energy range for 400 nm to 500 nm in the ultraviolet spectrum where beta-carotene absorbs?
- Answer
-
E = hc/λ
E = (6.62 × 10⁻³⁴ Js)(3.00 × 10⁸ m/s)/(4.00 × 10−7 m)
E = 6.62 × 10⁻¹⁹ J
The range of 3.972 × 10⁻¹⁹ to 4.965 × 10⁻¹⁹ joules.
Would 1,3-cyclohexadiene or 1,4-cyclohexadiene absorb a longer wavelength?

- Answer
-
1,3-cyclohexadiene would absorb a longer wavelength. Typically, the more conjugation in the molecule, the longer the wavelength absorbed.
Contributors and Attributions
Dr. Dietmar Kennepohl FCIC (Professor of Chemistry, Athabasca University)
Prof. Steven Farmer (Sonoma State University)
Organic Chemistry With a Biological Emphasis by Tim Soderberg (University of Minnesota, Morris)