
4.9: Modulus, Temperature, Time
- Page ID
- 191194

\( \newcommand{\vecs}[1]{\overset { \scriptstyle \rightharpoonup} {\mathbf{#1}} } \)
\( \newcommand{\vecd}[1]{\overset{-\!-\!\rightharpoonup}{\vphantom{a}\smash {#1}}} \)
\( \newcommand{\dsum}{\displaystyle\sum\limits} \)
\( \newcommand{\dint}{\displaystyle\int\limits} \)
\( \newcommand{\dlim}{\displaystyle\lim\limits} \)
\( \newcommand{\id}{\mathrm{id}}\) \( \newcommand{\Span}{\mathrm{span}}\)
( \newcommand{\kernel}{\mathrm{null}\,}\) \( \newcommand{\range}{\mathrm{range}\,}\)
\( \newcommand{\RealPart}{\mathrm{Re}}\) \( \newcommand{\ImaginaryPart}{\mathrm{Im}}\)
\( \newcommand{\Argument}{\mathrm{Arg}}\) \( \newcommand{\norm}[1]{\| #1 \|}\)
\( \newcommand{\inner}[2]{\langle #1, #2 \rangle}\)
\( \newcommand{\Span}{\mathrm{span}}\)
\( \newcommand{\id}{\mathrm{id}}\)
\( \newcommand{\Span}{\mathrm{span}}\)
\( \newcommand{\kernel}{\mathrm{null}\,}\)
\( \newcommand{\range}{\mathrm{range}\,}\)
\( \newcommand{\RealPart}{\mathrm{Re}}\)
\( \newcommand{\ImaginaryPart}{\mathrm{Im}}\)
\( \newcommand{\Argument}{\mathrm{Arg}}\)
\( \newcommand{\norm}[1]{\| #1 \|}\)
\( \newcommand{\inner}[2]{\langle #1, #2 \rangle}\)
\( \newcommand{\Span}{\mathrm{span}}\) \( \newcommand{\AA}{\unicode[.8,0]{x212B}}\)
\( \newcommand{\vectorA}[1]{\vec{#1}} % arrow\)
\( \newcommand{\vectorAt}[1]{\vec{\text{#1}}} % arrow\)
\( \newcommand{\vectorB}[1]{\overset { \scriptstyle \rightharpoonup} {\mathbf{#1}} } \)
\( \newcommand{\vectorC}[1]{\textbf{#1}} \)
\( \newcommand{\vectorD}[1]{\overrightarrow{#1}} \)
\( \newcommand{\vectorDt}[1]{\overrightarrow{\text{#1}}} \)
\( \newcommand{\vectE}[1]{\overset{-\!-\!\rightharpoonup}{\vphantom{a}\smash{\mathbf {#1}}}} \)
\( \newcommand{\vecs}[1]{\overset { \scriptstyle \rightharpoonup} {\mathbf{#1}} } \)
\(\newcommand{\longvect}{\overrightarrow}\)
\( \newcommand{\vecd}[1]{\overset{-\!-\!\rightharpoonup}{\vphantom{a}\smash {#1}}} \)
\(\newcommand{\avec}{\mathbf a}\) \(\newcommand{\bvec}{\mathbf b}\) \(\newcommand{\cvec}{\mathbf c}\) \(\newcommand{\dvec}{\mathbf d}\) \(\newcommand{\dtil}{\widetilde{\mathbf d}}\) \(\newcommand{\evec}{\mathbf e}\) \(\newcommand{\fvec}{\mathbf f}\) \(\newcommand{\nvec}{\mathbf n}\) \(\newcommand{\pvec}{\mathbf p}\) \(\newcommand{\qvec}{\mathbf q}\) \(\newcommand{\svec}{\mathbf s}\) \(\newcommand{\tvec}{\mathbf t}\) \(\newcommand{\uvec}{\mathbf u}\) \(\newcommand{\vvec}{\mathbf v}\) \(\newcommand{\wvec}{\mathbf w}\) \(\newcommand{\xvec}{\mathbf x}\) \(\newcommand{\yvec}{\mathbf y}\) \(\newcommand{\zvec}{\mathbf z}\) \(\newcommand{\rvec}{\mathbf r}\) \(\newcommand{\mvec}{\mathbf m}\) \(\newcommand{\zerovec}{\mathbf 0}\) \(\newcommand{\onevec}{\mathbf 1}\) \(\newcommand{\real}{\mathbb R}\) \(\newcommand{\twovec}[2]{\left[\begin{array}{r}#1 \\ #2 \end{array}\right]}\) \(\newcommand{\ctwovec}[2]{\left[\begin{array}{c}#1 \\ #2 \end{array}\right]}\) \(\newcommand{\threevec}[3]{\left[\begin{array}{r}#1 \\ #2 \\ #3 \end{array}\right]}\) \(\newcommand{\cthreevec}[3]{\left[\begin{array}{c}#1 \\ #2 \\ #3 \end{array}\right]}\) \(\newcommand{\fourvec}[4]{\left[\begin{array}{r}#1 \\ #2 \\ #3 \\ #4 \end{array}\right]}\) \(\newcommand{\cfourvec}[4]{\left[\begin{array}{c}#1 \\ #2 \\ #3 \\ #4 \end{array}\right]}\) \(\newcommand{\fivevec}[5]{\left[\begin{array}{r}#1 \\ #2 \\ #3 \\ #4 \\ #5 \\ \end{array}\right]}\) \(\newcommand{\cfivevec}[5]{\left[\begin{array}{c}#1 \\ #2 \\ #3 \\ #4 \\ #5 \\ \end{array}\right]}\) \(\newcommand{\mattwo}[4]{\left[\begin{array}{rr}#1 \amp #2 \\ #3 \amp #4 \\ \end{array}\right]}\) \(\newcommand{\laspan}[1]{\text{Span}\{#1\}}\) \(\newcommand{\bcal}{\cal B}\) \(\newcommand{\ccal}{\cal C}\) \(\newcommand{\scal}{\cal S}\) \(\newcommand{\wcal}{\cal W}\) \(\newcommand{\ecal}{\cal E}\) \(\newcommand{\coords}[2]{\left\{#1\right\}_{#2}}\) \(\newcommand{\gray}[1]{\color{gray}{#1}}\) \(\newcommand{\lgray}[1]{\color{lightgray}{#1}}\) \(\newcommand{\rank}{\operatorname{rank}}\) \(\newcommand{\row}{\text{Row}}\) \(\newcommand{\col}{\text{Col}}\) \(\renewcommand{\row}{\text{Row}}\) \(\newcommand{\nul}{\text{Nul}}\) \(\newcommand{\var}{\text{Var}}\) \(\newcommand{\corr}{\text{corr}}\) \(\newcommand{\len}[1]{\left|#1\right|}\) \(\newcommand{\bbar}{\overline{\bvec}}\) \(\newcommand{\bhat}{\widehat{\bvec}}\) \(\newcommand{\bperp}{\bvec^\perp}\) \(\newcommand{\xhat}{\widehat{\xvec}}\) \(\newcommand{\vhat}{\widehat{\vvec}}\) \(\newcommand{\uhat}{\widehat{\uvec}}\) \(\newcommand{\what}{\widehat{\wvec}}\) \(\newcommand{\Sighat}{\widehat{\Sigma}}\) \(\newcommand{\lt}{<}\) \(\newcommand{\gt}{>}\) \(\newcommand{\amp}{&}\) \(\definecolor{fillinmathshade}{gray}{0.9}\)The storage modulus measures the resistance to deformation in an elastic solid. It's related to the proportionality constant between stress and strain in Hooke's Law, which states that extension increases with force. In the dynamic mechanical analysis, we look at the stress (σ), which is the force per cross-sectional unit area, needed to cause an extension in the sample, or the strain (ε).
\[E = \dfrac{σ}{ ε}\]
Alternatively, in a shear experiment:
\[G = \dfrac{σ}{ε}\]
The dynamic mechanical analysis differs from simple tensile testing by performing the experiment cyclically. The sample is stretched and released (or sheared and released). It can then be subjected to additional stress and released again. There is an element of time involved here. Specifically, because the experiment is cyclic, it can be carried out at different frequencies. When you do that, and you plot the resulting modulus against frequency, you can get additional information about the sample. The results would typically be presented in a graph like this one:

What the graph tells us is that frequency clearly matters. When the experiment is run at higher frequencies, the storage modulus is higher. The material appears to be stiffer. In contrast, the loss modulus is lower at those high frequencies; the material behaves much less like a viscous liquid. In particular, the sharp drop in loss modulus is related to the relaxation time of the material. In this context, that's the time it takes the chains to flow into new conformations in response to the applied stress. If they don't have time to flow, then that viscous response of the material is lost. The material behaves much more like an elastic solid when subjected to high-frequency cyclic deformation. That's important to know, because a material might be subjected to vibrations or other stimuli during everyday use, and its properties might change accordingly.
Another variation on this kind of experiment is called dynamic mechanical thermal analysis. Instead of changing the frequency of the stimulus throughout the experiment, the frequency is held constant and the temperature is changed instead. As a result, we can again see how the material responds under different conditions, which might tell us how it will behave in everyday applications. The result of the experiment might be a graph like the one below:

At this point, you are already familiar with the glass transition. It shouldn't be surprising that the properties are dependent on temperature. At the glass transition temperature, the expanding volume of the material with increasing temperature becomes sufficient to allow chain flow. As a result, the material suddenly behaves much more like a viscous liquid. Loss modulus increases. The stiffness of the material drops as the entangled chains not longer resist deformation as strongly. Storage modulus decreases.
The dynamic mechanical thermal analysis thus provides an alternative way to determine the glass transition temperature. Because it is actually measuring a different physical phenomenon than differential scanning calorimetry, the Tg obtained from a DMTA experiment may not agree exactly with one obtained from a DSC experiment. Nevertheless, it is often useful to have different ways of assessing properties.
In order to facilitate the analysis of the Tg in this experiment, a different quantity is usually displayed. Tan delta is just the ratio of the loss modulus to the storage modulus. It peaks at the glass transition temperature.

The term "tan delta" refers to a mathematical treatment of storage modulus; it's what happens in-phase with (or at the same time as) the application of stress, whereas loss modulus happens out-of-phase with the application of stress. Because it would take some time for the chains to move into new confirmation when they are subjected to stress, the strain actually lags behind the stress in these experiments.
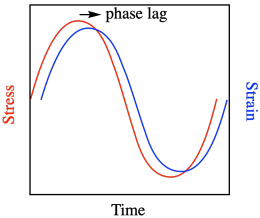
Delta refers to the phase lag, the amount of time between application of stress and the observation of maximum strain. You may remember that a sine curve and cosine curve are out of phase with each other. Storage modulus is described as being proportional to cosδ whereas loss modulus is proportional to sinδ. The ratio of cosδ to sinδ is just tanδ.
Why does tanδ peak at the glass transition temperature? Clearly, as chains begin to move more freely, loss modulus increases. Consequently, the material also becomes less stiff and more rubbery. The storage modulus drops. If tan delta is the ratio of loss modulus to storage modulus, it should increase at that point -- and it does. Why does it drop again? That's because loss modulus refers to an energy loss, but because the material has gotten softer, less stress (and less energy) is put into the sample in the first place, so the energy loss also gets smaller. As a result, tan delta goes up at the glass transition but drops again shortly beyond that point.
Problem PP9.1.
Estimate the storage and loss, modulus in the glassy phase and rubbery phase in each of the following cases.

Problem PP9.2.
Estimate Tg in each of the following cases.
