5.2: IR -SPECTROSCOPY- THE WORKHORSE
- Page ID
- 135964

\( \newcommand{\vecs}[1]{\overset { \scriptstyle \rightharpoonup} {\mathbf{#1}} } \)
\( \newcommand{\vecd}[1]{\overset{-\!-\!\rightharpoonup}{\vphantom{a}\smash {#1}}} \)
\( \newcommand{\id}{\mathrm{id}}\) \( \newcommand{\Span}{\mathrm{span}}\)
( \newcommand{\kernel}{\mathrm{null}\,}\) \( \newcommand{\range}{\mathrm{range}\,}\)
\( \newcommand{\RealPart}{\mathrm{Re}}\) \( \newcommand{\ImaginaryPart}{\mathrm{Im}}\)
\( \newcommand{\Argument}{\mathrm{Arg}}\) \( \newcommand{\norm}[1]{\| #1 \|}\)
\( \newcommand{\inner}[2]{\langle #1, #2 \rangle}\)
\( \newcommand{\Span}{\mathrm{span}}\)
\( \newcommand{\id}{\mathrm{id}}\)
\( \newcommand{\Span}{\mathrm{span}}\)
\( \newcommand{\kernel}{\mathrm{null}\,}\)
\( \newcommand{\range}{\mathrm{range}\,}\)
\( \newcommand{\RealPart}{\mathrm{Re}}\)
\( \newcommand{\ImaginaryPart}{\mathrm{Im}}\)
\( \newcommand{\Argument}{\mathrm{Arg}}\)
\( \newcommand{\norm}[1]{\| #1 \|}\)
\( \newcommand{\inner}[2]{\langle #1, #2 \rangle}\)
\( \newcommand{\Span}{\mathrm{span}}\) \( \newcommand{\AA}{\unicode[.8,0]{x212B}}\)
\( \newcommand{\vectorA}[1]{\vec{#1}} % arrow\)
\( \newcommand{\vectorAt}[1]{\vec{\text{#1}}} % arrow\)
\( \newcommand{\vectorB}[1]{\overset { \scriptstyle \rightharpoonup} {\mathbf{#1}} } \)
\( \newcommand{\vectorC}[1]{\textbf{#1}} \)
\( \newcommand{\vectorD}[1]{\overrightarrow{#1}} \)
\( \newcommand{\vectorDt}[1]{\overrightarrow{\text{#1}}} \)
\( \newcommand{\vectE}[1]{\overset{-\!-\!\rightharpoonup}{\vphantom{a}\smash{\mathbf {#1}}}} \)
\( \newcommand{\vecs}[1]{\overset { \scriptstyle \rightharpoonup} {\mathbf{#1}} } \)
\( \newcommand{\vecd}[1]{\overset{-\!-\!\rightharpoonup}{\vphantom{a}\smash {#1}}} \)
\(\newcommand{\avec}{\mathbf a}\) \(\newcommand{\bvec}{\mathbf b}\) \(\newcommand{\cvec}{\mathbf c}\) \(\newcommand{\dvec}{\mathbf d}\) \(\newcommand{\dtil}{\widetilde{\mathbf d}}\) \(\newcommand{\evec}{\mathbf e}\) \(\newcommand{\fvec}{\mathbf f}\) \(\newcommand{\nvec}{\mathbf n}\) \(\newcommand{\pvec}{\mathbf p}\) \(\newcommand{\qvec}{\mathbf q}\) \(\newcommand{\svec}{\mathbf s}\) \(\newcommand{\tvec}{\mathbf t}\) \(\newcommand{\uvec}{\mathbf u}\) \(\newcommand{\vvec}{\mathbf v}\) \(\newcommand{\wvec}{\mathbf w}\) \(\newcommand{\xvec}{\mathbf x}\) \(\newcommand{\yvec}{\mathbf y}\) \(\newcommand{\zvec}{\mathbf z}\) \(\newcommand{\rvec}{\mathbf r}\) \(\newcommand{\mvec}{\mathbf m}\) \(\newcommand{\zerovec}{\mathbf 0}\) \(\newcommand{\onevec}{\mathbf 1}\) \(\newcommand{\real}{\mathbb R}\) \(\newcommand{\twovec}[2]{\left[\begin{array}{r}#1 \\ #2 \end{array}\right]}\) \(\newcommand{\ctwovec}[2]{\left[\begin{array}{c}#1 \\ #2 \end{array}\right]}\) \(\newcommand{\threevec}[3]{\left[\begin{array}{r}#1 \\ #2 \\ #3 \end{array}\right]}\) \(\newcommand{\cthreevec}[3]{\left[\begin{array}{c}#1 \\ #2 \\ #3 \end{array}\right]}\) \(\newcommand{\fourvec}[4]{\left[\begin{array}{r}#1 \\ #2 \\ #3 \\ #4 \end{array}\right]}\) \(\newcommand{\cfourvec}[4]{\left[\begin{array}{c}#1 \\ #2 \\ #3 \\ #4 \end{array}\right]}\) \(\newcommand{\fivevec}[5]{\left[\begin{array}{r}#1 \\ #2 \\ #3 \\ #4 \\ #5 \\ \end{array}\right]}\) \(\newcommand{\cfivevec}[5]{\left[\begin{array}{c}#1 \\ #2 \\ #3 \\ #4 \\ #5 \\ \end{array}\right]}\) \(\newcommand{\mattwo}[4]{\left[\begin{array}{rr}#1 \amp #2 \\ #3 \amp #4 \\ \end{array}\right]}\) \(\newcommand{\laspan}[1]{\text{Span}\{#1\}}\) \(\newcommand{\bcal}{\cal B}\) \(\newcommand{\ccal}{\cal C}\) \(\newcommand{\scal}{\cal S}\) \(\newcommand{\wcal}{\cal W}\) \(\newcommand{\ecal}{\cal E}\) \(\newcommand{\coords}[2]{\left\{#1\right\}_{#2}}\) \(\newcommand{\gray}[1]{\color{gray}{#1}}\) \(\newcommand{\lgray}[1]{\color{lightgray}{#1}}\) \(\newcommand{\rank}{\operatorname{rank}}\) \(\newcommand{\row}{\text{Row}}\) \(\newcommand{\col}{\text{Col}}\) \(\renewcommand{\row}{\text{Row}}\) \(\newcommand{\nul}{\text{Nul}}\) \(\newcommand{\var}{\text{Var}}\) \(\newcommand{\corr}{\text{corr}}\) \(\newcommand{\len}[1]{\left|#1\right|}\) \(\newcommand{\bbar}{\overline{\bvec}}\) \(\newcommand{\bhat}{\widehat{\bvec}}\) \(\newcommand{\bperp}{\bvec^\perp}\) \(\newcommand{\xhat}{\widehat{\xvec}}\) \(\newcommand{\vhat}{\widehat{\vvec}}\) \(\newcommand{\uhat}{\widehat{\uvec}}\) \(\newcommand{\what}{\widehat{\wvec}}\) \(\newcommand{\Sighat}{\widehat{\Sigma}}\) \(\newcommand{\lt}{<}\) \(\newcommand{\gt}{>}\) \(\newcommand{\amp}{&}\) \(\definecolor{fillinmathshade}{gray}{0.9}\)IR-spectroscopy is perhaps the most frequently used technique in the organic chemistry labs at PSU. It is routinely used to identify products and to verify that an experiment has succeeded. One limitation of IR -spectroscopy that is worth remembering is that while the data can be used to distinguish clearly between many functional groups, the data is nearly useless for distinguishing between structural isomers, or characterizing carbon skeletons that contain the same functional groups
An IR -spectrum routinely shows peaks from the range of 3600 to 500 cm-1.
IR -frequencies correspond to the frequencies of molecular vibrations. Molecules vibrate at many frequencies, because each vibration involves a particular group of atoms, and a particular motion such as stretches, bending, wagging etc. The same group of atoms will often vibrate at the same frequency, regardless of the surrounding molecular structure. This fact enables us to assign specific peaks to specific functional groups.
There are several useful sources of IR-spectroscopy correlation tables, and a simplified version is supplied here. Although not very extensive, this table gives you information about the most important functional groups encountered in the organic chemistry labs at PSU.
Something that is worth noting is that many functional groups undergo two types of vibrations and produce peaks in two or more areas of the IR- spectrum. In these cases we should look for, and find, all of the peaks expected for the functional group. For example, if we use the presence of an O-H peak to conclude “alcohol”, we expect to find (and should look for) the presence of a C-O peak to confirm the conclusion. Likewise, the presence of a C-H sp2 peak, must mean that the spectrum contains a C=C peak. Whenever possible, base our conclusion on all of the relevant data in the spectrum. Do not “cherry pick” your results.
Table 1. Simplified IR spectroscopy correlation table
| Bond | Absorption [cm-1] | Frequency | Comments |
| O-H | 3600-3400 | The peak is usually broader than most, and its intensity and frequency vary with concentration. If present, also look for C-O peak. | |
| C-H (sp2) | 3080-3010 | Alkene or benzene. If present, also look for C=C peak. | |
| C-H (sp3) | 2960-2820 | If the sample is a DCM-solution, you will find a very strong solvent peak here that obscures any C-H (sp3) peaks that might be generated by the target compound. | |
| C-H (aldehyde) | 2720 and/or 2820 | Very characteristic. If present, also look for C=O peak. | |
| C=O (carbonyl) | 1750-1680 | Very characteristic. A large number of functional groups contain a carbonyl group, so, if present, also look for other peaks that might identify the functional group | |
| C=C | 1680-1600 | Alkene or benzene. | |
| C-O (alcohol, ester, ether) | 1300-1100 | Complementary bond in alcohol, esters and ethers (but not only those bonds). If an O-H peak is present, this might indicate an alcohol or carboxylic acid group, while the presence of a carbonyl peak and absence of O-H peak can indicate an ester group. The absence of both O-H and carbonyl peaks would indicate an ether group. |
In general, it is a good idea to obtain an IR -spectrum of the starting material as well as an IR- spectrum of the product. This allows for a direct comparison of the two spectra and makes it easier to establish that the starting material is no longer present, and to find new peaks that might correspond to the product.
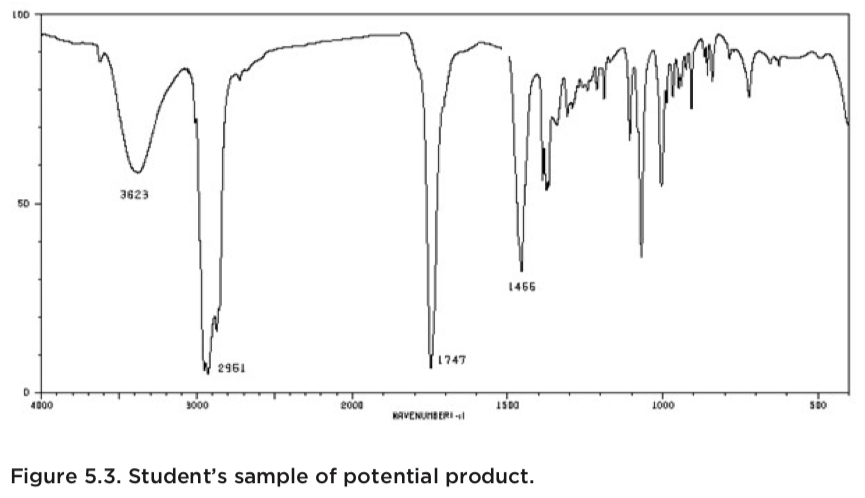
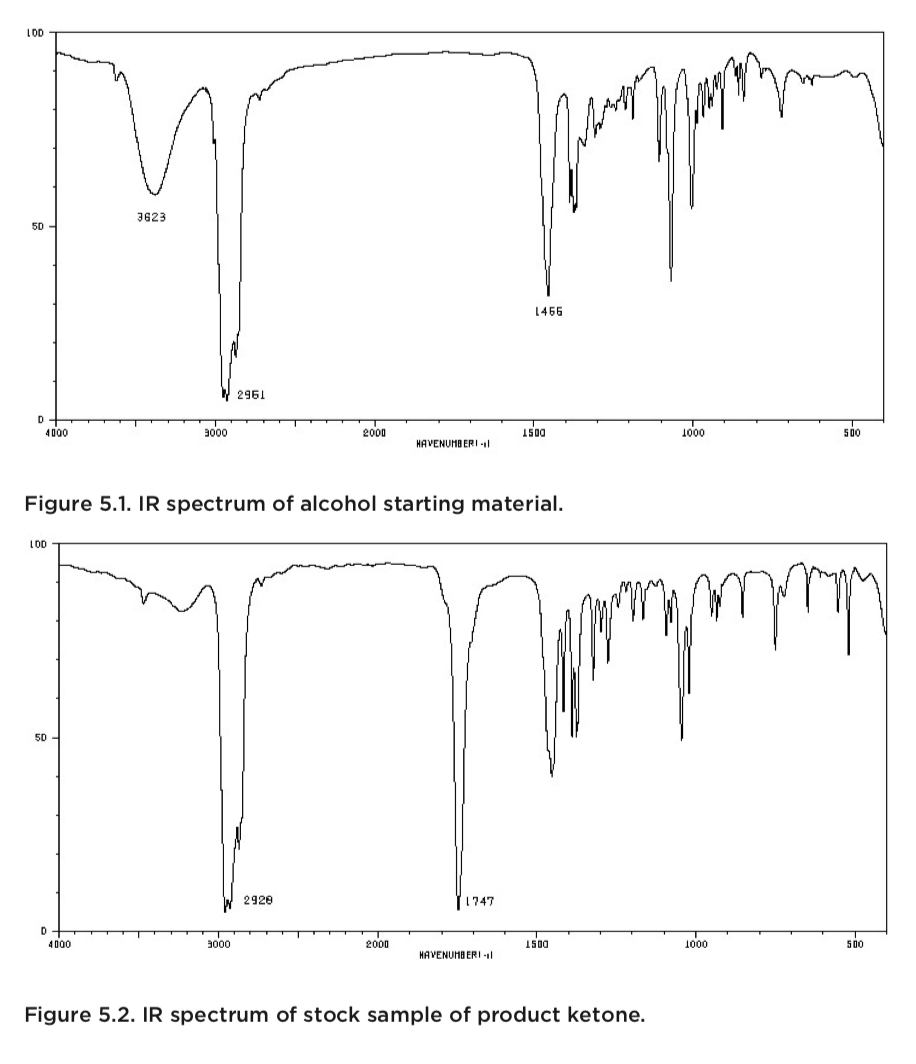
The spectra shown below come from an experiment in which a student tried to oxidize a secondary alcohol to a ketone. The top spectrum belongs to the starting material (alcohol), while the middle spectrum came from an authentic sample of the product. The bottom spectrum was obtained from a sample of the student’s product.
The student’s spectrum (bottom) contains a C=O peak at 1747 cm-1, but a comparison of this spectrum with the starting material (top) reveals an alternative interpretation. The starting material’s spectrum has a clear and distinct OH-peak (and the corresponding C-O peak). The spectrum from the stock sample of product, lacks the OH-peak, but a very characteristic C=O peak is readily observed. The IR-spectrum of the student’s product also indicates the presence of the desired ketone (strong C=O peak), but it also reveals the same O-H peak found in the starting material’s spectrum.
One logical conclusion from this analysis is that the student’s oxidation has not gone to completion or that the purification has not been satisfactory.
This is a microcosm of the entirety of IR -analysis: looking for the appearance of disappearance of specific peaks to answer the question of whether a reaction has worked or not.